Abstract
HSP90 inhibitors have the potential to treat many types of cancer due to the dependence of tumor cells on HSP90 for cell growth and proliferation. The Cullin-5 (Cul5) E3 ubiquitin ligase is required for HSP90 inhibitors to induce client protein degradation and subsequent cell death. Cul5 is expressed at low levels in breast cancer cells compared to patient matched controls. This observed low Cul5 expression may play a role in the reported decreased efficacy of 17-AAG and related HSP90 inhibitors as a monotherapy. We have developed a method for delivery of 17-AAG plus Cul5 DNA to cells via gold nanoparticles (AuNPs). Delivery of AuNPs containing Cul5 DNA increases the sensitivity of Cul5 deficient AU565 cells to 17-AAG. Characterization of AuNPs by UV-vis spectrum, TEM, gel electrophoresis assay and 1H NMR indicate attachment of both 17-AAG and DNA payload as well as AuNP stability. Studies in Cul5 deficient AU565 cells reveal that delivery of Cul5 and 17-AAG together increase cytotoxicity. Our results provide evidence that delivery of DNA with drug may serve as a method to sensitize drug resistant tumor cells.
Keywords: Cullin 5, gold nanoparticle, Hsp90, 17-AAG, cancer, ubiquitin ligase, chemotherapy
1. Introduction
Heat shock protein 90 (HSP90) chaperonins comprise 1–2% of total soluble cytosolic proteins in the eukaryotic cell and are highly conserved across all species [1],[2]. The structure of HSP90 contains an N-terminal domain, where the ATP binding pocket and charged linker region are located, a middle domain responsible for binding clients and a C-terminal domain, responsible for binding co-chaperones [3][4] [5]. HSP90 interacts with more than one hundred different clients, many of which are kinases or transcription factors that can become dysregulated in tumor cells [1], [3]. HSP90 is overexpressed in many cancers due to the high burden of dysregulated or mutated client proteins [6].
HSP90 stabilizes mutated or overexpressed clients that contribute to tumor progression and inhibition results in client degradation making it a good target for anti-cancer therapy. We have previously reported that upon inhibition with geldanamycin, a natural benzoquinone ansamycin, the Hsp90 clients, HER2 and hypoxia inducing factor-1A (HIF-1A) are ubiquitinated by a Cullin 5 (Cul5) ubiquitin ligase and degraded via the proteasome [7]. The function of HSP90 is dependent on ATP binding to change conformation from open to closed [3]. Many Hsp90 inhibitors block ATP binding [8]. Hsp90 inhibitors have received much attention for treating HER2+ breast cancer as Hsp90 inhibition has been reported to cause a decrease in HER2 levels at the cell membrane [9].
17-N-allylamino-17-demethoxygeldanamycin (17-AAG), commercially known as Tanespimycin, is a derivative of geldanamycin [10]. Over the last 20 years, eighteen Hsp90 inhibitors, including 17-AAG, have entered clinical trials however these inhibitors have failed to make it past phase II clinical trials as a monotherapy [11]. We hypothesize that in the case of HER2+ breast cancer, reduced Cul5 expression may contribute to the poor performance of 17-AAG as a monotherapy in clinical trials. We previously reported that Cul5 is required for GA induced degradation of HER2 and HIF1A [7]. Samant et al. [12] reported that depletion of Cul5 resulted in decreased sensitivity to 17-AAG in colorectal, breast, lung, and melanoma cell lines. In a study of 50 cases of breast cancer, Fay et al. reported a 2.2 fold decrease in the amount of Cul5 present in tumor vs healthy tissue [13]. The chromosomal region where Cul5 is located, 11q22–23 was reported to have undergone loss of heterozygosity, in 38% of primary breast tumors and in 84% of local recurrences[14].
Here we report the synthesis of gold nanoparticles (AuNPs) to deliver Cul5 DNA plus 17-AAG to drug resistant breast cancer cells. The gold core of AuNPs is inert and non-cytotoxic and elicits low to no immunogenicity allowing for only what the AuNP is functionalized with to exert an effect [15]. AuNPs have a large surface to volume ratio, allowing for more drug and/or biomolecule delivery with a small amount of gold [15, 16]. AuNPs are less susceptible to development of drug resistance owing to their endosomal uptake where the payload is protected from drug resistance proteins, such as P-glycoprotein.
AuNPs are typically capped with a ligand. Ligands serve to keep the gold atoms from aggregating, thereby stabilizing the gold atom clusters, to allow for functionalization with the payload [17], and to give the AuNP a specific characteristic, such as a positive charge for facilitating uptake [18]. We utilized glutathione (GSH) as a ligand as cancer cells are reported to have increased levels of GSH, [19] likely to protect the cells from reactive oxygen species [20]. Studies have shown elevated levels of GSH in cells can act as a payload releaser [21, 22]. The sulfurs within cytosolic GSH and the AuNP surface interact, facilitating bond breakage and release [21], [22]. Zhou et al. reported that AuNPs coated with GSH were stable in the blood stream and did not form aggregates, versus PEG (another widely used ligand) coated AuNPs [23]. Nanoparticles are thought to reach the tumor site via the enhanced permeability retention (EPR) effect; nanoparticles will preferentially enter tumor sites through the poor and gapped vasculature of the tumor compared to the tightly, well organized blood vessels of healthy tissue [24].
Here we report the synthesis of gold nanoparticles (AuNPs) loaded with Cul5 DNA plus 17-AAG or Cul5 DNA alone. We have characterized the AuNPs and demonstrate binding of DNA and 17-AAG to the nanoparticles as well as stability across a range of ionic strengths and in serum. We evaluated the function of the AuNPs in sensitizing Cul5 deficient AU565 cells to 17-AAG and observed increased cytotoxicity in cells treated with Cul5 AuNPs. Our results indicate that using AuNPs to deliver DNA plus drug may serve as a means to sensitize tumor cells that are resistant to chemotherapeutic drugs due to resistance arising from a genetic defect.
2. Materials and Methods
2.1. Glutathione Gold Nanoparticle Synthesis
2.1.1. Glassware Preparation.
All glassware was washed thoroughly with soap and distilled (DI) water and soaked in a base bath for ≥30 minutes. Glassware was then rinsed with DI water, followed by 18.2 MΩ Milli-Q (MQ) water (Millipore) and acetone if using an organic solvent. Glassware was air dried.
2.1.2. Au-GSH nanoparticle (System 1).
Chloroauric acid (Sigma-Aldrich, 99.995%) was dissolved in methanol to create a 0.01 M solution. 40 mL gold solution was placed in a 250 mL round bottom flask with 10 mL of 0.10 M L-glutathione (Sigma-Aldrich, ≥98.0%) solution. The solution was rapidly stirred for 2 hours. 10 mL of 0.05 M sodium borohydride (Sigma-Aldrich, ≥98%) was rapidly added to the flask and left to stir for 4 hours. Resulting product contained a mixture of nanoparticle sizes, so this step was followed by size separation using selective precipitation.
AuNPs were centrifuged at 3000 rpm for 3 minutes. The supernatant was poured off and the AuNPs were resuspended in 500 μL MQ water. AuNPs were precipitated using methanol. AuNPs were washed with a 4:1 ratio of methanol: MQ water. AuNPs were dried using roto-evaporation. AuNPs without plasmonic peaks were used for conjugation of 17-AAG and Cullin-5 DNA.
2.1.3. Au-GSH-Cul5 DNA nanoparticle (System 2).
HA tagged Cullin- 5 plasmid DNA was added to system 1 AuNPs by adding 1:50 w/w of NP:1-(3-Dimethylaminopropyl)-3-ethylcarbodiimide hydrochloride (EDC) (Alfa Aesar, 98+%) dissolved in 10 mL of 0.05 M 2-(N-Morpholino) ethanesulfonic acid (MES) (Sigma-Aldrich, >99.5%). Reactions were stirred for 30 minutes before adjusting pH to approximately 7. Then 500 ng, 1000 ng or 1500 ng of DNA was added to the solution and left to stir overnight. Samples were dried via roto-evaporation and washed with tetrahydrofuran (THF) (Alfa Aesar, 99%).
2.1.4. Au-GSH-17-AAG nanoparticle (System 3).
17-AAG (Sellekchem, 99.92%) was added to system 1 AuNPs in the same manner as described for DNA. 10 μL, 50 μL or 100 μL of 50 mM of 17-AAG was added and left to mix overnight. Samples were dried via roto-evaporation and washed with THF.
2.1.5. Au-GSH-Cul5 DNA-17-AAG nanoparticle (System 4).
500 ng of Cul5 DNA and 10 μL of 50 mM 17-AAG were added to system 1 nanoparticles using 1:50 w/w, NP:EDC dissolved in 10 mL 0.05 M MES. After stirring for 30 minutes the pH was adjusted to ~6.5. Cul5 DNA and 17-AAG were added simultaneously and left to spin overnight. Samples were dried via roto-evaporation and washed with THF.
2.2. Characterization Methods
2.2.1. UV-Vis.
Samples were dissolved in MQ water, NaCl in PBS, or serum in PBS at the indicated concentrations in a semi-micro cuvette for stability studies. UV-Vis spectrum (Agilent Technologies, Cary 60 UV-Vis) was taken from 900 nm to 200 nm to estimate size and observe peak markers of payload. Solvent background was subtracted, and data was normalized to one. Data was plotted using Origin program.
2.2.2. Proton Nuclear Magnetic Resonance (1HNMR).
NMR tubes were washed thoroughly with acetone and dried overnight at 80°C. Samples were dissolved in deuterium oxide (Sigma, 99.9%). Iodine was added to release the payload from the AuNPs. 1HNMR was run using a JEOL 400 MHz instrument. Data was plotted using Origin program. Peaks were integrated utilizing Delta software.
2.2.3. Gel Assays.
AuNPs from systems 1 and 2 were loaded on a 2% agarose gel. DNA and AuNPs were visualized using ethidium bromide and UV following electrophoresis.
2.2.4. TEM.
Samples were deposited on Formvar Film, 400 mesh copper grids (Ted Pela) and left to dry under vacuum. Samples were imaged at George Washington University, Nanofabrication and Imaging Center using Scanning/Transmission Electron Microscope (S/TEM) Thermo Fisher Scientific (FEI) TALOS, 200 KV. Initial imaging of the nanoparticles were carried out on an Apreo field emission scanning electron microscope (Thermo Fisher).
2.3. Cell studies
2.3.1. Cell Culture Maintenance.
293T cells, were grown in Dulbecco’s modified Eagle’s medium (DMEM) with 10% fetal bovine serum (FBS). Wild type (WT) AU565 and AU565 Cul5 knockdown (Cul5 KD) cells were cultured in Roswell Park Memorial Institute-1640 (RPMI-1640) media with 10% FBS. Cul5 knockdown cells were cultured in media with - puromycin (2.25μg/mL). Cul5 knockdown cells were established via transduction with a lentivirus containing shRNA targeting Cul5.
2.3.2. Production of Cul5 deficient AU565 cells.
Lentiviruses containing control or Cul5 targeting shRNA were obtained from Sigma Aldrich. Cells were plated in 12-well plates at a concentration of 1.6 × 10⁴ cells/mL. Lentivirus was added at a multiplicity of infection (MOI) of 3. Twenty-four hours post transduction, medium was replaced with fresh medium containing puromycin. Puromycin was added at a concentration of 2.25 μg/mL and replaced every 4 days. Cells were selected for 2 weeks. Cul5 knock-down was confirmed via qPCR.
2.3.3. MTT Assays.
Cells were plated in 96-well plates and incubated until it was 60 – 70% confluent. Cells were treated with the previously indicated amounts of AuNPs. After 24–48 hours of treatment the media was removed, and cells were washed with 200 μl of PBS. 10 μl of 5 mg/mL tetrazolium salt was added to cells and allowed to incubate for 2 hours. 200 μl of 2% HCl in isopropanol was added to cells to dissolve the salt to purple formazan. Cells were incubated at room temperature with shaking for 30 minutes. The optical density of the cells was determined by measuring absorbance at 570/630 nm using a VERSAmax Tunable Microplate Reader. Cell viability was calculated by taking the difference of the two wavelengths used and comparing that value to the control values. All reactions were performed in triplicate.
2.3.4. Inductively Coupled Plasma- Mass Spectrometry (ICPMS).
Cells were plated in a 6 well plate and grown to 80–90% confluency. AuNPs (1 mg) were added to media and left to incubate for 8 hours. Cells were washed in cold 1× PBS and trypsinized to harvest cells. Cells were spun down at 1200 rpm for 15 minutes and washed with additional PBS to ensure all AuNPs were removed. Pellets were dried overnight at 80°C. Pellets were digested in 50:50, aqua regia:internal standard solution (SS) and heated at 100°C for 1 hour. Internal standard solution was prepared by dissolving indium (Claritas PPT, 10 mg/L, Lot# C15–60IN) in 3N nitric acid (trace metal grade) to produce a 1 ppb indium solution which was stored in a 0.5 gallon Nalgene (LDPE) stock container. The indium was used as the internal standard to correct for instrumental drift during the ICP-MS analysis and was spiked into all blanks, calibration standards, and the sample solutions. (The indium counts measured in the first blank are stored in the computer. The indium counts are measured for each sample and ratioed to those stored from the first run. The ion counts measured for each sample are then multiplied by the ratio of these indium counts to correct for drift throughout the run.) Multi-element solution 2A (10 mg/L) (Claritas, Lot# 22–68AS) was used to prepare calibration standards from 0.5 ppb to 200 ppb in ISS in 15 ml centrifuge tubes.
Samples were run on a Thermo Elemental (VG) PlasmaQuad ExCell ICP/MS. Samples were introduced via a variable speed peristaltic pump and a Cetac (ASX-520HS) auto sampler rack. The auto sampler removed 2 ml aliquots of solution via the pump. From each sample 3 replicate measurements were recorded.
2.3.5. Statistical Analysis.
MTT data was subject to two-way ANOVA with multiple comparisons. Calculations were done using GraphPad PRISM.
2.3.6. Western Blot.
Cells were harvested via addition of 4× Laemmli Sample Buffer and heated at 95°C for 5 min. Cell lysates were separated on a Bis-Tris 4–20% acrylamide gel, transferred to a PVDF membrane, and blocked with 5% nonfat dry milk in PBS. Membranes were probed with antibody against HA-Cul5 or β-actin as a loading control, followed by HRP conjugated secondary antibody against rabbit IgG. Blots were developed using ECL western blotting substrate and visualized using a LICOR C-DiGit Blot scanner.
3. Results
3.1. Cul5 downregulation results in resistance to 17-AAG.
We have previously reported that Cul5 is required for polyubiquitination and degradation of Hsp90 clients following chaperone inhibition [7]. In an analysis of gene expression data from 62 breast invasive carcinoma samples, we observed Cul5 downregulation in all but 11 patients (Figure 1a). This data is consistent with a 2003 report by Fay et al. [13]. In agreement with previous reports, shRNA mediated downregulation of Cul5 in the AU565 breast cancer cell line resulted in resistance to 17-AAG (Figure 1b–c) [12]. We observed a correlation between Cul5 expression and sensitivity to 17-AAG when multiple cell lines were evaluated (Figure. 1 d–e). Since low Cul5 expression results in resistance to HSP90, we hypothesized introducing Cul5 and 17-AAG in tandem should increase overall drug efficacy.
Figure 1. Cul5 expression is required for sensitivity to 17-AAG.
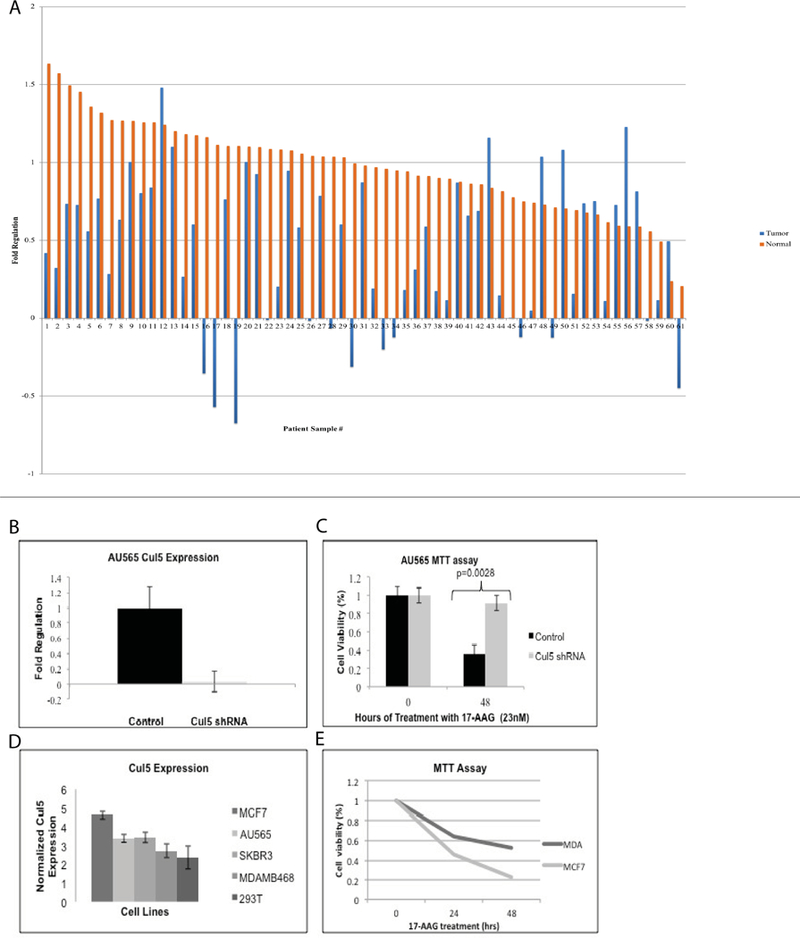
A. Cul5 expression is decreased in 82% of breast invasive carcinomas. Gene expression data was obtained from the Cancer Genome Atlas. We analyzed Cul5 expression data for tumor and matched normal tissue from 62 breast invasive carcinoma samples. We observed decreased expression of Cul5 in tumor compared to normal tissue in all but 11 patients (t = −5.6155, df = 61, p-value = 5.119e-07). B-C. Experimental downregulation of Cul5 in breast cancer cells results in resistance to 17-AAG. Cul5 was stably downregulated in AU565 cells using MISSION shRNA targeting Cul5 or a non-targeting control shRNA. B. Cul5 knockdown was verified using qPCR. C. Sensitivity to 17-AAG was evaluated via MTT assay following 48h treatment with 23nM 17-AAG or DMSO control. D-E. Sensitivity to 17-AAG correlates with Cul5 expression. cDNA was prepared from MCF7, AU565, SKBR3, MDAMB468, and 293T cells lines. D. Cul5 expression was assessed via quantitative real-time PCR. E. Sensitivity to 17-AAG was assessed via MTT assay. Cells were treated with 23 nM 17-AAG or DMSO control for the indicated times. Viability was calculated relative to DMSO controls.
3.2. Synthesis and characterization of AuNPs to deliver Cul5 DNA and 17-AAG to cancer cells
To deliver 17-AAG and Cul5 DNA to tumor cells we utilized gold nanoparticles (AuNPs). We synthesized ultra-small AuNPs using GSH as the ligand that have Cul5 DNA and 17-AAG attached as described in Table 1. The concentrations of DNA and 17-AAG used in the synthesis of final AuNPs were determined empirically through evaluation of AuNP, DNA, and 17-AAG concentrations individually to identify concentrations of AuNPs and DNA with highest activity and minimal toxicity and the lowest concentrations of 17-AAG with maximal cytotoxicity (see supplemental data, S1).
Table 1.
Formulations of different nanoparticles used in this study.
| System | Ligand - payload |
|---|---|
| 1 | GSH only |
| 2 | GSH – Cul5 DNA |
| 3 | GSH- 17-AAG |
| 4 | GSH-Cul5 DNA + 17-AAG |
3.2.1. UV-Vis.
The concentrations of payload (500 ng of DNA and 10 μL of 50 mM 17-AAG) utilized in cell-based assays were below the threshold necessary to obtain peaks corresponding to the payload. We observed a blue shift in the curve indicating binding of the payload (Figure 2 a–d). The concentrations of the payload are below the observable limit in the UV-spectra which we believe is due to low concentration of DNA and the extinction coefficient of gold being high [24]. When elevated levels of DNA (1500 ng) or 17-AAG (50 μL of 50 mM) were utilized for AuNP synthesis, peaks corresponding to DNA at 260 nm and 17-AAG at 239 nm and 332 nm were observed, indicating that there is covalent binding of the payload (Figure 3 a–b).
Figure 2. UV-Vis spectral analysis of systems 1–4.
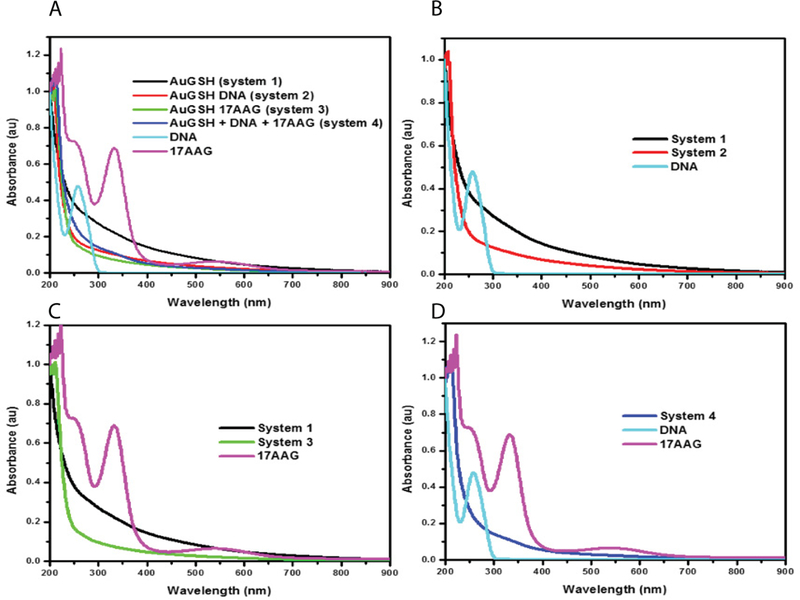
A.) UV-Vis spectrums were taken of all 4 samples and their graphs were normalized to one and plotted together. B- D.) Comparison of UV-Vis spectrums of systems 2–4 with their respective payload.
Figure 3. UV-Vis spectral analysis of AuNPs with higher concentrations of payload.
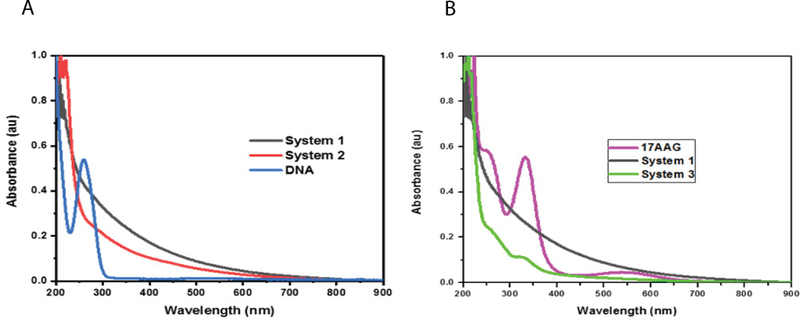
A. 1500 ng DNA was added to synthesis reaction of system 2. B. 50 μL of 17-AAG was added to system 3 synthesis reaction.
The stability of AuNPs solutions of increasing ionic strength and serum was assessed by UV-Vis spectra (Figures 4–5). All data was collected within a range of 300 – 900 nm and normalized at 300 nm. The stability of AuNPs was evaluated at increasing concentrations of NaCl ranging from 1–5000 mM. Spectra were recorded at 1 and 24 h incubation. All systems exhibited stability and were not affected by increasing ionic strength as evidenced by overlapping spectra (Figures 4 a–h).
Figure 4. UV-Vis spectral analysis of AuNPs in solutions of increasing ionic strength.
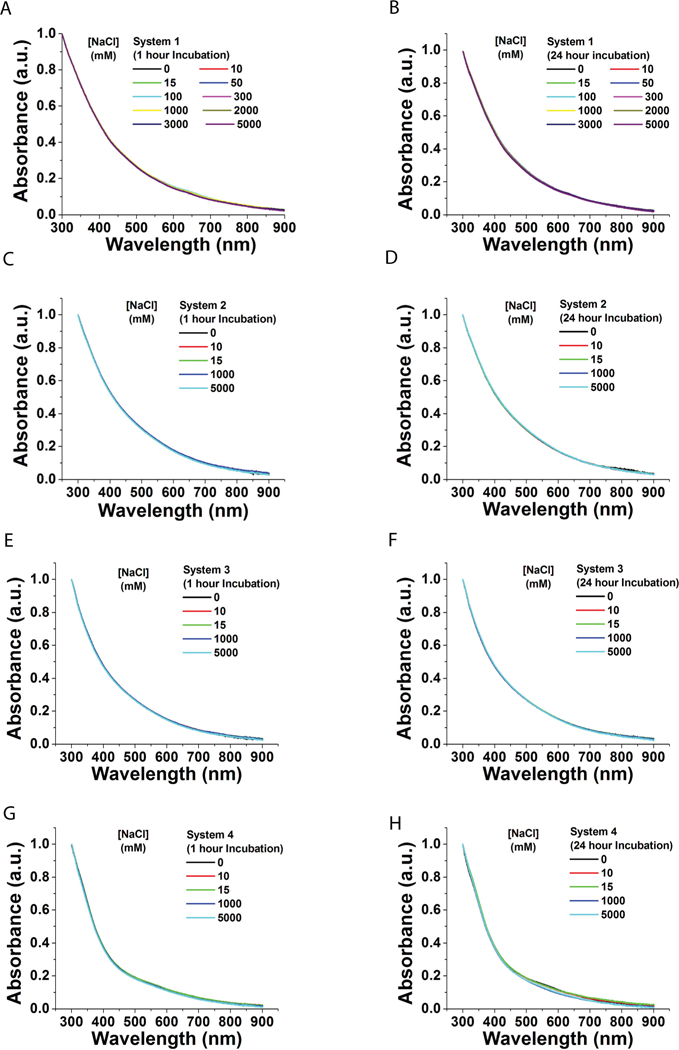
A-B. System 1. (A) 1 hr (B) 24 hrs. C-D. System 2. (C) 1 hr (D) 24 hrs. E-F. System 3. (E) 1 hr (F) 24 hrs. G-H. System 4. (G) 1 hr (H) 24 hrs. All data normalized at 300 nm. NaCl solution range = 1–5000 mM. 5 mM PBS was used for dilution.
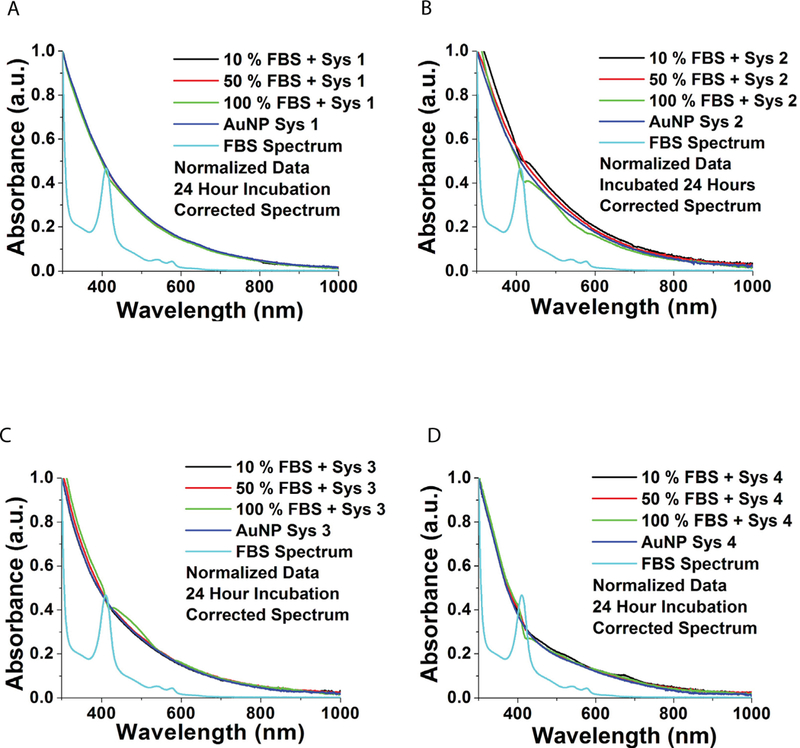
Figure 5. UV-Vis spectral analysis of AuNPs in serum.
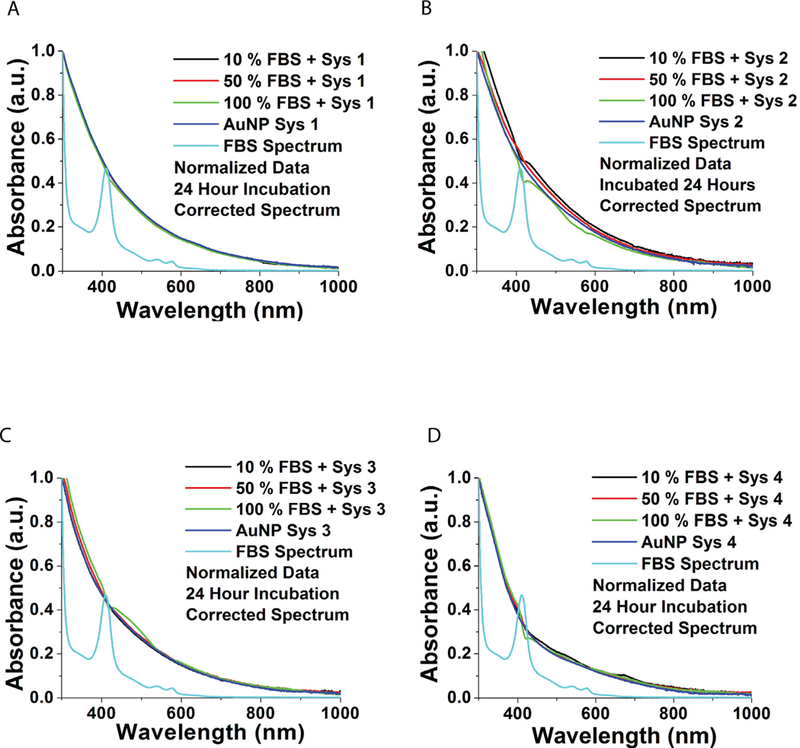
AuNPs were incubated in solutions of 0, 10, 50 and 100% fetal bovine serum in PBS for 24h. A. System 1. B. System 2. C. System 3. D. System 4.
AuNP stability was then evaluated at different concentrations of Fetal Bovine Serum (FBS). Solutions were prepared at the following ratios of phosphate buffered saline (PBS):undiluted FBS; 9:1, 1:1 and 0:1 (final concentration of solutions contained 10%, 50% and 100% FBS). To these FBS solutions, each AuNP system was added and allowed to incubate for 24 hours. The stability of the AuNPs were analyzed using UV-Vis spectroscopy following a 24 h incubation. Spectra of all four AuNP systems indicate AuNP stability, as no change in background was observed, suggesting an absence of aggregation or change in nanoparticle core size (Figures 5 a–d).
3.2.2. 1H NMR.
1H NMR was used to confirm the composition of the payload on AuNPs. Through comparison with 1H NMR signatures of GSH (Figure. 6 a–b), DNA (Figure. 6 a) and 17-AAG (Figure. 6b) we determined that our payload was present on the AuNP surface. We observed protons from the deoxyribose sugar from the DNA backbone at 1.72 ppm and 3.33 ppm as well as protons from the GSH ligand (Figure 6a) on the system 2 AuNPs containing GSH linked DNA. System 3, containing only 17-AAG, exhibited prominent peaks at 0.86, 0.95 and 1.79 ppm indicative of 17-AAG (Figure 6 b). Based on the integration of peak:proton ratio we estimated that system 2 has 0.06 DNA molecules for every 0.27 GSH molecules on an average, which translates to an average of one DNA molecule for every 5 GSH molecule per nanoparticle and system 3 has 0.06 17-AAG molecules for every 0.5 GSH molecules on an average (17-AAG:GSH = 1:8 per nanoparticle) (Table 2), suggesting that Cul5 DNA is twice as abundant on the surface of the nanoparticle as 17-AAG.
Figure 6. 1H NMR indicates payload attachment. A-C. 1H NMR of system 2.
A. Structure of deoxyribose sugar of DNA backbone. Circled hydrogens can be paired with peaks in 4C. B. Structure of GSH, circled hydrogens indicate the pronounced/highlighted peaks in 4C. C. 1H NMR of system 2 with peaks indicative of payload attachment circled. 1H NMR of system 3. A. Structure of 17-AAG. Circled hydrogens can be paired with peaks in 4C. B. Structure of GSH, circled hydrogens indicate the pronounced/highlighted peaks in 4C. C. 1H NMR of system 3 with peaks indicative of payload attachment circled.
Table 2.
Estimated composition of system 2 and 3 AuNPs based on integration of peak: proton ratio obtained from 1H NMR.
| Sample | Compound Peak Indicative Of |
Peak (ppm) |
Functional Group |
Number of Protons |
Integration of Peak |
Ratio for One Proton |
|---|---|---|---|---|---|---|
| System 2 | GSH | 3.0057–3.0240 | CH2 | 2 | 0.54 | 0.27 |
| System 2 | DNA | 1.7228 | CH3 | 3 | 0.18 | 0.06 |
| System 3 | GSH | 3.0057–2.9301 | CH2 | 2 | 1 | 0.5 |
| System 3 | 17-AAG | 0.9621–0.8762 | CH3 | 3 | 0.19 | 0.063 |
3.2.3. Gel Assays.
To further characterize the AuNPs, an agarose gel assay was used to visualize migration of the DNA with the modified AuNPs (Figure. 7).. In the absence of pH adjustment during AuNP synthesis, DNA was not bound to the AuNPs (Figure 7b), however following adjustment of the pH to 7.0, co-migration of the DNA and AuNPs was observed indicating efficient ligation of the DNA to the GSH ligand (Figure 7, compare a, lane 2 with b, lane 2).
Figure 7. Agarose gel assay to visualize attachment of DNA to AuNPs.
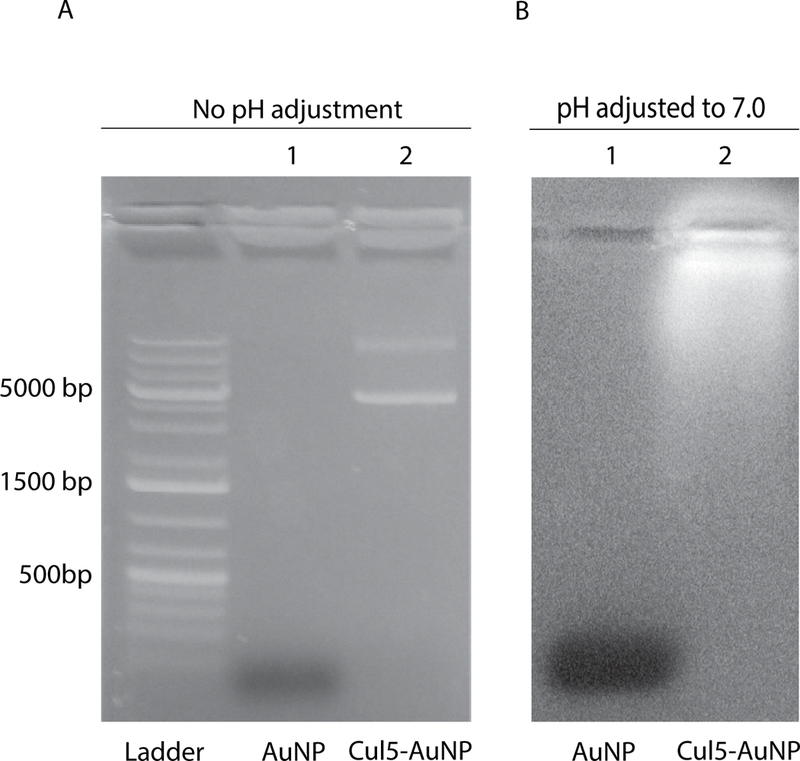
A. Lane 1: System 1, lane 2; system 2 synthesized without pH correction. B. Lane 1: system 1, lane 2: system 2 synthesized with pH adjusted to 7.0. System 1 = GSH-AuNP, System 2 = Cul5-AuNP.
3.2.4. Transmission electron microscopy (TEM).
TEM was used to estimate AuNP diameter and number of Au atoms per GSH chain. Images obtained from each system exhibit AuNPs with diameters of 1–2 nm. These data support our UV-Vis data, as we did not observe a plasmonic peak visible in the 520 nm range. From the TEM obtained diameters, the number of gold atoms and GSH chains were estimated using the method outlined in Hostetler et al. [25]. System 1 contained approximately 79 atoms and 38 GSH chains, system 2, approximately 201 atoms and 71 GSH chains and system 3, approximately 140 atoms and 53 GSH chains. (Figure 8 a–c).
Figure 8. TEM imaging.
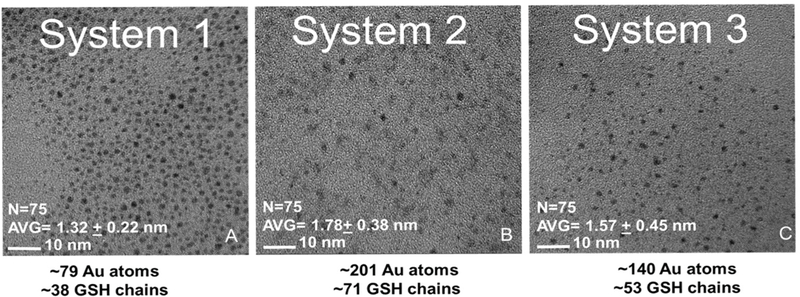
A-C.) TEM images of systems 1 to 3 with scale bar of 10 nm. Gold atoms and GSH chains were estimated based on Hostetler et al. System 1 = GSH-AuNP, System 2 = Cul5-AuNP, System 3 = 17-AAG-AuNP
3.3. Cell Studies
3.3.1. 293T Cell Studies.
To determine the optimal amounts of Cul5 DNA and 17-AAG to use for AuNP synthesis, MTT assays were performed using 293T cells. 293T cells were treated with increasing amounts of AuNPs with 500 ng, 1000 ng or 1500 ng of Cul5 DNA (Figure S1). AuNPs with 500 ng of DNA displayed the highest cell viability with approximately 90% of cells surviving at 5 μg AuNPs, compared to an approximate 10% decrease in cell survival in cells treated with the nanoparticles synthesized with 1000 ng and 1500 ng DNA. To determine the lowest level of 17-AAG that will cause maximal cell death, 293T cells were treated with AuNPs synthesized with increasing amounts of 50 mM 17-AAG (Figure S1). AuNPs with 10 μL of 50 mM 17-AAG displayed the highest levels of cytotoxicity with an IC50 of approximately 20 μg, compared to higher concentrations of 17-AAG (Figure S1). To control for nonspecific cytotoxicity arising from AuNPs alone, we normalized treatment conditions with empty AuNPs. MTT assays were carried out using 45 ng total AuNPs per 200 μL assay (0.225ng/ μl). Cells treated with 17-AAG alone or with 17-AAG plus Cul5 DNA exhibited 89% and 86% cytotoxicity, respectively, compared to 11% cytotoxicity in AuNP only controls. We observed 41% cytotoxicity in cells treated with Cul5-AuNPs. This result was not surprising, since these assays were performed in 293T cells that do not have decreased Cul5 expression. Over expression of Cul5 has been observed to have a dominant negative effect on endogenous Cul5 containing ubiquitin ligases [7] (Figure. 9). We would expect this effect to be diminished in Cul5 deficient cells. These data suggest that AuNPs, at the concentration chosen, induce minimal toxicity in 293T cells and the observed cytotoxicity is due to HSP90 inhibition by 17-AAG.
Figure 9. The observed cytotoxicity in 293T cells is due to HSP90 inhibition by 17-AAG.
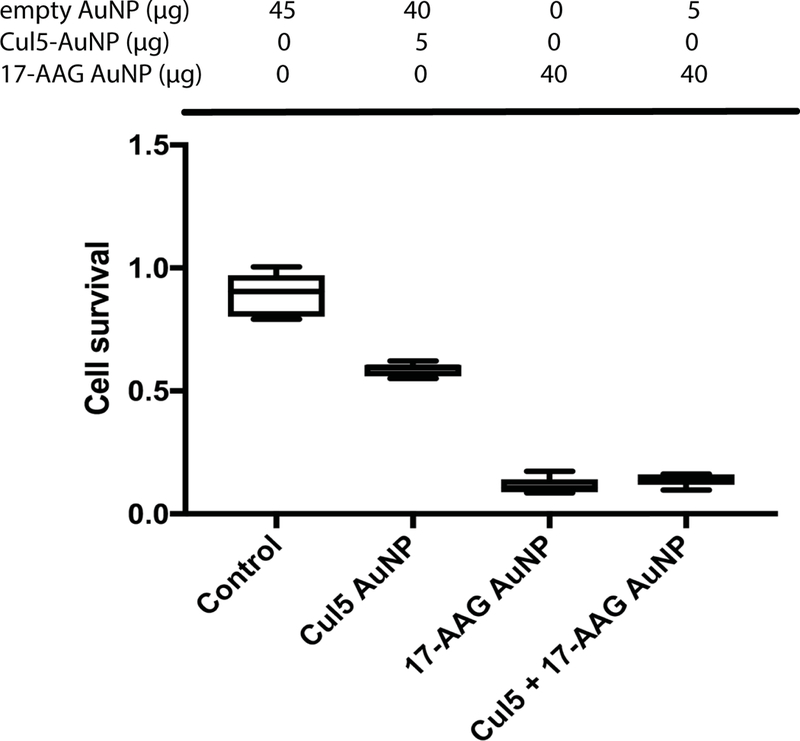
293T cells were treated with system 2, system 3 or a combination of the two. All treatments were normalized to 45 μg total AuNPs with system 1. Cells were assessed for viability via MTT assay following 24 h incubation.
To confirm that the Cul5 DNA being delivered to cells was being transcribed and translated into protein, both wild-type and Cul5 knockdown AU565 cells were treated with increasing amounts of control system 1 AuNPs or Cul5 DNA ligated system 2 AuNPs. Cell lysates were analyzed via immunoblot for HA tagged Cul5 protein. Cul5 protein was detected in cells treated with system 2 and not control system 1 (Figure 10). Inductively coupled plasma mass spectrometry (ICPMS) was utilized to quantify the amount of AuNPs being taken up by 293T cells (Table 2). 293T cells were treated with all AuNPs. System 1 had the highest uptake with 0.86 fMol:cell. This suggests that addition of payload decreases uptake about tenfold to 0.086 fMol:cell for system 2 and 0.073 fMol:cell for system 3. This effect may be due to GSH masking by payload.
Figure 10. Cul5 protein is expressed in cells treated with system 2 Cul5-AuNPs.
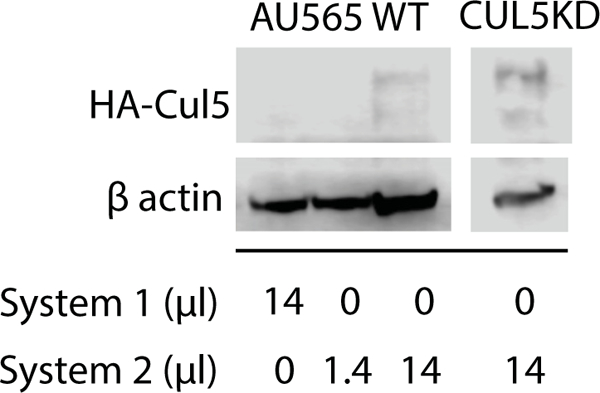
Wild-type or Cul5 deficient AU565 cells were treated with increasing amounts of system 1 (control) or system 2 (Cul5 DNA) AuNPs. Cul5 expression was analyzed by SDS PAGE followed by immunoblot against HA-Cul5 and β-actin as a loading control.
3.3.2. AU565 Cell studies
AU565 cells were used to determine whether enhancing Cul5 expression would increase the efficacy of 17-AAG in Cul5 deficient breast cancer cells. AU565 cells are metastatic breast cancer cells, that over express HER2, a client of HSP90 and a well characterized oncogene. Cul5 expression was experimentally reduced in these cells via transduction with shRNA targeting Cul5 (Figure. 1b). To determine the most effective dose of Cul5 NPs, wild-type (Cul5 WT) and Cul5 knock-down (Cul5 KD) AU565 cells were treated for 48 hours with increasing amounts of Cul5-AuNPs in a 200 μL assay volume (Figure 11 a). Cell survival was determined via MTT assay. Our objective was to identify a working Cul5-AuNP concentration with minimal effects on cell viability. WT AU565 cells were significantly more sensitive (p< 0.05) to Cul5-AuNPs compared to Cul5 KD cells which had an IC50 of ~60 μg (0.3μg/ μL). System 2 exhibited toxic effects on Cul5 KD cells at levels greater than 50 μg (0.25μg/ μL), where cell survival began to decrease below 100%.
Figure 11. Cul5 DNA + 17-AAG AuNPs sensitize Cul5 deficient cells to Hsp90 inhibitor mediated cell death.
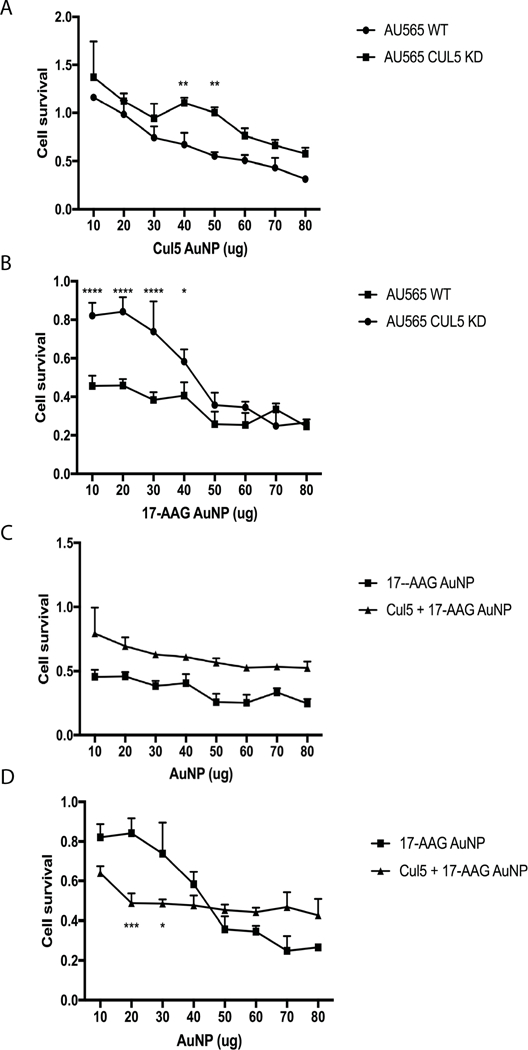
A Cul5-AuNPs have minimal toxicity in WT and CUL5 deficient AU565 cells at concentrations below 0.2μg/μL. Cells were treated with increasing amounts of Cul5-AuNPs in a total assay volume of 200 μL for 48 h then evaluated for cytotoxicity via MTT assay. B. Cul5 KD cells are resistant to 17-AAG at concentrations <0.25μg/μL. WT AU565 and Cul5 KD AU565 cells were treated with increasing amounts of 17-AAG AuNPs in a total assay volume of 200 μl for 48 hours and then assessed for cell death via MTT assay. * p = 0.02, **** p < 0.00001 C. Comparison of systems 3 and 4 in WT AU565 cells. WT AU565 cells were treated with increasing amounts of either system 3 or 4 and incubated for 48 hours. Cell cytotoxicity was evaluated via MTT assay. System 3 = 17-AAG AuNP, System 4 = Cul5+17-AAG AuNP D. MTT assay comparing systems 3 and 4 in Cul5 KD AU565 cells. Cul5 KD cells were treated with increasing amounts of either system 3 or 4. Cell viability was assessed via MTT assay after 48 hours of incubation. * p = 0.0121, *** p = 0.0004 System 3=17-AAG AuNP, System 4=Cul5+17-AAG AuNP
To confirm that the Cul5 DNA being delivered to cells was being transcribed and translated into protein, both wild-type and Cul5 knockdown AU565 cells were treated with increasing amounts of control system 1 AuNPs or Cul5 DNA ligated system 2 AuNPs. Cell lysates were analyzed via immunoblot for HA tagged Cul5 protein. Cul5 protein was detected in cells treated with system 2 and not control system 1 (Figure 10).
To assess sensitivity to 17-AAG, WT and Cul5 KD cells were treated with system 3. The IC50 was determined following 48 hours of incubation with increasing amounts of 17-AAG-AuNPs (Figure 11 b). The IC50 for WT and Cul5 KD cells were 10 μg (0.05 μg/ μl) and 45 μg (0.225 μg/ μL) respectively. This data further supports our hypothesis that Cul5 is required for sensitivity to 17-AAG, as Cul5 knock down AU565 cells required 4.5× more drug that wild-type cells.
To assess whether delivering Cul5 with 17-AAG would increase drug sensitivity, system 4 was introduced to WT and Cul5 KD AU565 cells in increasing amounts and incubated for 48 hours. WT cells treated with system 4 never reached an IC50 for the amounts tested and was significantly outperformed by system 3 (p<0.01) (Figure 11 c). Cul5 KD cells displayed an IC50 of approximately 20 μg (0.1 μg/ μL) compared to the IC50 of ~45 μg (0.225 μg/ μL) observed after treatment with 17-AAG alone (Figure 11 d). This result illustrates the requirement for Cul5 in inducing cell death due to inhibition of HSP90 as system 4 significantly outperformed system 3 (p< 0.05, 10–40 μg).
To determine whether Cul5 expression would sensitize cells to free, unbound 17-AAG, we treated WT and Cul5 KD cells with increasing concentrations of free 17-AAG and 10 μg of system 2 (Figure 12 a–b). WT cells treated with free 17-AAG or those treated with free 17-AAG + 10 μg system 2 did not exhibit significant differences (Figure 12a). A significant difference (p < 0.05) was observed in Cul5 KD cells treated with free 17-AAG compared to cells treated with free 17-AAG + 10 μg system 2 (Figure 12b). These data suggest that delivery of Cul5 to Cul5 deficient breast cancer cell lines has the potential to sensitize resistant cells to 17-AAG.
Figure 12. Cul5 AuNPs sensitize resistant Cul5 KD cells to 17-AAG.
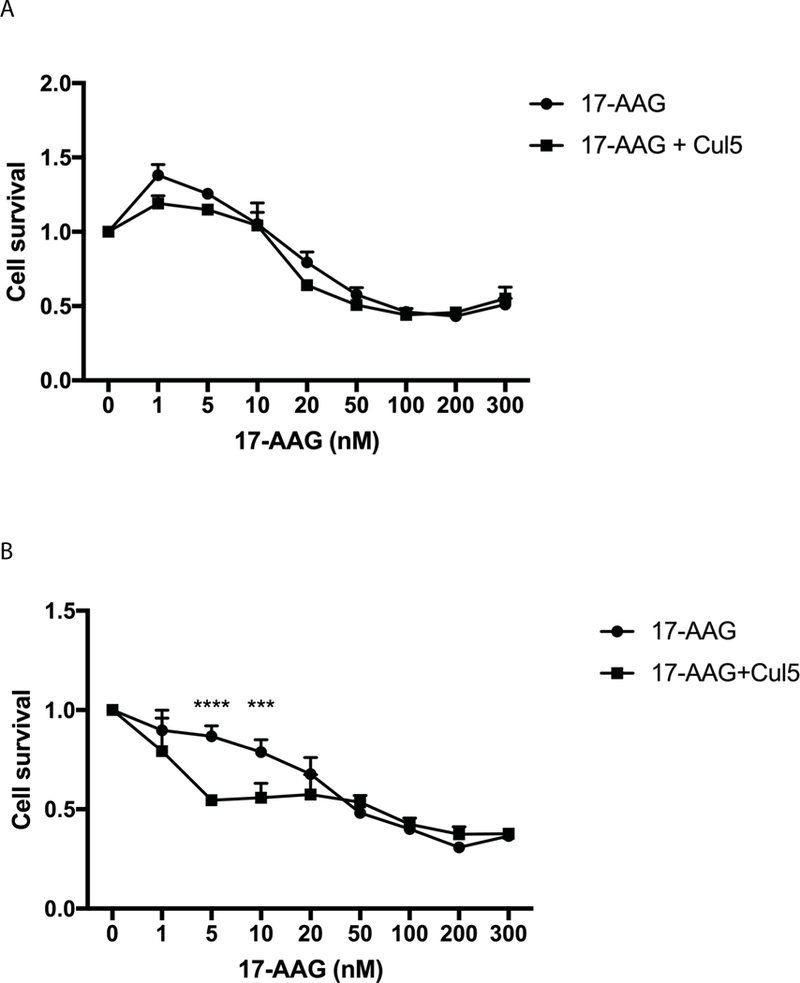
A. WT AU565 cells were treated with increasing amounts of free 17-AAG or increasing amounts of free 17-AAG plus 10 μg of system 2. After 48 hours incubation cell cytotoxicity was evaluated via MTT assay. * p = 0.0206 B. Cul5 KD cells were incubated with increasing concentration of free 17-AAG or free 17-AAG plus 10 μg system 2. After 48 hours cell viability was assessed via MTT assay. **** p < 0.0001, *** p = 0.007.
In order to determine whether the observed differences in sensitivity to 17-AAG are due to Cul5 rather than variation in AuNP uptake between WT and Cul5 KD AU565 cells, we assessed AuNP uptake via ICPMS. Uptake was similar across the different AU565 cell lines, however the uptake of AuNPs with drug or DNA payload was higher than AuNPs containing GSH alone (Table 4). This data suggests that the differences in sensitivity to 17-AAG are due to Cul5 rather than variation in AuNP uptake.
Table 4.
ICPMS quantification of gold uptake in WT AU565 and Cul5 KD AU565 cells. Both cells lines were plated in 6 well plates. Each well was treated with 1 mg of either system 1, 2, or 3. Following 8 hours of incubation, cells were washed and pelleted. Cell pellets were digested in aqua regia/ISS mixture and analyzed for gold content via ICPMS.
| System | Average AuNP Concentration: WT AU565 Cell |
Average AuNP Concentration: Cul5 KD AU565 Cell |
|---|---|---|
| System 1 | 0.195 aMokl | 0.147 aMol: 1 |
| System 2 | 7.36 aMol: 1 | 7.59 aMol: 1 |
| System 3 | 9.05 aMol: 1 | 9.1 aMol: 1 |
4. Discussion
Here we demonstrate that Cul5 DNA and 17-AAG can be delivered to cells via gold nanoparticles smaller than 2 nm diameter and when delivered together, increase the sensitivity of Cul5 deficient breast cancer cells to 17-AAG. We characterized AuNPs via UV-Vis, agarose gel assay, and 1H NMR to confirm attachment of 17-AAG and Cul5 DNA and size distribution via TEM. In addition to demonstrating co-migration of DNA with AuNPs, the agarose gel assays illustrate the importance of adjusting the pH of the solution to ~6.5/7.0 to facilitate attachment of DNA to the GSH ligand. The UV-vis spectra revealed blue shifts in the curves of systems 2, 3, and 4 indicating the presence of payload on the surface of the AuNPs. At higher concentrations of 17-AAG and DNA, we were able to observe individual peaks of the payloads. The UV-Vis spectra suggest that the size of our AuNPs are in the 1–2 nm range, as no plasmonic peak was observed. Indeed, the data obtained from TEM revealed systems 1, 2 and 3 had diameters less than 2 nm. AuNPs in this size range were reported to facilitate elimination through the renal system, avoiding Kupffer cells in the liver which could retain AuNPs and prevent elimination. 1H NMR “fingerprinting” indicated the presence of GSH and DNA on system 2 AuNPs and peaks indicative of 17-AAG present on system 3 AuNPs. Here we have shown GSH can be attached to a nucleotide-based molecule and demonstrate simultaneous attachment of a drug (17-AAG) and a biomolecule (Cul5 DNA) to the surface of a gold nanoparticle with a glutathione ligand.
Using both 293T and AU565 cells, we empirically determined the concentrations of Cul5 DNA and 17-AAG to utilize in the synthesis of the AuNPs. We identified the highest concentration of Cul5 DNA that resulted in minimal cytotoxicity and the lowest concentration of 17-AAG that resulted in cell death.
We conducted further studies using the HER2+ breast cancer cell line AU565. We observed cytotoxicity in WT cells treated with system 2. We hypothesize that this may be due to Cul5 overexpression resulting in a dominant negative effect. The Cul5 ubiquitin ligase is modular, with Cul5 being one component. We have previously observed that overexpression of one component within the complex will disrupt the stoichiometry resulting in inhibition of the ubiquitin ligase. Our results in the Cul5 deficient cells support this hypothesis, as cytotoxicity was not observed at concentrations below 60 μg. As expected, WT AU565 cells were sensitive to the 17-AAG AuNPs and exhibited higher rates of cell death compared to Cul5 KD cells. The higher rates of cell survival in response to treatment with system 3 in Cul5 KD cells was most likely due to reduced Cul5 expression, as we have observed Cul5 dependent 17-AAG resistance (Figure 1). Delivering Cul5 DNA and 17-AAG on the same nanoparticle to Cul5 deficient cells drastically increased sensitivity of these cells to the Hsp90 inhibitor. Cul5 deficient cells exhibited a 36% increase in sensitivity to 17-AAG upon addition of Cul5 DNA. Here we present a proof of principal study demonstrating the ability to sensitize resistant tumor cells to a chemotherapeutic drug through delivery of nanoparticles loaded with drug and DNA. We provide further evidence suggesting that the Cul5 E3 ubiquitin ligase is required for Hsp90 inhibitor induced cytotoxicity in tumor cells and that low Cul5 expression in patient derived tumors may account for the poor response to Hsp90 inhibitors observed in clinical trials. Cells deficient for Cul5 became sensitized when Hsp90 inhibitors were delivered with DNA encoding Cul5 on AuNPs. Future studies in animal models will determine whether this is a viable method for treating patients with drug resistance of a known genetic origin.
Supplementary Material
A. AuNPs were synthesized with increasing amounts of DNA. Increasing amounts of DNA-AuNPs were added to 293T cells. MTT assays were performed 24h following AuNP addition to assess cytotoxicity. B. AuNPs were synthesized with increasing amounts of 17-AAG. Increasing amounts of 17-AAG-AuNPs were added to 293T cells. MTT assays were performed 24 h following AuNP addition to assess cytotoxicity.
Table 3.
AuNP uptake quantified by ICPMS
| Sample | Average AuNP Concentration: Cell |
|---|---|
| System 1 | 0.86 fMol:l |
| System 2 | 0.086 fMol: 1 |
| System 3 | 0.073 fMol: 1 |
Acknowledegements
The authors would like to acknowledge Xiao-fang Yu for generously providing the Cullin 5 expression vector and Nadim Alkharouf for help analyzing TCGA obtained gene expression data.
Funding: This work was supported by the National Institutes of Health [grant number R25GM119970]; the National Science Foundation [grant number 1626326]; and Fisher Endowed Chair and Towson University Faculty Development and Research Committee funds.
References
- [1].Beliakoff J, Whitesell L, Hsp90: an emerging target for breast cancer therapy, Anti-cancer drugs, 15 (2004) 651–662. [DOI] [PubMed] [Google Scholar]
- [2].Lai BT, Chin NW, Stanek AE, Keh W, Lanks KW, Quantitation and intracellular localization of the 85K heat shock protein by using monoclonal and polyclonal antibodies, Mol Cell Biol, 4 (1984) 2802–2810. [DOI] [PMC free article] [PubMed] [Google Scholar]
- [3].Li J, Soroka J, Buchner J, The Hsp90 chaperone machinery: conformational dynamics and regulation by co-chaperones, Biochimica et biophysica acta, 1823 (2012) 624–635. [DOI] [PubMed] [Google Scholar]
- [4].Meyer P, Prodromou C, Liao C, Hu B, Roe SM, Vaughan CK, Vlasic I, Panaretou B, Piper PW, Pearl LH, Structural basis for recruitment of the ATPase activator Aha1 to the Hsp90 chaperone machinery, The EMBO journal, 23 (2004) 1402–1410. [DOI] [PMC free article] [PubMed] [Google Scholar]
- [5].Scheufler C, Brinker A, Bourenkov G, Pegoraro S, Moroder L, Bartunik H, Hartl FU, Moarefi I, Structure of TPR domain-peptide complexes: critical elements in the assembly of the Hsp70-Hsp90 multichaperone machine, Cell, 101 (2000) 199–210. [DOI] [PubMed] [Google Scholar]
- [6].Neckers L, Hsp90 inhibitors as novel cancer chemotherapeutic agents, Trends in molecular medicine, 8 (2002) S55–61. [DOI] [PubMed] [Google Scholar]
- [7].Ehrlich ES, Wang T, Luo K, Xiao Z, Niewiadomska AM, Martinez T, Xu W, Neckers L, Yu X-F, Regulation of Hsp90 client proteins by a Cullin5-RING E3 ubiquitin ligase, Proceedings of the National Academy of Sciences of the United States of America, 106 (2009) 20330–20335. [DOI] [PMC free article] [PubMed] [Google Scholar]
- [8].Whitesell L, Lindquist SL, HSP90 and the chaperoning of cancer, Nat Rev Cancer, 5 (2005) 761–772. [DOI] [PubMed] [Google Scholar]
- [9].Citri A, Kochupurakkal BS, Yarden Y, The Achilles Heel of ErbB-2/HER2: Regulation by the Hsp90 Chaperone Machine and Potential for Pharmacological Intervention, Cell Cycle, 3 (2004) 50–59. [PubMed] [Google Scholar]
- [10].Uehara Y, Natural product origins of Hsp90 inhibitors, Current cancer drug targets, 3 (2003) 325–330. [DOI] [PubMed] [Google Scholar]
- [11].Kim YS, Alarcon SV, Lee S, Lee MJ, Giaccone G, Neckers L, Trepel JB, Update on Hsp90 inhibitors in clinical trial, Current topics in medicinal chemistry, 9 (2009) 1479–1492. [DOI] [PMC free article] [PubMed] [Google Scholar]
- [12].Samant RS, Clarke PA, Workman P, E3 ubiquitin ligase Cullin-5 modulates multiple molecular and cellular responses to heat shock protein 90 inhibition in human cancer cells, Proc Natl Acad Sci U S A, 111 (2014) 6834–6839. [DOI] [PMC free article] [PubMed] [Google Scholar]
- [13].Fay MJ, Longo KA, Karathanasis GA, Shope DM, Mandernach CJ, Leong JR, Hicks A, Pherson K, Husain A, Analysis of CUL-5 expression in breast epithelial cells, breast cancer cell lines, normal tissues and tumor tissues, Molecular Cancer, 2 (2003) 40. [DOI] [PMC free article] [PubMed] [Google Scholar]
- [14].Carter SL, Negrini M, Baffa R, Gillum DR, Rosenberg AL, Schwartz GF, Croce CM, Loss of heterozygosity at 11q22-q23 in breast cancer, Cancer Res, 54 (1994) 6270–6274. [PubMed] [Google Scholar]
- [15].Zhang X, Gold Nanoparticles: Recent Advances in the Biomedical Applications, Cell Biochemistry and Biophysics, 72 (2015) 771–775. [DOI] [PubMed] [Google Scholar]
- [16].Kumar A, Ma H, Zhang X, Huang K, Jin S, Liu J, Wei T, Cao W, Zou G, Liang X-J, Gold nanoparticles functionalized with therapeutic and targeted peptides for cancer treatment, Biomaterials, 33 (2012) 1180–1189. [DOI] [PubMed] [Google Scholar]
- [17].Van Lehn RC, Alexander-Katz A, Ligand-Mediated Short-Range Attraction Drives Aggregation of Charged Monolayer-Protected Gold Nanoparticles, Langmuir, 29 (2013) 8788–8798. [DOI] [PubMed] [Google Scholar]
- [18].Smith AM, Marbella LE, Johnston KA, Hartmann MJ, Crawford SE, Kozycz LM, Seferos DS, Millstone JE, Quantitative Analysis of Thiolated Ligand Exchange on Gold Nanoparticles Monitored by 1H NMR Spectroscopy, Analytical Chemistry, 87 (2015) 2771–2778. [DOI] [PubMed] [Google Scholar]
- [19].Balendiran GK, Dabur R, Fraser D, The role of glutathione in cancer, Cell Biochemistry and Function, 22 (2004) 343–352. [DOI] [PubMed] [Google Scholar]
- [20].Estrela JM, Ortega A, Obrador E, Glutathione in Cancer Biology and Therapy, Critical Reviews in Clinical Laboratory Sciences, 43 (2006) 143–181. [DOI] [PubMed] [Google Scholar]
- [21].Hong R, Han G, Fernández JM, Kim B.-j., Forbes NS, Rotello VM, Glutathione-Mediated Delivery and Release Using Monolayer Protected Nanoparticle Carriers, Journal of the American Chemical Society, 128 (2006) 1078–1079. [DOI] [PubMed] [Google Scholar]
- [22].Catanzaro G, Curcio M, Cirillo G, Spizzirri UG, Besharat ZM, Abballe L, Vacca A, Iemma F, Picci N, Ferretti E, Albumin nanoparticles for glutathione-responsive release of cisplatin: New opportunities for medulloblastoma, International Journal of Pharmaceutics, 517 (2017) 168–174. [DOI] [PubMed] [Google Scholar]
- [23].Zhou C, Long M, Qin Y, Sun X, Zheng J, Luminescent Gold Nanoparticles with Efficient Renal Clearance, Angewandte Chemie (International ed. in English), 50 (2011) 3168–3172. [DOI] [PMC free article] [PubMed] [Google Scholar]
- [24].Fang J, Nakamura H, Maeda H, The EPR effect: Unique features of tumor blood vessels for drug delivery, factors involved, and limitations and augmentation of the effect, Advanced drug delivery reviews, 63 (2011) 136–151. [DOI] [PubMed] [Google Scholar]
- [25].Hostetler M, Wingate J, Zhong C, Harris J, Vachet R, Clark M, Londono J, Green S, Stokes J, Wignall G, Glish G, Porter M, Evans N, and Murray R Alkanethiolate Gold Cluster Molecules with Core Diameters from 1.5 to 5.2 nm: Core and Monolayer Properties as a Function of Core Size, Langmuir, 14 (1), (1998) 17–30. [Google Scholar]
Associated Data
This section collects any data citations, data availability statements, or supplementary materials included in this article.
Supplementary Materials
A. AuNPs were synthesized with increasing amounts of DNA. Increasing amounts of DNA-AuNPs were added to 293T cells. MTT assays were performed 24h following AuNP addition to assess cytotoxicity. B. AuNPs were synthesized with increasing amounts of 17-AAG. Increasing amounts of 17-AAG-AuNPs were added to 293T cells. MTT assays were performed 24 h following AuNP addition to assess cytotoxicity.


