

Abstract
Background
Elevated total cholesterol (TC), low‐density lipoprotein cholesterol (LDL‐C), triglycerides, and non‐high‐density lipoprotein cholesterol (non‐HDL‐C) and low high‐density lipoprotein cholesterol (HDL‐C) concentrations correlate with atherosclerotic cardiovascular disease (ASCVD) and mortality. Therefore, understanding how lipid trajectories throughout adulthood impact ASCVD and mortality risk is essential.
Methods and Results
We investigated 3875 Framingham Offspring participants (54% women, mean age 48 years) attending ≥1 examination between 1979 and 2014. We evaluated longitudinal correlates of each lipid subtype using mixed‐effects models. Next, we clustered individuals into trajectories through group‐based modeling. Thereafter, we assessed the prospective association of lipid trajectories with ASCVD and mortality. Male sex, greater body mass index, and smoking correlated with higher TC, LDL‐C, triglycerides, non‐HDL‐C, and lower HDL‐C concentrations. We identified 5 TC, HDL‐C, and LDL‐C trajectories, and 4 triglycerides and non‐HDL‐C trajectories. Upon follow‐up (median 8.2 years; 199 ASCVD events; 256 deaths), elevated TC (>240 mg/dL), LDL‐C (>155 mg/dL), or non‐HDL‐C (>180 mg/dL) concentrations conferred >2.25‐fold ASCVD and mortality risk compared with concentrations <165 mg/dL, <90 mg/dL, and <115 mg/dL, respectively ([TC hazard ratio (HR)ASCVD=4.17, 95% CI 1.94–8.99; TC HR death=2.47, 95% CI 1.28–4.76] [LDL‐C HRASCVD=5.09, 95% CI 1.54–16.85; LDL‐C HR death=4.04, 95% CI 1.84–8.89] [non‐HDL‐C HRASCVD=4.60, 95% CI 1.98–10.70; LDL‐C HR death=3.74, 95% CI 2.03–6.88]). Consistent HDL‐C concentrations <40 mg/dL were associated with greater ASCVD and mortality risk than concentrations >70 mg/dL (HRASCVD=3.81, 95% CI 2.04–7.15; HR death=2.88, 95% CI 1.70–4.89). Triglycerides trajectories were unassociated with outcomes.
Conclusions
Using a longitudinal modeling technique, we demonstrated that unfavorable lipid trajectories over 35 years confer higher ASCVD and mortality risk later in life.
Keywords: trajectories, lipids, longitudinal, life‐course, cardiovascular disease
Subject Categories: Lipids and Cholesterol, Cardiovascular Disease, Mortality/Survival, Risk Factors
Short abstract
See Editorial Gidding and Allen
Clinical Perspective
What Is New?
Long‐term exposure to elevated low‐density lipoprotein cholesterol and non‐high‐density lipoprotein cholesterol concentrations increase atherosclerotic cardiovascular disease risk that is partially attenuated by statins.
What are the Clinical Implications?
Incorporation of lipid trajectories may add incremental prognostic information for atherosclerotic cardiovascular disease risk prediction beyond single occasion measurements.
Maintenance of optimal levels of lipid concentrations over the life‐course may mitigate ASCVD (atherosclerotic cardiovascular disease) and mortality risk in the community.
Introduction
Atherosclerotic cardiovascular disease (ASCVD) has been a leading cause of death among Americans for >75 years and was the leading cause of total years of life lost globally in 2016.1, 2 Given the established risk of ASCVD and overall mortality associated with lipid levels,3, 4, 5, 6, 7, 8, 9, 10, 11 it is important to understand how variations in blood lipid levels throughout adulthood contribute to this risk by harnessing the power of serial measurements taken from the same individuals.
A few studies have examined the association between circulating lipid levels over time and the risk of ASCVD or all‐cause mortality12, 13, 14, 15 but these investigations either used mean or time‐averaged values of lipids during follow‐up,12, 13 or only examined the impact of a single lipid species.14, 15 In addition, investigators have identified long‐term patterns of blood pressure measurements (referred to as trajectories), and have then linked these patterns to the incidence of ASCVD events.16, 17, 18 In this context, there is limited information on the associations between trajectories of blood concentrations of total cholesterol, high‐density lipoprotein cholesterol (HDL‐C), low‐density lipoprotein cholesterol (LDL‐C), triglycerides, and non‐high‐density lipoprotein cholesterol (non‐HDL‐C), and the risk of ASCVD and mortality while simultaneously incorporating serial measurements and accounting for the uncertainty in trajectory assignment.
It is also essential to identify the factors influencing lipid levels during adulthood. Previous studies (cross‐sectional or using limited number of serial measurements) have shown that age, sex, body mass index (BMI), diabetes mellitus, use of lipid‐lowering medication, smoking status, alcohol consumption, as well as physical activity and dietary habits influence blood lipid levels.13, 19, 20, 21, 22, 23, 24, 25 However, to our knowledge, information identifying the longitudinal correlates of lipid measurements using serial measurements spanning 35 years is not yet available.
Much investigation into the association between lipid concentrations and ASCVD risk has been done using data from the Framingham Heart Study and these findings have been summarized by Wilson.26 However, to our knowledge, none of these previous endeavors defined trajectories of lipid concentrations or linked said trajectories to outcomes. To this end, we used data from participants of the Framingham Offspring cohort to characterize the longitudinal correlates of lipid levels over the adult life‐course, clustered individuals into trajectory groups based on their long‐term patterns of lipid concentrations, and finally used the results from the first 2 analyses to relate lipid trajectories to the incidence of ASCVD and death while simultaneously adjusting for appropriate confounders. We hypothesized that: (1) risk factors which have been shown to be related to lipids cross‐sectionally will also be related to lipid levels longitudinally; and (2) that trajectory groups representing higher levels of total cholesterol, LDL‐C, triglycerides, and non‐HDL‐C over the life course, as well as lower levels of HDL‐C, will be associated with an increased risk of ASCVD and all‐cause mortality.
Methods
The data that support the findings of this study are available from the corresponding author upon reasonable request.
Study Sample
Previous investigations have detailed the methods and design of the Framingham Offspring Study.27 All study participants provided written informed consent and the Boston University Medical Center Institutional Review Board approved all protocols for this longitudinal investigation.
We used several samples for this study, depending on the analyses performed; Figure S1 displays the timing of the data collection, while Figures S2 through S4 detail derivation of the various samples. Sample 1 was used for assessing the longitudinal correlates of blood lipids (Sample 1A for total cholesterol; Sample 1B for HDL‐C; Sample 1C for LDL‐C; Sample 1D for triglycerides; Sample 1E for non‐HDL‐C) and included participants of the Framingham Offspring cohort who attended at least 1 examination cycle from the second (1979–1983) to the ninth (2011–2014) cycle (Figure S2).
Sample 2 was used to create the trajectory groups for the lipids (Sample 2A for total cholesterol; Sample 2B for HDL‐C; Sample 2C for LDL‐C; Sample 2D for triglycerides; Sample 2E for non‐HDL‐C) with the objective of later relating the groups to outcome events. The sample included participants in the Framingham Offspring cohort who attended at least 1 examination cycle between the second and eighth (2005–2008) cycles, inclusive (Figure S3). Examination cycle 9 was not used for this analysis to ensure sufficient follow‐up time for the prospective analyses described below.
Sample 3 was used in survival analyses to link lipid trajectory groups (defined using sample 2) to incident ASCVD and all‐cause mortality (Sample 3A for total cholesterol; Sample 3B for HDL‐C; Sample 3C for LDL‐C; Sample 3D for triglycerides; Sample 3E for non‐HDL‐C). Sample 3 included the OFFSPRING cohort participants who attended the eighth examination cycle and were free of prevalent cardiovascular disease (including heart failure) and had no missing data on covariates at that time (Figure S4). Participants in this sample were followed until the end of 2014.
Lipid Values
We used the following blood lipid concentrations for our analyses: total cholesterol, HDL‐C, LDL‐C, triglycerides, and non‐HDL‐C. Blood was drawn from participants at each examination cycle following an overnight fast of at least 10 hours. Biosamples were stored at −20 (pre‐1990 exams) to −80°C (post‐1990 exams) until they were assayed. Total cholesterol, HDL‐C and triglycerides values were directly measured using standardized assays20 and LDL‐C values were calculated using the 3 other lipid values according to the Friedewald formula28:
Per the Freidewald formula, LDL‐C values were set to missing for all person‐examinations where triglyceride levels exceeded 400 mg/dL (n=352 person‐examinations). Non‐HDL‐C was calculated as follows:
Outcomes
For the prospective analysis, we evaluated incidence of fatal and non‐fatal atherosclerotic cardiovascular disease (coronary heart disease, stroke, or transient ischemic attack, and intermittent claudication) and death from all causes. For these analyses, participants were followed from examination cycle 8 (2005–2008) until December 31, 2014. Framingham Study participants are under continuous surveillance for the development of adverse events, including ASCVD and death. ASCVD events are adjudicated by an end point review panel consisting of 3 physicians who scrutinize all relevant medical and hospitalization records. Deaths are confirmed through death certificate records and the cause of death is determined on the basis of the death certificate and detailed review of medical records and all information provided by attending physicians, medical examiners, and/or family members.
Statistical Analysis
Sample characteristics
Descriptive statistics were calculated using Samples 1A and 3A (the largest samples). Summary statistics for Sample 1A were generated using characteristics measured at the first examination attended by each participant. Summary statistics for Sample 3A were generated using data at examination cycle 8.
Longitudinal analysis of correlates of blood lipid concentrations
In the analyses assessing the longitudinal correlates of lipid concentrations, we recalculated lipid levels in participants at examinations at which they reported use of lipid‐lowering medications.29 Use of lipid‐lowering medication was self‐reported at examination cycles 2 to 7 and verified by study staff upon review of provided medication bag at examination cycles 8 and 9. We adjusted measurements of total cholesterol, LDL‐C, and non‐HDL‐C taken from individuals who were on lipid‐lowering medications to reflect the impact of these medications. More specifically, for total cholesterol levels measured since the beginning of 1994, when lipid‐lowering medication use became more widespread, levels were divided by 0.8 among those receiving lipid‐lowering medication (ie, Totaladjusted = Totalmeasured ÷ 0.8).29 Additionally, the adjusted values for LDL‐C were calculated according to the Friedewald equation28 using Totaladjusted in place of Totalmeasured (ie, LDL‐Cadjusted=Totaladjusted–HDL‐C–(Triglycerides ÷ 5)). Similarly, adjusted non‐HDL‐C values were calculated as non‐HDL‐Cadjusted= Totaladjusted–HDL‐C. For total cholesterol, LDL‐C, and non‐HDL‐C levels measured before 1994, values remained as measured. We did not use any such correction for HDL‐C or triglyceride values.29
To assess the longitudinal correlates of lipid concentrations we used multilevel statistical modeling, allowing us to analyze data at 2 levels—within the same individuals over time and across different individuals. A strength of these models is that they accommodate estimation of the impact of covariates on temporal patterns at a study sample level in addition to the overall pattern of change over time at the individual level. Models included a random intercept and random slope for age to account for a different starting value of the lipids for each participant as well as for a different slope for age. Maximum likelihood estimation was used as the maximization criterion with an unstructured covariance matrix. In these models the lipids (total cholesterol, HDL‐C, LDL‐C, triglycerides, and non‐HDL‐C) were used as dependent variables, with separate models for each trait. Triglyceride values were natural logarithmically‐transformed to normalize their distribution. Age, sex, BMI, smoking status, moderate‐to‐heavy drinking (defined as >7 drinks per week for women and >14 drinks per week for men), total caloric intake, physical activity index, diabetes mellitus status, systolic blood pressure (SBP), use of antihypertensive medications, and use of lipid‐lowering medications were candidate independent variables. We also tested for effect modification by age and sex by including 2‐way interaction terms between the aforementioned candidate variables and age and sex separately. We additionally tested for an interaction between smoking and moderate‐to‐heavy alcohol consumption since these substances are often used together and the simultaneous use of these substances could impact lipid concentrations more than the sum of their individual effects. Backward selection was used to choose statistically significant main effects from those listed above. Statistically significant interaction terms were also plotted to visually assess the degree of effect modification. As a sensitivity analysis, models assessing correlates of lipids were also stratified by sex attributable to the rapid increase in lipid levels among women during menopause.30
Characterization of trajectories of lipid concentrations
After identifying the longitudinal correlates of the lipids under study, we next categorized participants into longitudinal trajectory groups separately for each lipid. To identify the subgroups of individuals whose underlying lipid trajectories were similar, group‐based modeling was implemented using SAS Proc Traj31 in Samples 2A to 2E. This technique allows users to specify the number of distinct patterns that exist within the dependent variable (lipids) and models the dependent variable as a function of time (age), with up to fifth order polynomials on the time variable, and time‐varying covariates (use of lipid‐lowering medication). Inclusion of lipid‐lowering medication as a time‐varying covariate allowed us to model the impact of beginning a statin regimen. The algorithm then assigns each person a probability of membership in each of the groups. The model allows for the inclusion of individuals with measurements at a single time‐point (which can induce uncertainty surrounding group membership for that individual, but provides additional data to help estimate the coefficients defining the trajectories), as well as individuals with multiple measurements (either sequentially, or with gaps between assessments). As recommended by Jones et al31, to identify the “best” model, we fit several models ranging from single group models to 5‐group models with polynomials of varying degrees in each group and then compared model fit on the basis of Bayesian Information Criteria (BIC). We also ensured that each trajectory group contained a sufficient sample size to adequately define the beta coefficients associated with the polynomial terms on age. To further assess that our chosen models were a good fit to the data, we ensured that each model satisfied all 4 model fit diagnostic criteria laid out by Nagin.32 Assuming that participants were assigned to the trajectory group for which their posterior probability of membership was highest, the model fit criteria are: (1) average posterior probability of group membership among individuals assigned to that group AvePPj ≥0.7 for all groups (j=1,…,J, J is number of trajectory groups); (2) the odds of correct classification OCCj >5 for all groups; (3) reasonably close agreement between probability of membership in group j (πj) and proportion of the sample assigned to group j (Pj); and (4) narrow CI about πj for all j.
Using this algorithm, we identified 5 distinct trajectories for total cholesterol, LDL‐C, and HDL‐C, and 4 distinct trajectories for triglycerides and non‐HDL‐C.
To assess the impact of lipid‐lowering medication on the overall shape of the trajectories, we performed a supplemental analysis excluding all person‐exams where individuals reported use of lipid‐lowering medication.
Trajectories of lipid concentrations and incident ASCVD and all‐cause mortality
Finally, we evaluated the association between the trajectory groups (modeled as a categorical variable) and incidence of ASCVD and all‐cause mortality on follow‐up after examination cycle 8, adjusting for variables identified to be associated with each lipid trait in the aforementioned analyses. We accounted for the uncertainty surrounding lipid trajectory group membership by treating group assignment as unknown and generated 50 multiple imputations of trajectory group assignment within Samples 3A to 3E.18 In every imputed dataset, each person's group membership was drawn from a multinomial distribution whose probability parameters consisted of that person's unique posterior probabilities of membership in each of the groups. After asserting that the proportional hazards assumption was met by assessing interactions between trajectory group and time (P>0.05 for all), we fit a Cox proportional hazards regression model for each of the 50 datasets to examine the association of lipid trajectory groups (independent variable) with incident ASCVD and all‐cause mortality (separate models for each outcome) and then combined our results across the multiple imputations. Baseline hazards were allowed to differ between men and women since ASCVD risk during middle age differs by sex33 and models were adjusted for use of lipid‐lowering medications, smoking status, diabetes mellitus, BMI, and SBP as well as other variables found to be significantly associated with each lipid in the analysis assessing the correlates of the lipids under study. Specifically, models with total cholesterol trajectory group as the exposure of interest were additionally adjusted for moderate‐to‐heavy alcohol consumption and use of antihypertensive medication; models with HDL‐C trajectory groups as the exposure of interest were adjusted for moderate‐to‐heavy alcohol consumption and physical activity index; models with LDL‐C trajectory groups as the exposure of interest were also adjusted for moderate‐to‐heavy alcohol consumption, total caloric intake, and use of antihypertensive medication; models with triglyceride trajectory groups as the exposure of interest were adjusted for total caloric intake, physical activity index, and use of antihypertensive medication; and Cox proportional hazards regression models with non‐HDL‐C as the independent variable of interest were additionally adjusted for total caloric intake and physical activity index. We additionally tested for a statistical interaction between trajectory group and use of lipid‐lowering medications in all models.
Predictive ability of lipid trajectory groups compared with other methods of lipid adjustment
We used the c‐statistic to determine the utility of lipid trajectory groups as our exposure of interest compared with a simple adjustment for lipids at exam 8 or adjustment for the average lipid level over examination cycles 2 to 8. We first fit a base model without adjustment for lipids and then assessed the change in c‐statistic when adding the lipid to this base model. Each lipid was added to the model in 3 separate ways (categorical trajectory group, measured lipid level at examination 8, average lipid level from exams 2–8) for each lipid and both outcomes (ASCVD and all‐cause mortality).
Sensitivity analyses
As a sensitivity analysis, we used a common set of covariates in all Cox regression models (lipid‐lowering medication use, smoking status, diabetes mellitus, BMI, total caloric intake, moderate‐to‐heavy alcohol consumption, physical activity, SBP, and use of antihypertensive medications) so that results across lipid subtypes were more comparable.
To assess the robustness of our results to modeling technique, instead of accounting for the uncertainty of group membership with a multiple imputation technique, we fit weighted Cox regression models and created weighted Kaplan–Meier curves. Here, each person was represented in the data set J times, where J is the number of trajectory groups for each lipid (J=5 for total cholesterol, LDL‐C, and HDL‐C; J=4 for triglycerides and non‐HDL‐C). For each of the J records in the data set, all participants were assigned to trajectory group j (j=1, …, J) with a weight equal to his or her posterior probability of membership in the j th trajectory group, P(j|Yi). Models were adjusted for the same covariates that were used in the multiple imputation approach, baseline hazards were allowed to differ between men and women, and a robust sandwich estimator was used to account for intra‐person correlation.
Finally, we repeated survival analyses using incident heart failure as our dependent variable to determine whether lipid trajectories influence heart failure risk since its causal pathways are more diverse than those of atherosclerotic end points.34
Statistical significance was assessed using a 2‐sided P<0.05. All analyses were performed using SAS software version 9.4. (Cary, NC). The authors had full access to the data and take responsibility for its integrity. All authors have read and agree to the manuscript as written.
Results
Sample Characteristics
The baseline characteristics of Samples 1A and 3A are shown in Table 1. Race/ethnicity is not included in the summary statistics as the Offspring cohort is predominantly composed of white individuals of European descent. Participants in sample 1A were middle aged, with a moderate prevalence of smokers. Participants in sample 3A were older, with a BMI in the overweight range, and a high proportion of hypertension (Table 1).
Table 1.
Sample Characteristicsa
| Characteristics | Correlates Sampleb (n=3875) | Prospective Samplec (n=2375) |
|---|---|---|
| Age, y | 48±10 | 65±9 |
| Men, % | 46 | 42 |
| Body mass index, kg/m2 | 26.3±4.8 | 28.1±5.4 |
| Systolic blood pressure, mm Hg | 123±17.4 | 128±16.9 |
| Diastolic blood pressure, mm Hg | 78±9.8 | 74±9.8 |
| Hypertension, % | 27.2 | 54.1 |
| Antihypertensive medication, % | 12.8 | 43.3 |
| Diabetes mellitus, % | 3.7 | 10.9 |
| Current smoking, % | 28.9 | 8.7 |
| Moderate to heavy drinker, %d | 20.3 | 14.5 |
| Total caloric intake, kcal/day | 1857±636 | 1883±634 |
| Physical activity index | 35.5±6.3 | 35.5±5.4 |
| Blood lipid concentrations | ||
| Total cholesterol, mg/dL | 205±39 | 191±36 |
| HDL cholesterol, mg/dL | 51±15 | 59±18 |
| LDL cholesterol, mg/dL | 132±36 | 109±30 |
| Triglycerides, mg/dL | 115±86 | 116±67 |
| Non‐HDL cholesterol, mg/dL | 155±41 | 132±34 |
| Lipid lowering medication use, % | 2.5 | 36.1 |
HDL indicates high‐density lipoprotein; LDL, low‐density lipoprotein.
Numbers represent mean±SD for continuous variables and percentage corresponding to “yes” for dichotomous variables
Characteristics for correlates sample (sample 1A) were measured at each participant's first attended examination between exams 2 and 9 (for 88% of sample, this was exams 2, 3, or 4).
Characteristics for the prospective sample (sample 3A) were measured at the same examination (exam cycle 8 [2005–2008]) for all participants.
Defined as >7 drinks per week for women and >14 drinks per week for men.
Longitudinal Analysis of Correlates of Blood Lipid Concentrations
Using linear mixed effects models, age and SBP were positively associated with all lipids. For total cholesterol, LDL‐C, triglycerides, and non‐HDL‐C the association with age was modified by: sex (total cholesterol, LDL‐C, and non‐HDL‐C), BMI (total cholesterol), total caloric intake (LDL‐C and non‐HDL‐C), and diabetes mellitus status (total cholesterol, triglycerides, and non‐HDL‐C). Interpretations of the age effect must incorporate these interactions (Table 2). For example, we can estimate that a 60 year‐old man would have an LDL‐C concentration that is 0.35 mg/dL higher than that of a 55 year‐old woman, who otherwise have the same values for the other covariates, including a total caloric intake of 2500 kcal per day and no use of antihypertensive medication as seen in the calculation below (only including terms that differ between the 2 individuals as the others would cancel out).
Table 2.
Longitudinal Correlates of Lipid Concentrations
| Correlatea | Total Cholesterolb | HDL Cholesterol | LDL Cholesterolb | Log Triglycerides | Non‐HDL Cholesterolb | |||||
|---|---|---|---|---|---|---|---|---|---|---|
| β Estimate | P Value | β Estimate | P Value | β Estimate | P Value | β Estimate | P Value | β Estimate | P Value | |
| Age, 5 y | 10.26 | <0.0001 | 1.56 | <0.0001 | 0.54 | 0.12 | 0.04 | <0.0001 | 1.08 | 0.005 |
| Male, sex | 41.37 | <0.0001 | −11.81 | <0.0001 | 40.57 | <0.0001 | 0.10 | <0.0001 | 54.27 | <0.0001 |
| Body mass index, kg/m2 | 3.34 | <0.0001 | −1.02 | <0.0001 | 0.84 | <0.0001 | 0.04 | <0.0001 | 1.92 | <0.0001 |
| Smoking | 3.64 | <0.0001 | −3.10 | <0.0001 | 6.05 | <0.0001 | 0.07 | <0.0001 | 6.57 | <0.0001 |
| Moderate‐to‐heavy drinking | 4.55 | <0.0001 | 3.55 | <0.0001 | 0.86 | 0.20 | ··· | ··· | ··· | ··· |
| Total caloric intake, 100 kcal | ··· | ··· | ··· | ··· | −0.57 | 0.003 | 0.002 | 0.002 | −0.69 | 0.001 |
| Physical activity index, 1 point | ··· | ··· | 0.04 | 0.0007 | ··· | ··· | −0.003 | <0.0001 | −0.10 | 0.009 |
| Diabetes mellitus | 23.22 | 0.0015 | −1.78 | <0.0001 | −6.39 | <0.0001 | 0.93 | <0.0001 | 45.29 | <0.0001 |
| Systolic blood pressure, mm Hg | 0.16 | <0.0001 | 0.05 | <0.0001 | 0.08 | <0.0001 | 0.002 | <0.0001 | 0.12 | <0.0001 |
| Antihypertensive medication use | 37.28 | <0.0001 | ··· | ··· | 33.25 | <0.0001 | 0.02 | 0.049 | ··· | ··· |
| Lipid‐lowering medication use | ··· | ··· | 2.38 | <0.0001 | ··· | ··· | −0.11 | <0.0001 | −5.70 | <0.0001 |
| Interactions | ||||||||||
| Age×male sex | −4.55 | <0.0001 | ··· | ··· | −3.48 | <0.0001 | ··· | ··· | −4.53 | <0.0001 |
| Age×body mass index | −0.23 | <0.0001 | ··· | ··· | ··· | ··· | ··· | ··· | ··· | ··· |
| Age×total caloric intake | ··· | ··· | ··· | ··· | 0.04 | 0.009 | ··· | ··· | 0.06 | 0.003 |
| Age×diabetes mellitus status | −2.18 | 0.0002 | ··· | ··· | ··· | ··· | −0.06 | <0.0001 | −3.95 | <0.0001 |
| Smoking×moderate‐to‐heavy drinking | ··· | ··· | ··· | ··· | −3.28 | 0.01 | ··· | ··· | ··· | ··· |
| Male sex×diabetes mellitus status | ··· | ··· | ··· | ··· | ··· | ··· | −0.10 | 0.002 | ··· | ··· |
| Male sex × lipid lowering medication use | ··· | ··· | ··· | ··· | ··· | ··· | −0.14 | <0.0001 | ··· | ··· |
| Age × antihypertensive medication use | −3.08 | <0.0001 | ··· | ··· | −2.77 | <0.0001 | ··· | ··· | ··· | ··· |
Final covariates chosen on the basis of backward selection. All covariates were updated at each Framingham examination, allowing for values to change over time.
Values of total cholesterol, LDL cholesterol, and non‐HDL cholesterol were adjusted to account for lipid‐lowering medication use.
If, however, the woman was 65 years old and the man was 70 years old, we would estimate that the woman's LDL‐C would exceed the man's LDL‐C by 6.61 mg/dL—a change in both direction and magnitude from the previous example as shown in the calculation below.
In these models, male sex, higher BMI and current smoking were associated with higher levels of total cholesterol, LDL‐C, triglycerides, and non‐HDL‐C, and with lower levels of HDL‐C (Table 2), adjusting for all other variables. However, the increase in total cholesterol per unit increase in BMI was less among older adults compared with those who were younger, and the increase in LDL cholesterol among smokers was slightly attenuated among those who also had moderate alcohol consumption (indicating effect modification as reflected by the statistically significant interaction term in Table 2). Individuals with a higher physical activity index had higher concentrations of blood HDL‐C and lower levels of circulating triglycerides and non‐HDL‐C, after adjusting for other variables in the model.
When stratifying by sex, main effects are largely similar between men and women for most lipid subtypes (with slightly different magnitudes of association), but interactions differ somewhat (Tables S1 and S2). Of note, menopause status greatly impacts all lipid concentrations among women (Table S1).
Characterization of Trajectories of Lipid Concentrations
Using Samples 2A to 2E, we created trajectories for blood concentrations of total cholesterol, HDL‐C, LDL‐C, triglycerides, and non‐HDL‐C. Descriptions of each of the trajectory groups are given in Table 3. As expected because of our inclusion of lipid‐lowering medication as a time‐varying covariate in the trajectory models, the proportion of participants taking lipid‐lowering medications directly increased with trajectory groups corresponding to increasing levels of total cholesterol, LDL‐C, triglycerides, and non‐HDL‐C, and decreasing levels of HDL‐C (Table 3).
Table 3.
Lipid Trajectory Groups
| Lipid | Groupa | n (%) | Description and Mean Rangeb | Percent on Statins at Exam 8 |
|---|---|---|---|---|
| Total cholesterol | 1 | 547 (23.0) | Optimal (155–165 mg/dL) | 10.1 |
| 2 | 1050 (44.2) | Borderline (190–200 mg/dL) | 31.3 | |
| 3 | 586 (24.7) | Elevated (220–235 mg/dL) | 56.3 | |
| 4 | 120 (5.1) | Elevated and decreasing (drops from 260 to 190 mg/dL over time) | 75.0 | |
| 5 | 72 (3.0) | Very elevated and decreasing (drops from 285 to 240 mg/dL over time) | 73.6 | |
| HDL cholesterol | 1 | 463 (19.7) | Very low and stable (35–40 mg/dL) | 51.4 |
| 2 | 783 (33.3) | Low and stable (45–50 mg/dL) | 41.1 | |
| 3 | 687 (29.2) | Borderline (55–60 mg/dL) | 33.0 | |
| 4 | 325 (13.8) | High and slightly increasing (increases from 70 to 75 mg/dL over time) | 17.9 | |
| 5 | 95 (4.0) | Very high and increasing (increases from 80 to 100 mg/dL over time) | 7.4 | |
| LDL cholesterol | 1 | 323 (14.7) | Optimal (80–90 mg/dL) | 6.8 |
| 2 | 825 (37.6) | Borderline (115–120 mg/dL) | 23.6 | |
| 3 | 710 (32.4) | Slightly elevated and decreasing (drops from 145 to 125 mg/dL over time) | 45.9 | |
| 4 | 290 (13.2) | Elevated and decreasing (drops from 170 to 135 mg/dL over time) | 72.8 | |
| 5 | 44 (2.0) | Very elevated and decreasing (drops from 220 to 155 mg/dL over time) | 90.9 | |
| Triglyceridesc | 1 | 571 (25.9) | Optimal (55–70 mg/dL) | 16.8 |
| 2 | 997 (45.2) | Borderline (81–99 mg/dL) | 34.6 | |
| 3 | 541 (24.5) | Elevated (134–164 mg/dL) | 55.3 | |
| 4 | 96 (4.4) | Very elevated (245–314 mg/dL) | 67.7 | |
| Non‐HDL cholesterol | 1 | 534 (24.2) | Optimal (100–115 mg/dL) | 6.2 |
| 2 | 1043 (47.3) | Borderline (145–137 mg/dL) | 31.7 | |
| 3 | 537 (24.3) | Elevated and decreasing (drops from 185 to 157 mg/dL over time) | 66.5 | |
| 4 | 93 (4.2) | Very elevated and decreasing (drops from 235 to 180 mg/dL over time) | 90.3 |
HDL, high‐density lipoprotein; LDL, low‐density lipoprotein.
Trajectories were defined on the basis of the association between each lipid and age. Provided ranges correspond to means. Variability (CIs) surrounding estimated means is displayed in Figure.
Because trajectories are defined in terms of mean lipid levels, minimum and maximum lipid values in each group may not be equal to the extreme values in adjacent trajectory groups.
Triglycerides were analyzed on the log‐scale, but trajectory categories are described in terms of mg/dL.
The Figure displays expected group percentages and plots of the trajectories for each of the lipids. Panel A displays the total cholesterol trajectories, while panel C displays the LDL‐C trajectories, and Panel E shows non‐HDL‐C trajectories. We observe that, for these lipids, groups 1 and 2 contain individuals with relatively stable lipid concentrations that range from optimal (total cholesterol:155–165 mg/dL; LDL‐C:80–90 mg/dL; non‐HDL‐C:100–115 mg/dL) to borderline (total cholesterol: 190–200 mg/dL; LDL‐C: 115–120 mg/dL; non‐HDL‐C: 145–137 mg/dL) values. In total cholesterol group 3, cholesterol levels are elevated (220–235 mg/dL) and stable while in the third LDL‐C trajectory group, lipid levels are elevated (145 mg/dL) but decrease to borderline levels (125 mg/dL) after age 60. Similar to LDL‐C group 3, non‐HDL‐C group 3 contains individuals whose concentrations are initially elevated (185 mg/dL) but decrease over time (157 mg/dL). For both total cholesterol and LDL‐C, groups 4 and 5, as well as non‐HDL‐C group 4 are composed of individuals with elevated lipid levels that decrease with increasing age as these individuals initiate a lipid‐lowering medication regimen. HDL‐C trajectories are displayed in panel B showing that groups 1, 2, and 3 contain individuals whose HDL‐C levels appear to be stable and consistently below 60 mg/dL over time whereas those individuals in HDL‐C trajectory groups 4 or 5 have healthy HDL‐C levels that are increasing with age. Triglyceride trajectories appear in panel D where we observe that all trajectories are stable over time.
Figure 1.
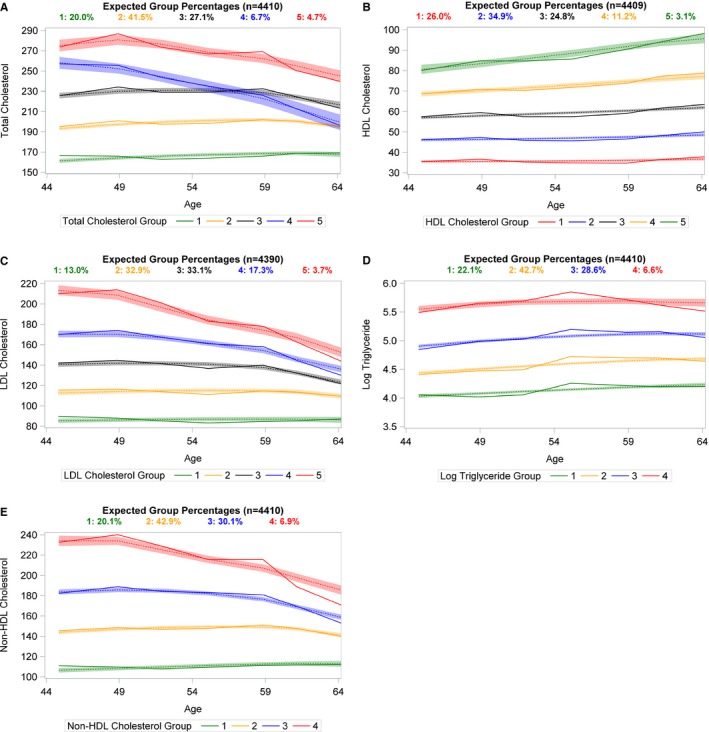
Plots of lipid trajectories using group‐based modeling with solid lines displaying the observed values while dotted lines and surrounding bands represent fitted trajectories and their corresponding 95% CI. Lipids were modeled as a function of age with lipid‐lowering medication usage included as a time‐varying covariate. Panel A displays trajectories of total cholesterol. Panel B displays trajectories of HDL‐C. Panel C includes LDL‐C trajectories. Panel D displays trajectories of triglycerides. Panel E displays trajectories of non‐HDL cholesterol.
Examination of Table S3 indicates that all trajectories models sufficiently satisfy the trajectory model fit diagnostics laid out by Nagin,32 and thus these models are a good fit to the data.
Figure S5 displays trajectories from person‐exams among those who did not report using lipid‐lowering agents. Here, all trajectories are relatively stable over time indicating that the decreasing trends around age 50 years in panels A, C, and E of the Figure are attributable to the commencement of a statin regimen.
Trajectories of Lipid Concentrations and Incident Cardiovascular Disease and All‐Cause Mortality
During the follow‐up period (median=8.2 years), there were 199 incident ASCVD events and 256 deaths. The proportion of incident ASCVD events and deaths was higher among individuals with lower levels of HDL‐C and higher levels of total cholesterol, LDL‐C, triglycerides, and non‐HDL‐C (Table 4). There was no statistically significant interaction between trajectory group and use of lipid‐lowering medications in relation to either outcome, indicating that, while lipid‐lowering medication use did influence risk, its presence did not alter the association between lipid trajectory groups and risk of ASCVD or all‐cause mortality.
Table 4.
Adverse Outcomes by Lipid Trajectory Groups Using Multiple Imputation Approach
| Lipid | Group | Incident ASCVD | All‐Cause Mortality | ||||
|---|---|---|---|---|---|---|---|
|
|
Hazard Ratio [95% CI]a | P Value |
|
Hazard Ratio [95% CI]a | P Value | ||
| Total Cholesterol | Optimal (155–165 mg/dL) | 23/547 (4.20) | 1.00 | — | 57/547 (10.42) | 1.00 | — |
| Borderline (190–200 mg/dL) | 106/1050 (10.01) | 2.24 [1.32–3.80] | 0.003 | 99/1050 (9.43) | 0.95 [0.67–1.35] | 0.8 | |
| Elevated (220–235 mg/dL) | 44/586 (7.51) | 1.69 [0.95–3.02] | 0.08 | 64/586 (10.92) | 1.20 [0.81–1.78] | 0.4 | |
| Elevated and decreasing (drops from 260 to 190 mg/dL over time) | 11/120 (9.17) | 1.97 [0.86–4.52] | 0.11 | 20/120 (16.67) | 1.64 [0.93–2.91] | 0.09 | |
| Very elevated and decreasing (drops from 285 to 240 mg/dL over time) | 15/72 (20.83) | 4.17 [1.94–8.99] | 0.0003 | 16/72 (22.22) | 2.47 [1.28–4.76] | 0.007 | |
| HDL Cholesterolb | Very low and stable (35–40 mg/dL) | 69/463 (14.90) | 3.81 [2.04–7.15] | <0.0001 | 76/463 (16.41) | 2.88 [1.70–4.89] | <0.0001 |
| Low and stable (45–50 mg/dL) | 76/783 (9.71) | 2.50 [1.41–4.45] | 0.002 | 90/783 (11.49) | 2.01 [1.25–3.24] | 0.004 | |
| Borderline (55–60 mg/dL) | 34/687 (4.95) | 1.24 [0.67, 2.29] | 0.5 | 58/687 (8.44) | 1.44 [0.89–2.34] | 0.1 | |
| High and increasing (increases from 70/80 to 75/100 mg/dL over time) | 16/420 (3.81) | 1.00 | — | 26/420 (6.19) | 1.00 | — | |
| LDL Cholesterol | Optimal (80–90 mg/dL) | 6/323 (1.86) | 1.00 | — | 25/323 (7.74) | 1.00 | — |
| Borderline (115–120 mg/dL) | 60/825 (7.27) | 2.97 [1.24–7.10] | 0.01 | 68/825 (8.24) | 1.12 [0.67–1.87] | 0.7 | |
| Slightly elevated and decreasing (drops from 145 to 125 mg/dL over time) | 75/710 (10.56) | 4.14 [1.74–9.83] | 0.001 | 76/710 (10.70) | 1.45 [0.88–2.40] | 0.1 | |
| Elevated and decreasing (drops from 170 to 135 mg/dL over time) | 26/290 (8.97) | 3.01 [1.15–7.85] | 0.02 | 45/290 (15.52) | 2.29 [1.30–4.05] | 0.004 | |
| Very elevated and decreasing (drops from 220 to 155 mg/dL over time) | 6/44 (13.64) | 5.09 [1.54–16.85] | 0.008 | 11/44 (25.00) | 4.04 [1.84–8.89] | 0.0005 | |
| Log Triglycerides | Optimal (55–70 mg/dL) | 26/571 (4.55) | 1.00 | — | 55/571 (9.63) | 1.00 | — |
| Borderline (81–99 mg/dL) | 71/997 (7.12) | 1.35 [0.84–2.16] | 0.2 | 97/997 (9.73) | 0.98 [0.69–1.40] | 0.9 | |
| Elevated (134–164 mg/dL) | 63/541 (11.65) | 1.86 [1.13–3.05] | 0.01 | 62/541 (11.46) | 1.03 [0.69–1.54] | 0.9 | |
| Very Elevated (245–314 mg/dL) | 11/96 (11.46) | 1.80 [0.81–3.96] | 0.1 | 9/96 (9.38) | 0.77 [0.35–1.66] | 0.5 | |
| Non‐HDL Cholesterol | Optimal (100–115 mg/dL) | 13/534 (2.43) | 1.00 | — | 38/534 (7.12) | 1.00 | — |
| Borderline (145–137 mg/dL) | 92/1043 (8.82) | 3.38 [1.79–6.39] | 0.0002 | 104/1043 (9.97) | 1.38 [0.93–2.04] | 0.1 | |
| Elevated and decreasing (drops from 185 to 157 mg/dL over time) | 52/537 (9.68) | 3.20 [1.60–6.39] | 0.001 | 59/537 (10.99) | 1.59 [1.01–2.51] | 0.047 | |
| Very elevated and decreasing (drops from 235 to 180 mg/dL over time) | 14/93 (15.05) | 4.60 [1.98–10.70] | 0.0004 | 22/93 (23.66) | 3.74 [2.03–6.88] | <0.0001 | |
ASCVD indicates atherosclerotic cardiovascular disease; HDL, high‐density lipoprotein; LDL, low‐density lipoprotein.
All models were adjusted for statin use, smoking status, diabetes mellitus status, body mass index, and systolic blood pressure. Alcohol consumption was also adjusted for in total cholesterol, HDL‐C and LDL‐C models. Total caloric intake was adjusted for in LDL‐C and triglyceride models. Physical activity index was adjusted for in HDL‐C, triglyceride, and non‐HDL‐C models. Use of antihypertensive medications were adjusted for in total cholesterol, LDL‐C and triglyceride models. Baseline hazards were allowed to differ for men and women in all models.
HDL trajectory groups 4 and 5 were combined for analyses to increase statistical power since there were only 2 incident ASCVD events and 5 deaths in group 5.
Blood Total Cholesterol Concentrations and Risk of Outcomes
Compared with the optimal total cholesterol trajectory group (group 1), those in the borderline group (group 2) and very elevated and decreasing group (group 5) were at an increased risk of ASCVD, with the highest risk in group 5 after adjusting for lipid‐lowering medication use, smoking status, diabetes mellitus, body mass index, SBP, alcohol consumption, and use of antihypertensive medication (Table 4). In contrast, only individuals with very elevated and decreasing total cholesterol values (trajectory group 5) were at an increased risk of death compared with those in the optimal group with nearly a 2.5‐fold risk of death.
Blood HDL Cholesterol Concentrations and Risk of Outcomes
HDL‐C trajectory groups 4 and 5 (people with consistently high and increasing HDL‐C levels) were combined since there were only 2 ASCVD events and 5 deaths in group 5. Compared with the combined group 4 and 5, those in groups 1 (very low and stable) and 2 (low and stable) were at an increased risk of incident ASCVD and death after adjusting for lipid lowering medication use, smoking status, diabetes mellitus, BMI, alcohol consumption, SBP, and physical activity index (Table 4). We did not observe a statistically significant difference in risk of ASCVD or mortality between people with borderline HDL‐C levels (group 3) and those in the referent group (ASCVD P=0.5, all‐cause mortality P=0.1).
Blood LDL Cholesterol Concentrations and Risk of Outcomes
Compared with those with optimal LDL‐C levels (group 1), participants in groups 2 (borderline), 3 (slightly elevated and decreasing), 4 (elevated and decreasing), and 5 (very elevated and decreasing) were at a statistically significant increased risk of incident ASCVD, after adjusting for lipid lowering medication, smoking status, diabetes mellitus, body mass index, total caloric intake, SBP, alcohol consumption, and use of antihypertensive medication (Table 4). However, this risk was not monotone across increasing groups for incident ASCVD as those with elevated and decreasing LDL concentrations (group 4) were at lower risk than those with slightly elevated and decreasing levels (group 3) when compared with the referent group (group 1). In contrast, only those with elevated and decreasing LDL‐C concentrations (groups 4 and 5) were at an increased risk of death compared with those in the referent group.
Blood Triglyceride Concentrations and Risk of Outcomes
We did not observe a statistically significant higher risk of ASCVD or death for those in higher triglyceride trajectory groups compared with the referent group, except when comparing the risk of ASCVD among those in triglyceride trajectory group 3 (elevated) to those in group 1 (optimal) (Table 4).
Blood Non‐HDL Cholesterol Concentrations and Risk of Outcomes
Individuals in groups 2 (borderline), 3 (elevated and decreasing), and 4 (very elevated and decreasing) were all at an increased risk of ASCVD compared with those in the optimal (referent) group (Table 4). As with LDL‐C, only those with elevated and decreasing non‐HDL‐C concentrations (group 3) were at an elevated risk of death compared with the referent group.
Predictive Ability of Lipid Trajectory Groups Compared With Other Methods of Lipid Adjustment
We observed that addition of lipids to the base model (regardless of adjustment method), improved the model's predictive capability as reflected by the change in the c‐statistic (Table S4). The change conferred by using trajectory group was generally on par with adjustment for lipid levels at examination 8 or adjustment for average lipid concentrations. Of notable exception, total cholesterol trajectory groups, HDL‐C, and LDL‐C trajectory groups increased the c‐statistic more than either other method when incident ASCVD was the outcome, while HDL‐C trajectory groups outperformed the other methods of adjustment when all‐cause mortality was the dependent variable (Table S4).
Sensitivity Analyses
Results from sensitivity analyses using a weighted approach to the survival analyses and a common set of covariates produced similar results (Tables S5 and S6, Figures S6 and S7) to those described above, demonstrating the robustness of our results to modeling technique and adjustment variables. Additionally, there was no significant association between lipid trajectory groups and risk of incident heart failure (Table S7).
Discussion
Principle Findings
We observed that BMI and smoking were associated with higher circulating concentrations of total cholesterol, LDL‐C, triglycerides, and non‐HDL‐C, and with lower blood levels of HDL‐C. In addition, age and SBP were associated with increased blood concentrations of all lipids, but the age‐related increase in total cholesterol levels was attenuated among men (compared with women) and in those with diabetes mellitus (compared with individuals free of diabetes mellitus). Many of these associations had been previously shown in cross‐sectional analyses and shorter‐term longitudinal analyses,19, 20, 21, 23, 25 and our results, using 35 years of data, support these previous findings. The breadth of our data additionally allowed us to discover interactions influencing lipid levels that were previously missed. In particular, we did not expect to observe an interaction between age and diabetes mellitus with respect to total cholesterol concentrations such that the age‐related increase in total cholesterol among those with diabetes mellitus was attenuated compared with those without. However, upon further inspection of our data, we observed that 48.7% of individuals with diabetes mellitus aged ≥65 years reported use of a lipid‐lowering agent compared with only 25.7% of similarly aged individuals without diabetes mellitus. Thus, it is likely that this observed interaction can be explained by extensive use of lipid‐lowering medication, rather than the presence of diabetes mellitus alone.
We also observed that individuals with elevated levels of total cholesterol or non‐HDL‐C throughout the adult life course were at a significantly increased risk of incident ASCVD and death compared with individuals with low and stable levels of these lipids across the life course, after adjusting for confounders. Similarly, we observed that individuals with lower HDL‐C levels over the adult life course were at a greater risk of incident ASCVD and death than those with high levels of HDL‐C throughout adulthood. While trends across trajectory groups for total cholesterol, non‐HDL‐C, and HDL‐C were relatively monotonic (increasing risk of outcome events with increasing total cholesterol and non‐HDL‐C levels and decreasing risk with increasing HDL‐C levels), this was not the case for LDL‐C trajectory groups. We observed that LDL‐C trajectory group 4 was composed of individuals whose LDL‐C values average around 170 mg/dL at age 45 years, and dropped to about 135 mg/dL by age 64 years; this decreasing trend in LDL‐C over time, attributable to the effect of lipid‐lowering medication (Figure S5), explains the non‐monotonic trend in risk across trajectory groups. In contrast with the other lipids, risk of death and incidence of ASCVD did not differ across trajectories of triglycerides. Another potential interpretation of these data may be that chronic exposure to high total cholesterol, LDL‐C, non‐HDL‐C and/or low HDL‐C is a potent driver of elevated ASCVD risk while risk among individuals with optimal or borderline lipid trajectory profiles is driven more by life experience and other ASCVD risk factors.
To our knowledge, this is the first investigation linking long‐term trajectories of lipid levels to ASCVD and mortality, while simultaneously incorporating usage of lipid‐lowering agents. A strength of this analysis is the use of contemporary data for analysis, which may explain why ASCVD risk prediction equations developed in earlier untreated populations predict higher risk in contemporary cohorts with high statin usage. We demonstrated that this approach of adjusting for lipid trajectory groups was at least as valuable as adjustment for lipid levels at a single time point or adjustment for the average of multiple lipid measurements. Of note, total cholesterol, HDL‐C, and LDL‐C trajectory groups improved the c‐statistic more than either other method for the ASCVD model, and HDL‐C trajectory groups outperformed the other adjustment methods when all‐cause mortality was the dependent variable.
Comparison With Published Literature
It has been reported that, at a US population level, total cholesterol levels have been decreasing over the past 2 decades but as Ford and Capewell reported, much of this decrease is likely because of increased use of lipid‐lowering medications rather than dietary or behavior modifications.22 Our results, depicted in the trajectory plots (Figure and Figure S5), support the role of lipid‐lowering medication usage since we observed a decline in elevated total cholesterol levels when including participants using lipid‐lowering medication (Figure) but observed relatively stable elevated total cholesterol concentrations when limiting to individuals who reported no use of lipid‐lowering medication (Figure S5). In particular, 74% of the individuals in total cholesterol trajectory group 5 (very elevated and decreasing) were on statins at exam 8 compared with 10% in the lowest total cholesterol trajectory group.
The American Heart Association identified untreated total cholesterol <200 mg/dL as 1 of 7 components of ideal cardiovascular health.35 In the 2015 update of the Heart Disease and Stroke Statistics, Mozaffarian et al36 used unpublished NHANES (National Health and Nutrition Examination Survey) data to determine that 46.4% of American adults between 2011 and 2012 satisfied this component of ideal cardiovascular health. In the current investigation, the 1213 untreated individuals in the 2 lowest total cholesterol trajectory groups, or 51.1% of the overall prospective sample, would meet the criterion of untreated total cholesterol <200 mg/dL, which is consistent with the estimates from NHANES.
The causal link between lipid levels, particularly HDL‐C, and cardiovascular disease has recently been under debate.37 The HDL function hypothesis posits that a pathway toward ASCVD is not HDL‐C levels themselves, but rather may be HDL function. Unfortunately, blood HDL‐C concentration measurements cannot accurately estimate HDL function. While the present investigation did not examine causality, the results are concordant with Rader and Hovingh's assertion that, regardless of causality, HDL‐C and other lipids are still important markers of cardiovascular risk.37
Sarwar et al38 reported a significant association between triglyceride levels and risk of cardiovascular disease, but in this study we did not observe an association of triglyceride trajectory group with either outcome, which is consistent with some other investigations.3, 39, 40 It is possible that we did not observe this association because of lack of statistical power since Sarwar's investigation included meta‐analyzed data on 262 525 individuals. However, in a 2009 investigation, the Emerging Risk Factors Collaboration did not observe an association between triglyceride concentrations and risk of coronary heart disease in their meta‐analysis of 68 studies with data from 302 430 individuals, so lack of statistical power may not, in fact, be the sole reason for our null findings about triglycerides and risk of ASCVD3; the use of fasting triglycerides, as opposed to post‐prandial or non‐fasting levels may underestimate the ASCVD risk associated with triglycerides.41
Regardless of the strength of the association between triglyceride concentrations and risk of ASCVD, Sarwar et al, Hulsegge et al, and the Emerging Risk Factors Collaboration (2009) also observed that triglyceride levels tended to be stable over time and/or age groups,3, 38, 39 which may indicate that fewer measurements of triglyceride levels during adulthood may be sufficient to estimate the ASCVD risk that is attributable to triglyceride levels.3
In terms of ASCVD and mortality risk associated with non‐HDL‐C concentrations, our results are concordant with those of Navar‐Boggan et al who reported that even moderate elevations in non‐HDL‐C during young adulthood increase risk of coronary heart disease in later life42 and Abdullah et al who described strong associations between elevations in non‐HDL‐C and mortality.43
Strengths and Limitations
The current investigation has several strengths. It has been shown that use of repeated measurements increases the ability to more accurately quantify risk.13, 44 Here, we used repeated measurements of lipids on the same individuals over the course of 35 years and 8 quadrennial examination cycles, enabling us to look at long‐term profiles of the individual lipids and then link those trajectories to risk of ASCVD and all‐cause mortality. Previous literature assessing the association between lipid levels and risk of ASCVD and mortality did not link long‐term trajectories to these outcomes as we did, and thus this investigation fills a gap in the current knowledge. While the approach seems complicated, the use of trajectories allows for a visual representation of patterns over time, which is valuable in and of itself, and we demonstrated that these groupings are useful as adjustment variables in survival analyses. In addition, we have continuous surveillance for ASCVD and death outcomes at Framingham Heart Study and the collected data allows for comprehensive adjustment for risk factors. The limitations of our investigation also warrant comment. Women's lipid levels change during pregnancy, which we were unable to account for in our models since pregnancy data in this cohort is relatively sparse. However, pregnancy was ascertained at examination cycle 2 and at that time, less than 0.2% of women who attended the examination were pregnant, so it is unlikely that the inability to adjust for pregnancy biased our results. Additionally, not all participants had lipid measurements at each of the 7 examination cycles that contributed to the creation of the trajectory groups. However, there was an average of 6 examinations at which lipid measurements on any given participant was available. Since this average number of examinations was consistent among all trajectory groups for each lipid, it is unlikely that the results were skewed because of missing data. In addition, the average age of participants at entry into the correlates and trajectory samples was 48 years; thus it is possible that the outcomes we observed (particularly for those in the highest total cholesterol, LDL‐C, and non‐HDL‐C trajectory groups) were influenced by exposures that occurred before study entry and, as we did not observe such exposures, we are unable to account for them. It is possible that our null results for triglycerides are attributable to high day‐to‐day variability. A Mendelian randomization approach would control for this variability, but because of the sample size restrictions and aim of the current investigation, we felt that this was beyond the scope of the present work. Finally, our sample was primarily composed of white individuals of European ancestry, and thus the generalizability of our results to other ethnicities is unknown.
Conclusions
Unfavorable lipid trajectories over the adult life‐course confer a higher risk of ASCVD. Long‐term exposure to elevated LDL‐C and non‐HDL‐C concentrations increases ASCVD risk that can only be partially attenuated by commencing a statin regimen, and incorporation of these trajectories adds information to ASCVD risk prediction. Since it has been demonstrated that ratios of lipids can be more predictive of cardiovascular risk than individual lipids alone,45, 46 our investigation lays the groundwork for future exploration into how the combination of multiple lipid trajectories or trajectories of lipid ratios can predict ASCVD and mortality risk.
Sources of Funding
This work was supported by the National Heart, Lung, and Blood Institute contracts N01‐HC‐25195 and HHSN268201500001I. Dr Vasan was also funded by the Evans Foundation and Jay and Louise Coffman Endowment at Boston University.
Disclosures
None.
Supporting information
Table S1. Longitudinal Correlates of Lipid Concentrations in Women
Table S2. Longitudinal Correlates of Lipid Concentrations in Men
Table S3. Trajectory Model Fit Diagnostics
Table S4. Change in c‐Statistic With Addition of Lipid Variables
Table S5. Results From Weighted Cox Model*
Table S6. Risk of ASCVD and All‐Cause Mortality by Lipid Trajectory Group With Common Set of Covariates
Table S7. Rates and Risk of Heart Failure by Lipid Trajectory Group
Figure S1. Timeline and sample selection.
Figure S2. Generation of samples used to assess the correlates of the lipids under study. CVD indicates cardiovascular disease; FHS, Framingham Heart Study; HDL, high‐density lipoprotein; LDL, low‐density lipoprotein.
Figure S3. Generation of samples used to create trajectories of lipids. CVD indicates cardiovascular disease; FHS, Framingham Heart Study; HDL, high‐density lipoprotein; LDL, low‐density lipoprotein. CVD indicates cardiovascular disease; FHS, Framingham Heart Study; HDL, high‐density lipoprotein; LDL, low‐density lipoprotein. †Covariates: Lipid‐lowering medication, smoking status, diabetes mellitus, body mass index, systolic blood pressure, moderate‐to‐heavy drinking, and antihypertensive medication. ‡Covariates: Lipid‐lowering medication, smoking status, diabetes mellitus, body mass index, systolic blood pressure, moderate‐to‐heavy drinking, and physical activity index. §Covariates: Lipid‐lowering medication, smoking status, diabetes mellitus, body mass index, systolic blood pressure, moderate‐to‐heavy drinking, total caloric intake, and antihypertensive medication. ‖Covariates: Lipid‐lowering medication, smoking status, diabetes mellitus, body mass index, systolic blood pressure, total caloric intake, physical activity index, and antihypertensive medication. #Covariates: Lipid‐lowering medication, smoking status, diabetes mellitus, body mass index, systolic blood pressure, total caloric intake, and physical activity index.
Figure S4. Generation of samples used for incidence analyses.
Figure S5. Lipid trajectory plots among participants not on lipid‐lowering treatment.
Figure S6. Kaplan–Meier curves for ASCVD stratified by trajectory groups.
Figure S7. Kaplan–Meier curves for all‐cause mortality stratified by trajectory groups.
(J Am Heart Assoc. 2019;8:e011433 DOI: 10.1161/JAHA.118.011433.)
References
- 1. Hoyert DL. 75 years of mortality in the United States, 1935–2010. NCHS Data Brief. 2012;88:1–8. [PubMed] [Google Scholar]
- 2. Abajobir AA, Abbafati C, Abbas KM, Abd‐Allah F, Abera SF, Aboyans V, Adetokunboh O, Afshin A, Agrawal A, Ahmadi A, et al. Global, regional, and national age‐sex specific mortality for 264 causes of death, 1980–2016: a systematic analysis for the Global Burden of Disease Study 2016. Lancet. 2017;390:1151–1210. [DOI] [PMC free article] [PubMed] [Google Scholar]
- 3. The Emerging Risk Factors Collaboration . Major lipids, apolipoproteins, and risk of vascular disease. JAMA. 2009;302:1993. [DOI] [PMC free article] [PubMed] [Google Scholar]
- 4. Castelli WP, Doyle JT, Gordon T, Hames CG, Hjortland MC, Hulley SB, Kagan A, Zukel WJ. HDL cholesterol and other lipids in coronary heart disease. The cooperative lipoprotein phenotyping study. Circulation. 1977;55:767–772. [DOI] [PubMed] [Google Scholar]
- 5. Gordon T, Castelli WP, Hjortland MC, Kannel WB, Dawber TR. High density lipoprotein as a protective factor against coronary heart disease. The Framingham Study. Am J Med. 1977;62:707–714. [DOI] [PubMed] [Google Scholar]
- 6. Assmann G, Schulte H. Relation of high‐density lipoprotein cholesterol and triglycerides to incidence of atherosclerotic coronary artery disease (the PROCAM experience). Am J Cardiol. 1992;70:733–737. [DOI] [PubMed] [Google Scholar]
- 7. Verschuren WM, Jacobs DR, Bloemberg BP, Kromhout D, Menotti A, Aravanis C, Blackburn H, Buzina R, Dontas AS, Fidanza F. Serum total cholesterol and long‐term coronary heart disease mortality in different cultures. Twenty‐five‐year follow‐up of the seven countries study. JAMA. 1995;274:131–136. [PubMed] [Google Scholar]
- 8. Liao JK. HDL cholesterol, very low levels of LDL cholesterol, and cardiovascular events. Curr Atheroscler Rep. 2008;10:281. [PubMed] [Google Scholar]
- 9. Gordon DJ, Probstfield JL, Garrison RJ, Neaton JD, Castelli WP, Knoke JD, Jacobs DR, Bangdiwala S, Tyroler HA. High‐density lipoprotein cholesterol and cardiovascular disease. Four prospective American studies. Circulation. 1989;79:8–15. [DOI] [PubMed] [Google Scholar]
- 10. Castelli WP, Garrison RJ, Wilson PW, Abbott RD, Kalousdian S, Kannel WB. Incidence of coronary heart disease and lipoprotein cholesterol levels. The Framingham Study. JAMA. 1986;256:2835–2838. [PubMed] [Google Scholar]
- 11. Cromwell WC, Otvos JD, Keyes MJ, Pencina MJ, Sullivan L, Vasan RS, Wilson PWF, D'Agostino RB. LDL particle number and risk of future cardiovascular disease in the Framingham Offspring Study‐Implications for LDL management. J Clin Lipidol. 2007;1:583–592. [DOI] [PMC free article] [PubMed] [Google Scholar]
- 12. Turan TN, Nizam A, Lynn MJ, Egan BM, Le N‐A, Lopes‐Virella MF, Hermayer KL, Harrell J, Derdeyn CP, Fiorella D, Janis LS, Lane B, Montgomery J, Chimowitz MI. Relationship between risk factor control and vascular events in the SAMMPRIS trial. Neurology. 2017;88:379–385. [DOI] [PMC free article] [PubMed] [Google Scholar]
- 13. Paige E, Barrett J, Pennells L, Sweeting M, Willeit P, Di Angelantonio E, Gudnason V, Nordestgaard BG, Psaty BM, Goldbourt U, Best LG, Assmann G, Salonen JT, Nietert PJ, Verschuren WM, Brunner EJ, Kronmal RA, Salomaa V, Bakker SJ, Dagenais GR, Sato S, Jansson J‐H, Willeit J, Onat A, de la Cámara AG, Roussel R, Völzke H, Dankner R, Tipping RW, Meade TW, Donfrancesco C, Kuller LH, Peters A, Gallacher J, Kromhout D, Iso H, Knuiman M, Casiglia E, Kavousi M, Palmieri L, Sundström J, Davis BR, Njølstad I, Couper D, Danesh J, Thompson SG, Wood A. Repeated measurements of blood pressure and cholesterol improves cardiovascular disease risk prediction: an individual‐participant‐data meta‐analysis. Am J Epidemiol. 2017;186:899–907. [DOI] [PMC free article] [PubMed] [Google Scholar]
- 14. Boshuizen HC, Lanti M, Menotti A, Moschandreas J, Tolonen H, Nissinen A, Nedeljkovic S, Kafatos A, Kromhout D. Effects of past and recent blood pressure and cholesterol level on coronary heart disease and stroke mortality, accounting for measurement error. Am J Epidemiol. 2007;165:398–409. [DOI] [PubMed] [Google Scholar]
- 15. Singh GM, Danaei G, Farzadfar F, Stevens GA, Woodward M, Wormser D, Kaptoge S, Whitlock G, Qiao Q, Lewington S, et al. The age‐specific quantitative effects of metabolic risk factors on cardiovascular diseases and diabetes: a pooled analysis. PLoS One. 2013;8:e65174. [DOI] [PMC free article] [PubMed] [Google Scholar]
- 16. Tielemans SMAJ, Geleijnse JM, Menotti A, Boshuizen HC, Soedamah‐Muthu SS, Jacobs DR, Blackburn H, Kromhout D. Ten‐year blood pressure trajectories, cardiovascular mortality, and life years lost in 2 extinction cohorts: the Minnesota Business and Professional Men Study and the Zutphen Study. J Am Heart Assoc. 2015;4:e001378 DOI: 10.1161/JAHA.114.001378. [DOI] [PMC free article] [PubMed] [Google Scholar]
- 17. Wu Z, Jin C, Vaidya A, Jin W, Huang Z, Wu S, Gao X. Longitudinal patterns of blood pressure, incident cardiovascular events, and all‐cause mortality in normotensive diabetic people. Hypertension. 2016;68:71–77. [DOI] [PMC free article] [PubMed] [Google Scholar]
- 18. Allen NB, Siddique J, Wilkins JT, Shay C, Lewis CE, Goff DC, Jacobs DR, Liu K, Lloyd‐Jones D. Blood pressure trajectories in early adulthood and subclinical atherosclerosis in middle age. JAMA. 2014;311:490–497. [DOI] [PMC free article] [PubMed] [Google Scholar]
- 19. Ezzati M, Obermeyer Z, Tzoulaki I, Mayosi BM, Elliott P, Leon DA. Contributions of risk factors and medical care to cardiovascular mortality trends. Nat Rev Cardiol. 2015;12:508–530. [DOI] [PMC free article] [PubMed] [Google Scholar]
- 20. Cobain MR, Pencina MJ, D'Agostino RB, Vasan RS. Lifetime risk for developing dyslipidemia: the Framingham Offspring Study. Am J Med. 2007;120:623–630. [DOI] [PubMed] [Google Scholar]
- 21. Castelli WP. The triglyceride issue: a view from Framingham. Am Heart J. 1986;112:432–437. [DOI] [PubMed] [Google Scholar]
- 22. Ford ES, Capewell S. Trends in total and low‐density lipoprotein cholesterol among U.S. adults: contributions of changes in dietary fat intake and use of cholesterol‐lowering medications. PLoS One. 2013;8:1–8. [DOI] [PMC free article] [PubMed] [Google Scholar]
- 23. Denke MA, Sempos CT, Grundy SM. Excess body weight. An under‐recognized contributor to dyslipidemia in white American women. Arch Intern Med. 1994;154:401–410. [DOI] [PubMed] [Google Scholar]
- 24. Ridker PM. LDL cholesterol: controversies and future therapeutic directions. Lancet. 2014;384:607–617. [DOI] [PubMed] [Google Scholar]
- 25. Nordestgaard BG, Varbo A. Triglycerides and cardiovascular disease. Lancet. 2014;384:626–635. [DOI] [PubMed] [Google Scholar]
- 26. Wilson PWF. Lipids and vascular disease: a framingham perspective. Glob. Heart. 2013;8:25–33. [DOI] [PubMed] [Google Scholar]
- 27. Kannel WB, Feinleib M, McNamara PM, Garrison RJ, Castelli WP. An investigation of coronary heart disease in families. The Framingham offspring study. Am J Epidemiol. 1979;110:281–290. [DOI] [PubMed] [Google Scholar]
- 28. Friedewald WT, Levy RI, Fredrickson DS. Estimation of the concentration of low‐density lipoprotein cholesterol in plasma, without use of the preparative ultracentrifuge. Clin Chem. 1972;18:499–502. [PubMed] [Google Scholar]
- 29. Peloso GM, Auer PL, Bis JC, Voorman A, Morrison AC, Stitziel NO, Brody JA, Khetarpal SA, Crosby JR, Fornage M, Isaacs A, Jakobsdottir J, Feitosa MF, Davies G, Huffman JE, Manichaikul A, Davis B, Lohman K, Joon AY, Smith AV, Grove ML, Zanoni P, Redon V, Demissie S, Lawson K, Peters U, Carlson C, Jackson RD, Ryckman KK, MacKey RH, Robinson JG, Siscovick DS, Schreiner PJ, Mychaleckyj JC, Pankow JS, Hofman A, Uitterlinden AG, Harris TB, Taylor KD, Stafford JM, Reynolds LM, Marioni RE, Dehghan A, Franco OH, Patel AP, Lu Y, Hindy G, Gottesman O, Bottinger EP, Melander O, Orho‐Melander M, Loos RJF, Duga S, Merlini PA, Farrall M, Goel A, Asselta R, Girelli D, Martinelli N, Shah SH, Kraus WE, Li M, Rader DJ, Reilly MP, McPherson R, Watkins H, Ardissino D, Zhang Q, Wang J, Tsai MY, Taylor HA, Correa A, Griswold ME, Lange LA, Starr JM, Rudan I, Eiriksdottir G, Launer LJ, Ordovas JM, Levy D, Chen YDI, Reiner AP, Hayward C, Polasek O, Deary IJ, Borecki IB, Liu Y, Gudnason V, Wilson JG, Van Duijn CM, Kooperberg C, Rich SS, Psaty BM, Rotter JI, O'Donnell CJ, Rice K, Boerwinkle E, Kathiresan S, Cupples LA. Association of low‐frequency and rare coding‐sequence variants with blood lipids and coronary heart disease in 56,000 whites and blacks. Am J Hum Genet. 2014;94:223–232. [DOI] [PMC free article] [PubMed] [Google Scholar]
- 30. Derby CA, Crawford SL, Pasternak RC, Sowers M, Sternfeld B, Matthews KA. Lipid changes during the menopause transition in relation to age and weight: the Study of Women's Health Across the Nation. Am J Epidemiol. 2009;169:1352–1361. [DOI] [PMC free article] [PubMed] [Google Scholar]
- 31. Jones BL, Nagin DS, Roeder K. A SAS procedure based on mixture models for estimating developmental trajectories. Sociol Methods Res. 2001;29:374–393. [Google Scholar]
- 32. Nagin DS. Group‐Based Modeling of Development. Cambridge, MA: Harvard University Press; 2005. [Google Scholar]
- 33. Maas AHEM, Appelman YEA. Gender differences in coronary heart disease. Netherlands Heart J. 2010;18:598–603. [DOI] [PMC free article] [PubMed] [Google Scholar]
- 34. Kalantar‐Zadeh K, Block G, Horwich T, Fonarow GC. Reverse epidemiology of conventional cardiovascular risk factors in patients with chronic heart failure. J Am Coll Cardiol. 2004;43:1439–1444. [DOI] [PubMed] [Google Scholar]
- 35. American Heart Association I . My Life Check—Life's Simple 7. Available at http://www.heart.org/HEARTORG/Conditions/My-Life-Check-Lifes-Simple-7_UCM_471453_Article.jsp#.Wdl8crJ96Uk. Accessed October 7, 2017.
- 36. Mozaffarian D, Benjamin EJ, Go AS, Arnett DK, Blaha MJ, Cushman M, de Ferranti S, Despres J‐P, Fullerton HJ, Howard VJ, Huffman MD, Judd SE, Kissela BM, Lackland DT, Lichtman JH, Lisabeth LD, Liu S, Mackey RH, Matchar DB, McGuire DK, Mohler ER, Moy CS, Muntner P, Mussolino ME, Nasir K, Neumar RW, Nichol G, Palaniappan L, Pandey DK, Reeves MJ, Rodriguez CJ, Sorlie PD, Stein J, Towfighi A, Turan TN, Virani SS, Willey JZ, Woo D, Yeh RW, Turner MB. Heart disease and stroke statistics–2015 update: a report from the American Heart Association. Circulation. 2015;131:e29–e322. [DOI] [PubMed] [Google Scholar]
- 37. Rader DJ, Hovingh GK. HDL and cardiovascular disease. Lancet. 2014;384:618–625. [DOI] [PubMed] [Google Scholar]
- 38. Sarwar N, Danesh J, Eiriksdottir G, Sigurdsson G, Wareham N, Bingham S, Boekholdt SM, Khaw KT, Gudnason V. Triglycerides and the risk of coronary heart disease: 10 158 Incident cases among 262 525 participants in 29 Western prospective studies. Circulation. 2007;115:450–458. [DOI] [PubMed] [Google Scholar]
- 39. Hulsegge G, Spijkerman AMW, Van Der Schouw YT, Bakker SJL, Gansevoort RT, Smit HA, Verschuren WMM. Trajectories of metabolic risk factors and biochemical markers prior to the onset of cardiovascular disease—the Doetinchem cohort study. PLoS One. 2016;11:1–15. [DOI] [PMC free article] [PubMed] [Google Scholar]
- 40. Chapman MJ, Ginsberg HN, Amarenco P, Andreotti F, Borén J, Catapano AL, Descamps OS, Fisher E, Kovanen PT, Kuivenhoven JA, Lesnik P, Masana L, Nordestgaard BG, Ray KK, Reiner Z, Taskinen MR, Tokgözoglu L, Tybjærg‐Hansen A, Watts GF. Triglyceride‐rich lipoproteins and high‐density lipoprotein cholesterol in patients at high risk of cardiovascular disease: evidence and guidance for management. Eur Heart J. 2011;32:1345–1361. [DOI] [PMC free article] [PubMed] [Google Scholar]
- 41. Bansal S, Buring JE, Rifai N, Mora S, Sacks FM, Ridker PM. Fasting compared with nonfasting triglycerides and risk of cardiovascular events in women. JAMA. 2007;298:309–316. [DOI] [PubMed] [Google Scholar]
- 42. Navar‐Boggan AM, Peterson ED, D'Agostino RB, Neely B, Sniderman AD, Pencina MJ. Hyperlipidemia in early adulthood increases long‐term risk of coronary heart disease. Circulation. 2015;131:451–458. [DOI] [PMC free article] [PubMed] [Google Scholar]
- 43. Abdullah SM, Defina LF, Leonard D, Barlow CE, Radford NB, Willis BL, Rohatgi A, McGuire DK, de Lemos JA, Grundy SM, Berry JD, Khera A. Long‐term association of low‐density lipoprotein cholesterol with cardiovascular mortality in individuals at low 10‐year risk of atherosclerotic cardiovascular disease. Circulation. 2018;138:2315–2325. [DOI] [PubMed] [Google Scholar]
- 44. Moran AE, Liu K. Invited commentary: quantifying the added value of repeated measurements. Am J Epidemiol. 2017;186:908–909. [DOI] [PubMed] [Google Scholar]
- 45. Natarajan S, Glick H, Criqui M, Horowitz D, Lipsitz SR, Kinosian B. Cholesterol measures to identify and treat individuals at risk for coronary heart disease. Am J Prev Med. 2003;25:50–57. [DOI] [PubMed] [Google Scholar]
- 46. Nam BH, Kannel WB, D'Agostino RB. Search for an optimal atherogenic lipid risk profile: from the Framingham study. Am J Cardiol. 2006;97:372–375. [DOI] [PubMed] [Google Scholar]
Associated Data
This section collects any data citations, data availability statements, or supplementary materials included in this article.
Supplementary Materials
Table S1. Longitudinal Correlates of Lipid Concentrations in Women
Table S2. Longitudinal Correlates of Lipid Concentrations in Men
Table S3. Trajectory Model Fit Diagnostics
Table S4. Change in c‐Statistic With Addition of Lipid Variables
Table S5. Results From Weighted Cox Model*
Table S6. Risk of ASCVD and All‐Cause Mortality by Lipid Trajectory Group With Common Set of Covariates
Table S7. Rates and Risk of Heart Failure by Lipid Trajectory Group
Figure S1. Timeline and sample selection.
Figure S2. Generation of samples used to assess the correlates of the lipids under study. CVD indicates cardiovascular disease; FHS, Framingham Heart Study; HDL, high‐density lipoprotein; LDL, low‐density lipoprotein.
Figure S3. Generation of samples used to create trajectories of lipids. CVD indicates cardiovascular disease; FHS, Framingham Heart Study; HDL, high‐density lipoprotein; LDL, low‐density lipoprotein. CVD indicates cardiovascular disease; FHS, Framingham Heart Study; HDL, high‐density lipoprotein; LDL, low‐density lipoprotein. †Covariates: Lipid‐lowering medication, smoking status, diabetes mellitus, body mass index, systolic blood pressure, moderate‐to‐heavy drinking, and antihypertensive medication. ‡Covariates: Lipid‐lowering medication, smoking status, diabetes mellitus, body mass index, systolic blood pressure, moderate‐to‐heavy drinking, and physical activity index. §Covariates: Lipid‐lowering medication, smoking status, diabetes mellitus, body mass index, systolic blood pressure, moderate‐to‐heavy drinking, total caloric intake, and antihypertensive medication. ‖Covariates: Lipid‐lowering medication, smoking status, diabetes mellitus, body mass index, systolic blood pressure, total caloric intake, physical activity index, and antihypertensive medication. #Covariates: Lipid‐lowering medication, smoking status, diabetes mellitus, body mass index, systolic blood pressure, total caloric intake, and physical activity index.
Figure S4. Generation of samples used for incidence analyses.
Figure S5. Lipid trajectory plots among participants not on lipid‐lowering treatment.
Figure S6. Kaplan–Meier curves for ASCVD stratified by trajectory groups.
Figure S7. Kaplan–Meier curves for all‐cause mortality stratified by trajectory groups.