

Summary
Plant‐specific EFFECTORS OF TRANSCRIPTION (ET) are characterised by a variable number of highly conserved ET repeats, which are involved in zinc and DNA binding. In addition, ETs share a GIY‐YIG domain, involved in DNA nicking activity. It was hypothesised that ETs might act as epigenetic regulators.
Here, methylome, transcriptome and phenotypic analyses were performed to investigate the role of ET factors and their involvement in DNA methylation in Arabidopsis thaliana.
Comparative DNA methylation and transcriptome analyses in flowers and seedlings of et mutants revealed ET‐specific differentially expressed genes and mostly independently characteristic, ET‐specific differentially methylated regions. Loss of ET function results in pleiotropic developmental defects.
The accumulation of cyclobutane pyrimidine dimers after ultraviolet stress in et mutants suggests an ET function in DNA repair.
Keywords: Arabidopsis thaliana, DNA methylation, DNA repair, EFFECTOR OF TRANSCRIPTION (ET), methylome
Introduction
Plant development depends on complex regulatory interactions, including the orchestrated coordination of numerous transcriptional networks. While interactions of transcription factors with DNA are essential for regulating gene expression, these are often modified through epigenetic mechanisms such as DNA methylation and histone modifications (Du et al., 2015).
Previous work on plant embryogenesis has led to the isolation of a plant‐specific class of gene regulators (Raventos et al., 1998; Ellerstrom et al., 2005; Ivanov et al., 2008) with the founding members known as EFFECTOR OF TRANSCRIPTION (ET). Overexpression studies have shown that ET factors can affect diverse developmental processes, such as seed germination and xylem differentiation (Ellerstrom et al., 2005; Ivanov et al., 2008). ET proteins share highly conserved cysteine–histidine domains with zinc‐ and DNA‐binding repeats. These repeats are also found in nonflowering plants such as the moss Physcomitrella patens, demonstrating their evolutionary conservation. ET1 and ET2‐GFP fusion proteins are detectable in the nucleus (Ivanov et al., 2008). In addition to their functional DNA‐binding ET repeats (Ellerstrom et al., 2005), ET factors share a characteristic DNA single‐strand nuclease domain (GIY‐YIG) with structural similarity to that of bacterial UVRC proteins (Dunin‐Horkawicz et al., 2006) and homing nucleases (Stoddard, 2005; Liu et al., 2013). The bacterial UVRC protein is essential for DNA excision repair (Moolenaar et al., 1998a,b). It is targeted to ultraviolet (UV)‐induced DNA lesions such as thymidine‐dimers, and introduces two single‐strand cuts eight bases upstream and four bases downstream of a lesion. The two single‐strand cuts are made by two structurally distinct domains: a C‐terminal domain consisting of an Endonuclease V (EndoV) and a Helix‐hairpin‐Helix (HhH) domain, which are required for the 5′‐cut, and an N‐terminal GIY‐YIG domain, which inserts the 3′‐nick (Van Roey et al., 2002). The sequence similarity between plant ET factors and UVRC is restricted to this single‐strand cutting GIY‐YIG domain, suggesting that an ancestral bacterial GIY‐YIG domain has been recruited by ET proteins and combined with the DNA‐binding ET repeats to create a novel plant‐specific regulatory protein (Ivanov et al., 2008). The single‐strand cleavage function of the Arabidopsis ET2 GIY‐YIG domain has been confirmed by substitution and complementation of the corresponding domain of the Escherichia coli UVRC protein (Ivanov et al., 2008). On the transcriptional level, a sevenfold upregulation of ET2 was described in response to ionising radiation in Arabidopsis plants (Culligan et al., 2006). This upregulation was not detectable in plants deficient for ATAXIA‐TELANGIECTASIA MUTATED (ATM), a sensor for DNA damage. This observation was driving our hypothesis that ET factors are involved in DNA repair.
The HhH domain, the second DNA‐nicking domain in the UVRC protein, which is structurally distinct from the GIY‐YIG domain, has been considered as the ancestral protein domain for two related epigenetic plant regulators, the DNA glycosylase DEMETER (DME) (Choi et al., 2002) and the REPRESSOR OF SILENCING 1 (ROS1) (Gong et al., 2002; Morales‐Ruiz et al., 2006). DME can introduce single‐strand nicks as part of a DNA demethylation pathway, whereas ROS1 represses homology‐dependent transcriptional silencing by demethylation of the target promoter (Gong et al., 2002). The importance of DNA methylation as an epigenetic marker required for several developmental phases such as seed development and germination was described recently (Kawakatsu et al., 2017). Several regions have been identified in which dynamic control of DNA methylation and transcriptional reactivation is contributing to reproductive development (Borges et al., 2012). Although basic molecular analysis of ETs has been performed, the functional context in planta remains elusive.
Considering the structural and functional similarities between DME/ROS1 and the ET factors, we hypothesised that ETs are involved in regulation of DNA methylation based on their single‐strand cleavage function. Here, we performed whole‐genome DNA methylation analyses in flowers of et1 and et2 mutants to gain insights into the function of these proteins. From combining methylome data with transcriptional profiles and with extensive phenotypic analyses in different organs and tissues, we propose that Arabidopsis ET factors constitute a new class of epigenetic regulators involved in stable inheritance of DNA methylation patterns.
Materials and Methods
Plant material, mutant characterisation and complementation
Arabidopsis thaliana (L.) Heynh. plants of accession Columbia‐0 (Col‐0) for et1‐1, et2‐3, et1‐1 et2‐3 and Wassilewskija‐2 (Ws‐2) accession for et2‐1 were grown in growth chambers under a 16‐h photoperiod at 22°C and 60% humidity. Alternatively, seeds from each line were plated on Murashige and Skoog (MS; Murashige & Skoog, 1962) agar plates, supplemented with the appropriate antibiotic or herbicide when required. Seedlings were grown in growth chambers (Percival Scientific, Perry, IA, USA), under a 16‐h photoperiod at 22°C. Green seedlings were transferred to soil and grown under the same conditions as for the mature plants.
T‐DNA insertion lines et1‐1 and et2‐3 generated in the genetic background of Col‐0 were obtained from the SALK T‐DNA collection (Alonso et al., 2003) and designated as et1‐1 (SALK_000422) and et2‐3 (SALK_151861). The Ws‐2‐derived et2‐1 mutant (Ivanov et al., 2008, 2012) was isolated from the collection of the Arabidopsis Knock‐out Facility (Sussman et al., 2000) at the University of Wisconsin Biotechnology Center, following a pool screening for insertion in the ET2 gene in the Ws‐2 background (Krysan et al., 1999) and has been back crossed six‐times to the Col‐0 ecotype. The positions of the T‐DNA insertions are summarized in Fig. 1(a). Homozygous single mutants, et1‐1, et2‐1 and et2‐3, have been isolated and homozygous double mutants, et1‐1 et2‐1 and et1‐1 et2‐3, have been generated. Absence of full‐length mRNA was confirmed by qualitative PCR spanning the T‐DNA insertion site. Double mutants were generated by crossing the mutant et1‐1 with the et2‐1 and et2‐3 mutants, respectively. Primer sequences are provided in Supporting Information Table S1. To complement the et1‐1 mutation, a Col‐0‐derived ET1 genomic fragment including sequences 1228 bp upstream of the start codon and 792 bp downstream of the stop codon was PCR amplified using Platinum Taq High Fidelity (Invitrogen) and resequenced. The gene fragment was cloned into the pDONR/Zeo vector using the BP reaction (Gateway® BP Clonase® Enzyme Mix, Invitrogen) and transferred into the pBGW destination vector (Karimi et al., 2007) using the LR reaction (Gateway® LR Clonase® Enzyme Mix, Invitrogen). The complementation construct was introduced into Agrobacterium tumefaciens strain GV2260 by freeze–thaw transformation (Chen et al., 1994). The floral dip method (Clough & Bent, 1998) was used for plant transformation.
Figure 1.
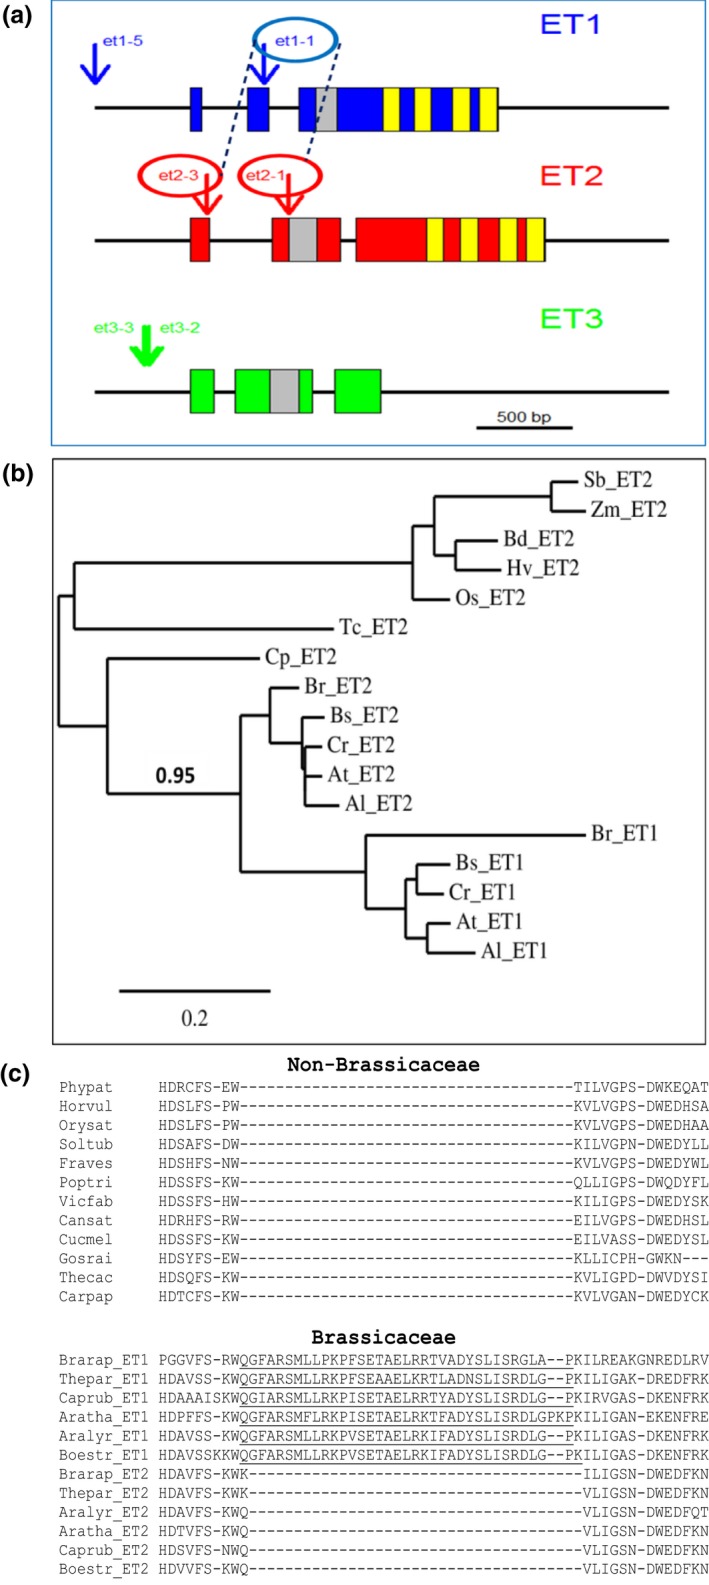
EFFECTORS OF TRANSCRIPTION (ET) gene family features. (a) Gene models and positions of T‐DNA insertions of the ET gene family in Arabidopsis thaliana. The positions of T‐DNA insertions are indicated by arrows. ET repeats and the GIY‐YIG single‐strand cutting domain are given in yellow and grey, respectively. The dashed lines indicate the alleles which have been combined as homozygous double mutants. (b) Phylogenetic tree of ET proteins and ET1‐specific second exon in Brassicaceae. Protein sequences were identified via Blastp in the Phytozome databases (phytozome.jgi.doe.gov) for Arabidopsis lyrata v1 (Al), A. thaliana TAIR9 (At), Boechera stricta v1 (Bs), Brachypodium distachyon v2 (Bd), Brassica rapa v1 (Br), Capsella rubella v1 (Cr), Carica papaya r.Dec2008 (Cp), Oryza sativa v7 (Os), Sorghum bicolor v2 (Sb), Theobroma cacao CGDv1 (Tc) and Zea mays AGPv3 (Zm) and classified after sequence alignment into ET1 and ET2 types. The HRT gene (Hordeum vulgare; GenBank accession CAA04677), which is an ET2 type gene, was added. ET1 type genes could only be identified in Brassicaceae genomes (Al, At, Bs, Br, Cr), which evolved after the α‐whole genome duplication event c. 47 million yr ago (Hohmann et al., 2015), while all genomes encode ET2 types. A phylogenetic tree was calculated using the web service at www.phylogeny.fr (‘one click’ method with Gblocks for curation of the muscle alignment; Dereeper et al., 2008). The phylogenetic tree clearly shows that ET1 types and ET2 types are sister groups within the Brassicaceae. The bootstrap value is given for the node separating Brassicaceae from other plant species and for splitting of ET1 and ET2 types of the Brassicaceae species. (b) Scale bar indicates the proportion of amino acids changing along each branch per amino acid used for the alignment. (c) Amino acid sequence alignment using the muscle program of various Brassicaeceae and non‐Brassicaceae species. Phypat, Physcomitrella patens; Horvul, H. vulgare; Orysat, O. sativa; Soltub, Solanum tuberosum; Fraves, Fragaria vesca; Poptri, Populus trichocarpa; Vicfab, Vicia faba; Cansat, Cannabis sativa; Cucmel, Cucumber melon; Gosrai, Gossypium raimondii; Thecac, T. cacao; Carpap, C. papaya; Brarap, B. rapa; Thepar, Thellungiella parvula; Caprub, C. rubella; Aratha, A. thaliana; Aralyr, A. lyrata; Boestr, B. stricta.
UV stress was applied using 1‐wk‐old seedlings and placing them for 15 min at 30 cm from an MBR UV‐C mobile room sterilizer, mediating 165 µW cm−2 m−1 UV‐C light (253.7 nm).
RNA extraction, cDNA synthesis
Total RNA was isolated from 10‐d‐old seedlings grown under sterile conditions on solid MS medium and from flower buds at the 12c–14 stage (Smyth et al., 1990).Total RNA was isolated from 100 mg of plant material using the RNeasy Plant Mini kit as described in the manufacturer's protocol (Qiagen) dissolved in 30 μl DEPC‐treated water and treated with DNaseI (Roche). Total RNA concentration was quantified using a Nanodrop® ND‐1000 spectrophotometer (NanoDrop Technologies Inc., Waltham, MA, USA) and the quality and integrity was assessed by running 1 μl of every sample on an Agilent 2100 Bioanalyzer (Agilent Technology Inc., Waldbronn, Germany). First‐strand cDNA was synthesized by reverse transcription from total RNA using the RevertAid H Minus First strand cDNA synthesis kit (Fermentas, Vilnius, Lithuania).
Quantitative real‐time PCR
Quantitative real‐time measurements were performed using SYBR Green Master Mix reagent in an ABI Prism 7700 Sequence Detection System (Applied Biosystems), according to the manufacturer's instructions. For each condition, three technical replicates and three biological replicates were used. Transcript levels were determined by quantitative real‐time PCR (RT‐PCR) and the raw threshold cycle values (C T) for all samples were normalised against C T values obtained for the reference transcript of the ACTIN11 gene using qbase software (Biogazelle, Ghent, Belgium). Primers used in this work were designed with the QuantPrime tool (Arvidsson et al., 2008) and are listed in Table S1.
RNA deep sequencing
Strand‐specific cDNA libraries for Illumina Next Generation Sequencing were generated from triplicate biological samples (10‐d‐old seedlings and flower buds at the 12c–14 stage). For detailed description see Methods S1.
DNA methylation analysis
For detailed description of DNA methylation analysis see Methods S1.
Immunodetection of cyclobutane pyrimidine dimers (CPDs)
After 3 h of regeneration samples were taken from the aerial tissue and genomic DNA was extracted using a DNeasy Plant Mini kit as described in the manufacturer's protocol (Qiagen). In total, 1 μg of DNA was spotted on an Amersham Hybond N+ Nylon membrane (GE Healthcare, Little Chalfont, UK). Immunodetection was performed according to the manufacturer's description in TBST/5% milk powder using the Anti‐Thymine Dimer primary antibody (H3) from Abcam (ab10347, Cambridge, UK) and ECL anti‐mouse IgG horseradish peroxidase‐linked whole secondary antibody (NA931V, GE Healthcare). Signals were detected using Clarity Western ECL substrate (Bio‐Rad) and Amersham Hyperfilm ECL (GE Healthcare). Quantification of signals was performed from three independent experiments using the quantity one 4.5.2 software (Bio‐Rad). For quantification the adjusted volume intensity × mm2/unstressed Col‐0 background signal was calculated.
Microscopy techniques
For detailed description of microscopy techniques see Methods S1.
Results
Gene family evolution
The ET gene family in A. thaliana (Fig. 1a) comprises three members, ET1 (AT4G26170), ET2 (AT5G56780) and ET3 (AT5G56770). ET1 and ET2 encode all characteristic ET sequence motifs, including the typical cysteine‐rich ET repeats and the GIY‐YIG domain, whereas ET3 is a partial tandem duplication of ET2 lacking the C‐terminal ET repeats. This 3′ truncated gene is located downstream of ET2 and considered a nonfunctional pseudogene. Here, we focused our analysis on ET1 and ET2, which contain the name‐giving ET‐domain. ET genes are exclusively found in plants, suggesting their involvement in plant‐specific processes. A phylogenetic tree identified the ET2‐type gene as ancestral, dating back to the common ancestor of mosses and seed plants (Fig. 1b). ET2 consists of three exons of which the second encodes the GIY‐YIG domain and the third contains the characteristic ET repeats. ET1 probably resulted from deletion of the second intron of ET2 and an insertion of a complete exon into the first intron of ET2 (Fig. 1c). Acquisition of the second exon, characteristic for ET1 genes, is only found in species of the family Brassicaceae (Fig. 1c). The evolutionary origin of ET1 might be the α‐whole genome duplication event in this family (Hohmann et al., 2015).
Whole genome analysis of differentially methylated regions in et mutants
The single‐strand cleavage function on DNA mediated by the GIY‐YIG domain in the N‐terminal half of the ET factors (Ivanov et al., 2008) suggested an effect on DNA methylation patterns analogous to described demethylases ROS1 and DME (Choi et al., 2002; Gong et al., 2002). Therefore, whole genome bisulphite sequencing (WGBS) of Col‐0, et1‐1 and et2‐3 single mutants and the et1‐1 et2‐3 double mutant was performed. As ET factors show their maximum of expression in reproductive tissues (Ivanov et al., 2008), the analysis was focused on flower buds (12c–14 stage; Smyth et al., 1990). Principal component analysis (PCA) of differential DNA methylation showed clear separation of the genotypes and high similarity between biological replicates (Fig. 2a). Methylated regions (MRs) were identified in every sample using a previously published algorithm (Hagmann et al., 2015). Comparisons of Col‐0 and mutant lines revealed 352 highly differentially methylated regions (hDMRs) for et1‐1, 373 for et2‐3 and 275 for the double mutant (see Table S2 for a list of hDMRs:). Cluster analysis of the hDMRs revealed preferential loss of methylation in the mutants compared to Col‐0 (Fig. 2b), mainly in the symmetric CG context (see Fig. S2a). Although genomic regions covered by hDMRs coincided mainly with transposable elements (TEs), hDMRs were proportionally over‐represented 2 kb upstream and 2 kb downstream of protein‐coding sequences (Fig. 2c). Methylated regions that were classified as non‐DMRs showed minor variation in methylation, confirming the specificity of our algorithm (see Fig. S2d). Among identified hDMRs, MPF (hDMR686) was found, showing et‐1‐1‐specific hyper‐methylation. MPF (Methylated region near Flowering locus C, AT5G10140) was described as a marker region for loss of demethylation function (Penterman et al., 2007a; Zhai et al., 2008). To validate the identified hDMRs the available et‐T‐DNA insertion mutant lines et1‐1, et2‐1 and et2‐3 (Fig. 1a) were tested by clonal bisulphite sequencing analysis (Fig. S1). AT1G26400 (FAD‐Berberine‐binding protein), AT1G34245 (EPF2, Epidermal Protein Factor2) hypermethylated in ros1 and dme mutants, and AtSN1 as a reference region for RdDM (Kuhlmann & Mette, 2012) were tested. At AT1G26400 and AT1G34245, a significant increase of cytosine methylation was detectable for both alleles of the et2 mutant (et2‐1 and et2‐3). This increase was preferentially caused by an increase of methylation in the symmetric CG context.
Figure 2.
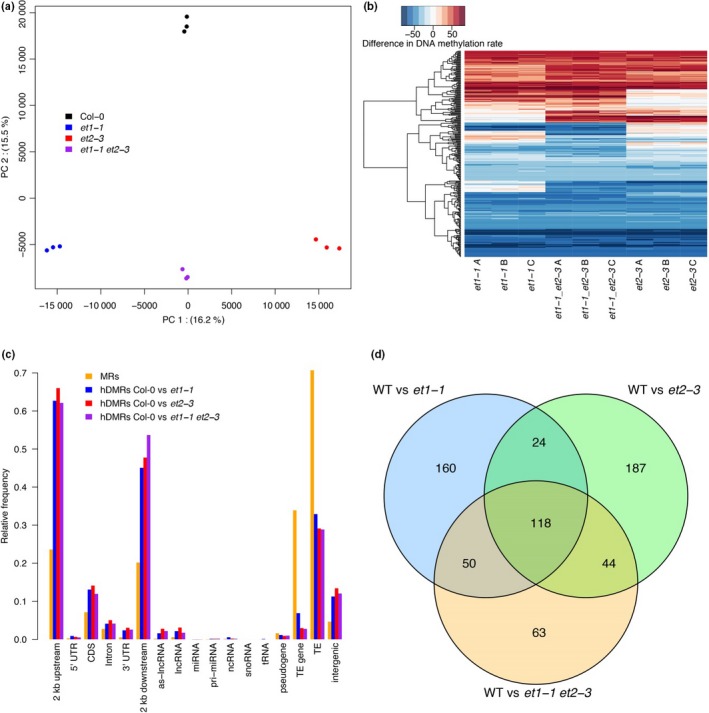
Genome‐wide methylation analysis of Arabidopsis thaliana et mutants in flower. (a) Principal component (PC) analysis of methylation rates within highly differentially methylated regions (hDMRs). For each hDMR, the average methylation rate was calculated per sample from the methylation rates of all cytosines contained within the region. Percentages indicate the amount of variance explained by the respective PC. (b) Gains and losses of methylation in et1‐1, et1‐1 et2‐3 and et2‐3 hDMRs of all contexts (CG, CHG, CHH) . Each line in the heat map represents an hDMR. Gains and losses are expressed as difference of the methylation rate in the mutant to the average of the three Col‐0 replicates. (c) Annotation of cytosines in methylated regions (MRs) and hDMRs. (d) Overlap of hDMRs in all et mutants vs Col‐0 (WT).
The largest hDMR (hDMR180: 1159 bp) was located on chromosome 1 : 28515015, completely covering a HELITRON1 element (AT1TE93275); this locus was depleted of methylation in all three mutant lines. Demethylation of this region was characteristic for nerd mutant plants (Pontier et al., 2012). Loss of this GYF‐and zinc‐finger (CCCH‐type) domain‐containing protein function led to definition of a plant‐specific chromatin‐based RNA silencing pathway depending on RDR1/6. The second region defining the NERD pathway was psORF (AT5G35935). This region was also detected as hDMR750 in the et mutants.
The identified hDMRs in the et1 and et2 single mutants overlapped substantially (Fig. 2d), suggesting similar regulatory function of ET1 and ET2 at these shared loci. In turn, c. 50% of hDMRs were specific to either mutant, indicating an additional gene‐specific influence of either of the two factors on DNA methylation. Differential DNA methylation with respect to Col‐0 was similar in both mutants for a large fraction of hDMRs (Fig. 2c). In total, 70% of hDMRs showed the same directional methylation change. However, distinct roles of ET factors in DNA methylation were also apparent: 15% of et1‐1 hDMRs were hypo‐methylated in et1‐1 but hyper‐methylated in et2‐3, while 6% showed the opposite pattern, which suggests antagonistic roles of ET1 and ET2 for methylation of these loci.
For the vast majority of hDMRs, DNA methylation in the et1‐1 et2‐3 double mutant either reflected the situation in one of the single mutants, or showed additive effects, corroborating the combination of overlapping and specific function of ET1 and ET2 that we had already derived from the hDMR overlap analysis. Intriguingly, a small subset of hDMRs that showed loss of methylation in either et1‐1 or et2‐3 did not show methylation changes in the double mutant, suggesting epistatic interaction of ET1 and ET2 at these loci.
To gain insights into the methylation pathway that ET1 and ET2 might be involved in, we next used the hDMR between Col‐0 and the et1‐1 et2‐3 double mutant as a proxy to investigate DNA methylation at the same loci in a collection of previously published epigenetic mutants (Stroud et al., 2013). As CG methylation was the most prominently affected in et1‐1 et2‐3, we focused our analysis on this context. Analysis of hDMRs with gain of methylation in et1‐1 et2‐3 revealed the closest similarity to methylation patterns of rdd mutant plants (Fig. 3a). rdd is a triple mutant defective for ROS1, DM2 and DML3 (Penterman et al., 2007b).
Figure 3.
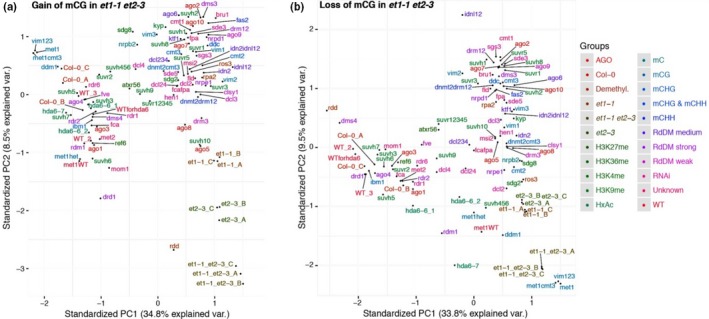
Principal component (PC) analysis of highly differential methylated regions (hDMRs) in Arabidopsis thaliana et1‐1 et2‐3 vs Col‐0 (WT) and other epigenetic mutants (according Stroud et al., 2013). (a) hDMRs with gain of methylation in et1‐1 et2‐3 of CG context. (b) hDMRs with loss of methylation in et1‐1 et2‐3 of CG context.
Regions which reduced CG methylation in et1‐1 et2‐3 (Fig. 3b) compared to Col‐0 showed the closest similarity to met1 (DNA METHYLTRANSFERASE 1; Kankel et al., 2003) and the triple mutant vim1 vim2 vim3 (VARIANT IN METHYLATION; Shook & Richards, 2014), both defective for CG‐specific maintenance of methylation.
Although prior in vitro studies (Ivanov et al., 2012) showed that ETs bind to DNA irrespective of the sequence context, we investigated whether any sequence feature could be identified using the set of identified DMRs. Therefore, we choose the 136 hDMRs detected in et2‐3 flower tissue which showed gain of methylation. We applied the motif‐based sequence analysis tool MEME (Bailey et al., 2006) on these potential ET2 DNA binding motifs. No motif could be identified, suggesting that the DNA binding is not sequence‐specific. The DIMONT approach (Grau et al., 2013), which includes sorting of the sequences according to intensities, did not reveal any binding pattern either. Importantly, when using a motif length of 10 (bgOrder = 0, motifOrder = 0, other parameters = default), we detected two adjacent pyrimidines (TT, CT, TC) as a recurring motif (Fig. S3).
Transcriptome analysis to identify differentially expressed genes in et mutants
Although previous studies showed that a strong overlap of DMRs and differentially expressed genes (DEGs) cannot be expected (Havecker et al., 2012; Kawakatsu et al., 2016), we analysed the transcriptomes of flower buds from the same tissue used for WGBS. Triplicate strand‐specific cDNA libraries of Col‐0, et1‐1, et2‐3 and the double mutant et1‐1 et2‐3 yielded between 13.7 and 23.3 million short reads (107 nt), of which, after adapter and quality trimming, 7.2–12.3 million reads mapped in sense orientation onto annotated, nuclear gene models in the genome of A. thaliana (TAIR10, Table S3). PCA of normalised and mapped read counts revealed reliable separation of the mutant samples and showed that mRNA abundance of the double mutant was more similar to et2‐3 than to et1‐1 (Fig. 4a). DEGs were identified for pairwise comparisons between Col‐0 and et mutants. In total, 337, 330 and 486 DEGs with a false discovery rate (FDR) ≤ 0.01 and an absolute log2 fold change (lg2FC) ≥ 1 were found for the comparisons of Col‐0 vs et1‐1, Col‐0 vs et2‐3, and Col‐0 vs et1‐1 et2‐3, respectively (Fig. 4b). The number of transcripts downregulated in mutants (et1‐1, 193; et2‐3, 240; et1‐1 et2‐3, 329) was always larger than the number of upregulated ones (et1‐1, 144; et2‐3, 90; et1‐1 et2‐3, 157). Similar to hDMRs, we detected DEGs shared between the two single mutants (142) as well as DEGs private to either et1‐1 or et2‐3 (195 and 188, respectively), indicating partial functional redundancy of ET1 and ET2. The 185 transcripts differentially regulated in the et1‐1 et2‐3 double mutant demonstrate that interactions between regulatory pathways influenced by ET1 and ET2 define gene sets not affected in the single mutants. With the exception of three genes, all transcripts affected in two (et1‐1 and et2‐3, 142; et1‐1 and et1‐1/et2‐3, 174; et2‐3 and et1‐1/et2‐3, 256) or all three mutants (129) showed a consistent direction of change in the different lines. lg2FC values of the 129 transcripts significantly influenced in all three mutants showed that for 56 transcripts, the effects of et1‐1 and et2‐3 were additive, while for 72 transcripts the influence of one mutation was modulated by the other . This suggested epistatic interactions, similar to what we observed for DNA methylation effects.
Figure 4.
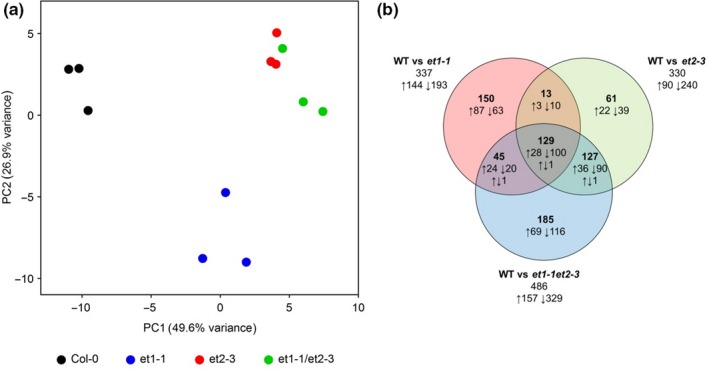
Differentially expressed genes (DEGs) in Arabidopsis thaliana et mutant flowers. (a) Principal component (PC) analysis of flower transcriptome. The plot shows the transcriptome data of et1‐1, et2‐3 and et1‐1 et2‐3 mutants and Col‐0 (WT) in triplicate. (b) Venn diagram of DEGs between Col‐0 (WT) and mutant flowers.
Functional analysis of DEGs
A gene ontology (GO) term analysis for DEGs focusing on GOslim terms using bingo (Maere et al., 2005) showed that the terms ‘plastid’ and ‘thylakoid membrane’ in the category ‘cellular components’ were significantly enriched (FDR < 0.01) in all three et mutant comparisons against Col‐0 (Table 1). Also, the significant enriched terms in the category ‘biological process’ indicated that light‐regulated and light‐dependent photosynthesis was strongly affected in et mutants, even though there was no visible phenotype with respect to leaf colour and vitality. This result prompted us to inspect light‐regulated processes in greater detail, which led to the discovery that certain clock and flowering time genes were differentially expressed. Because care had been taken to harvest flower samples always at the same time of the long day light–dark cycle (3–5 h after lights came on), we were able to analyse DEGs in relation to their usual diurnal peak phase of expression (Mockler et al., 2007; Fig. 5a, et1; Fig. 5b, et2; Fig. 5c, et1‐1 et2‐3). DEGs with a peak phase in late night (zeitgeber time (ztg) 20–22) were generally overexpressed in et mutants, while DEGs with a peak phase during early morning (ztg 3–6) were generally downregulated. This indicated a delay of the clock phases in the et mutants.
Table 1.
Enriched GOslim terms for genes differentially expressed in et mutant flowers
| GOslim term | GO ID | et1‐1 vs Col‐0 | et2‐3 vs Col‐0 | et1‐1 et2‐3 vs Col‐0 | ||||||
|---|---|---|---|---|---|---|---|---|---|---|
| Genes | P adj | Genes | P adj | Genes | P adj | |||||
| Differentially expressed | 337 | 330 | 486 | |||||||
| No GOslim annotation | 6 | 3 | 6 | |||||||
| Cellular component | ||||||||||
| Plastid | 9536 | 48 | 1.90E‐04 | * | 56 | 3.40E‐07 | * | 73 | 3.20E‐07 | * |
| Thylakoid | 9579 | 12 | 3.10E‐03 | * | 16 | 1.80E‐05 | * | 21 | 2.90E‐06 | * |
| Cell | 5623 | 171 | 2.50E‐03 | * | 163 | 1.90E‐02 | 256 | 6.80E‐06 | * | |
| Cell wall | 5618 | 22 | 1.00E‐06 | * | 11 | 8.10E‐02 | 22 | 1.40E‐04 | * | |
| External encapsulating structure | 30312 | 22 | 1.00E‐06 | * | 11 | 8.10E‐02 | 22 | 1.40E‐04 | * | |
| Cytoplasm | 5737 | 70 | 1.20E‐01 | 86 | 1.60E‐04 | * | 117 | 1.90E‐04 | * | |
| Extracellular region | 5576 | 17 | 8.20E‐05 | * | 11 | 3.20E‐02 | 19 | 3.40E‐04 | * | |
| Membrane | 16 020 | 67 | 2.50E‐03 | * | 57 | 8.40E‐02 | 95 | 3.40E‐04 | * | |
| Intracellular | 5622 | 93 | 5.10E‐01 | 112 | 3.80E‐03 | * | 157 | 2.80E‐03 | * | |
| Peroxisome | 5777 | 6 | 2.90E‐02 | 7 | 8.70E‐03 | * | 7 | 4.20E‐02 | ||
| Molecular function | ||||||||||
| Catalytic activity | 3824 | 133 | 4.20E‐06 | * | 135 | 5.60E‐07 | * | 205 | 9.90E‐12 | * |
| Oxygen binding | 19 825 | 9 | 8.20E‐03 | * | 12 | 1.30E‐04 | * | 17 | 4.10E‐06 | * |
| Biological process | ||||||||||
| Response to abiotic stimulus | 9628 | 42 | 1.90E‐08 | * | 49 | 1.20E‐12 | * | 67 | 6.90E‐16 | * |
| Response to stress | 6950 | 51 | 9.50E‐07 | * | 55 | 7.40E‐09 | * | 73 | 1.30E‐09 | * |
| Response to endogenous stimulus | 9719 | 23 | 1.50E‐03 | * | 28 | 1.10E‐05 | * | 42 | 2.00E‐08 | * |
| Secondary metabolic process | 19 748 | 11 | 1.00E‐02 | 22 | 3.50E‐09 | * | 23 | 3.20E‐07 | * | |
| Cellular amino acid and derived metabolic process | 6519 | 14 | 1.00E‐02 | 17 | 5.10E‐04 | * | 27 | 1.60E‐06 | * | |
| Metabolic process | 8152 | 104 | 1.50E‐02 | 117 | 4.80E‐05 | * | 164 | 1.60E‐05 | * | |
| Carbohydrate metabolic process | 5975 | 25 | 1.10E‐04 | * | 27 | 1.10E‐05 | * | 32 | 5.90E‐05 | * |
| Photosynthesis | 15 979 | 8 | 5.90E‐04 | * | 7 | 2.60E‐03 | * | 10 | 1.60E‐04 | * |
| Response to biotic stimulus | 9607 | 18 | 1.00E‐03 | * | 15 | 1.30E‐02 | 23 | 5.00E‐04 | * | |
| Catabolic process | 9056 | 13 | 1.80E‐01 | 11 | 3.60E‐01 | 24 | 2.60E‐03 | * | ||
| Response to external stimulus | 9605 | 8 | 2.70E‐02 | 6 | 1.60E‐01 | 11 | 9.20E‐03 | * | ||
The BINGO app (Maere et al., 2005) of Cytoscape (Smoot et al., 2011) was used to determine enrichment for GOslim_Plant terms using the annotation of Arabidopsis thaliana. All enriched GOslim terms are given, for which an adjusted P‐value (P adj; Benjamini–Hochberg correction; *, P ≤ 0.01) has been observed for differentially expressed genes in at least one comparison of et mutants vs Col‐0.
Figure 5.
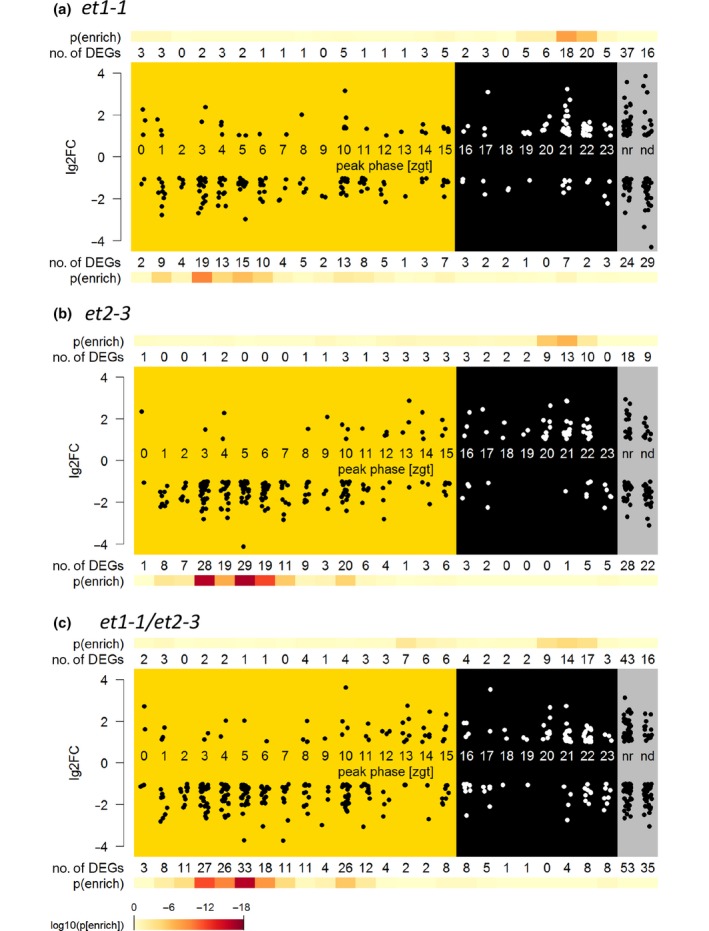
Differentially expressed genes (DEGs) in Arabidopsis thaliana et mutant flowers sorted according their peak phase of expression during the circadian rhythm for (a) et1‐1, (b) et2‐3 and (c) et1‐1/et2‐3. Yellow areas, daytime (light); black areas, night phase (darkness); grey areas, genes which are nonrhythmic (nr) or not detected in a previous study based on the ATH1 chip (Mockler et al., 2007). Each point represent one DEG, and change is given in log2‐fold change (lg2FC). Colour intensity towards red indicates the level of significance of the number of DEGs for each zeitgeber (zgt) time‐phase.
Among DEGs were several key regulators involved in the photoperiodic pathway (Table S3): TIMING OF CAB EXPRESSION1 (TOC1), CIRCADIAN CLOCK ASSOCIATED1 (CCA1), LATE ELONGATED HYPOCOTYL (LHY ), FLOWERING LOCUS T (FT) and its homologous TWIN SISTER OF FLOWERING LOCUS T (TSF).
Based on the focus of our study, several genes were selected for individual inspection. This includes the ET‐gene family and the top 10 DEGs (Table 2). We inspected the top 10 DEGs for correlation of DNA methylation difference. hDMR and DMR lists from Table S2 were used, and the respective genes were additionally inspected for reproducible minor changes in DNA methylation among the triplicates (vDMR, visually detected differential methylated regions and single methylation polymorphisms (SMPs), visually detected single methylation polymorphisms). ET1 expression is lower than ET2 and ET2 shows a peak of expression in flower tissues. In the et1‐1 T‐DNA insertion line as well as in the double mutant, 0–2 reads per million (RPM) are detected which were located downstream of the insertion site, confirming the absence of functional mRNA. Consequently ET1 was found in the list of downregulated genes in et1‐1. An increase of DNA methylation upstream of the second intron associated with the et1‐1 T‐DNA insertion was detectable (DMR1409). In the et2‐3 mutant expression of ET1 was not significantly different from that in Col‐0 (7–11 RPM).
Table 2.
Top 10 list of differential expressed genes in et mutant flowers obtained by RNA sequencing
| et1‐1/Col‐0 | DNA methylation | ||
|---|---|---|---|
| AT4G34550 | −4.297 | SMP coding region | F‐box family protein |
| AT3G09450 | −3.348 | SMP coding region | Fusaric acid resistance protein (TAIR:AT2G28780.1) |
| AT1G02820 | −2.971 | No methylation | Late embryogenesis abundant 3 (LEA3) family protein |
| AT3G17609 | −2.768 | No methylation | HY5‐homologue |
| AT5G28030 | −2.680 | SMP coding region | L‐cysteine desulfhydrase 1 |
| AT4G26170 | −2.662 | DMR1409 coding region | ET1 (TAIR:AT5G56780.1) |
| AT5G43630 | −2.552 | SMP coding region | Zinc knuckle (CCHC‐type) family protein |
| AT1G66725 | −2.538 | No methylation | MIR163; miRNA |
| AT2G21320 | −2.447 | No methylation | B‐box zinc finger family protein |
| AT3G02380 | −2.362 | SMP coding region | CONSTANS‐like 2 |
| AT4G37800 | 2.536 | Xyloglucan endotransglucosylase/hydrolase 7 | |
| AT3G62150 | 2.732 | SMP | P‐glycoprotein 21 |
| AT2G44460 | 2.819 | vDMR coding, promotor | Beta glucosidase 28 |
| AT5G05365 | 3.072 | No methylation | Heavy metal transport/detoxification superfamily protein |
| AT1G65480 | 3.091 | SMP promotor, incr. backgr | FT, PEBP family protein |
| AT5G48850 | 3.153 | SMP coding region | Tetratricopeptide repeat (TPR)‐like superfamily protein |
| AT1G08930 | 3.229 | vDMR 3′ region | Major facilitator superfamily protein |
| AT1G53480 | 3.371 | vDMR coding | mto 1 responding down 1 |
| AT4G20370 | 3.573 | vDMR promotor | TSF, PEBP family protein |
| AT2G09187 | 3.851 | hDMR243 | Athila6 transposable element gene |
| et2‐3/Col‐0 | DNA methylation | ||
|---|---|---|---|
| AT3G09450 | −4.747 | SMP coding region | Fusaric acid resistance protein (TAIR:AT2G28780.1) |
| AT4G34550 | −4.519 | SMP coding region | F‐box family protein (TAIR:AT2G16365.3) |
| AT1G02820 | −4.125 | No methylation | Late embryogenesis abundant 3 (LEA3) family protein |
| AT1G29920 | −3.109 | vDMR coding | Chlorophyll A/B‐binding protein 2 |
| AT3G58990 | −2.835 | SMP 3′ region | Isopropylmalate isomerase 1 |
| AT5G66300 | −2.812 | hDMR865 coding 5′ | NAC domain containing protein 105, VND3 |
| AT3G56290 | −2.807 | Unknown protein | |
| AT3G48320 | −2.797 | SMPs coding region | Cytochrome P450, family 71, subfamily A, polypeptide 21 |
| AT5G58770 | −2.737 | SMPs coding region | Undecaprenyl pyrophosphate synthetase family protein |
| AT3G13061 | −2.696 | SMPs coding region | Other RNA, put. nat. antisense RNA |
| AT1G15010 | 2.401 | Unknown protein AT2G01300.1 | |
| AT1G65480 | 2.454 | SMP promotor | FT, PEBP family protein |
| AT3G18550 | 2.615 | TCP family transcription factor | |
| AT1G56150 | 2.628 | SMP coding region | SAUR‐like auxin‐responsive protein family |
| AT4G15690 | 2.722 | No methylation | Thioredoxin superfamily protein |
| AT5G56780 | 2.835 | SMP, DMR1890 | Effector of transcription2 |
| AT1G08930 | 2.871 | vDMR 3′ | Major facilitator superfamily protein |
| AT1G07050 | 2.874 | No methylation | CCT motif family protein |
| AT5G65080 | 2.936 | SMP 3′ | K‐box region, MADS‐box transcription factor family protein |
| AT4G20370 | 3.160 | TSF, PEBP family protein |
| et1‐1_et2‐3/Col‐0 | DNA methylation | ||
|---|---|---|---|
| AT4G34550 | −4.399 | SMP coding region | F‐box family protein (TAIR:AT2G16365.3) |
| AT4G25470 | −3.732 | No methylation | C‐repeat/DRE binding factor 2 |
| AT1G02820 | −3.710 | No methylation | Late embryogenesis abundant 3 (LEA3) family protein |
| AT2G42540 | −3.065 | vDMR promotor/5′ | Cold‐regulated 15a |
| AT1G18330 | −3.051 | Homeodomain‐like superfamily protein | |
| AT1G29920 | −3.049 | vDMR coding region | Chlorophyll A/B‐binding protein 2 |
| AT5G52310 | −2.984 | Low‐temperature‐responsive protein 78 (LTI78/RD29A) | |
| AT3G09450 | −2.851 | SMP coding region | Fusaric acid resistance protein(TAIR:AT2G28780.1) |
| AT2G31380 | −2.803 | Salt tolerance homologue | |
| AT4G26170 | −2.796 | vDMR coding region | ET1 (TAIR:AT5G56780.1) |
| AT3G26210 | 2.557 | SMP Promotor | Cytochrome P450, family 71, subfamily B, polypeptide 23 |
| AT2G09187 | 2.568 | hDMR243 | Athila6 transposable element gene |
| AT1G56150 | 2.663 | SMP coding region | SAUR‐like auxin‐responsive protein family |
| AT3G11340 | 2.710 | vDMR coding region | UDP‐Glycosyltransferase superfamily protein |
| AT1G08930 | 2.719 | vDMR 3′ | Major facilitator superfamily protein |
| AT1G07050 | 2.742 | No methylation | CCT motif family protein |
| AT3G57460 | 3.129 | hDMR528 Promotor | Catalytics;metal ion binding |
| AT4G20370 | 3.415 | vDMR promotor | TSF, PEBP family protein |
| AT1G65480 | 3.521 | SMP promotor | FT, PEBP family protein |
| AT5G64120 | 3.612 | vDMR coding region | Peroxidase superfamily protein |
SMP: single methylation polymorphism, DMR: differential methylated region, vDMR: visual detected differential methylated region, hDMR: differential methylated region with high significance.
In contrast to the qPCR results, ET2 was found in the top 10 lists of upregulated genes in et2‐3 and the double mutant (lg2FC = 2.8). This might be caused by the integrated pROK2‐derived T‐DNA in the used SALK_151861 line leading to 35S promotor‐driven ectopic transcription (Daxinger et al., 2008). Inspection of reads and subsequent sequencing of the et2‐3 ET2 gene revealed a 24 bp deletion at position 1203 in the third exon and confirmed the T‐DNA insertion located in the first exon 85 bp after the start ATG. A potential alternative translation start 869 bp after start ATG of the gene might lead to expression of a truncated version without DNA cleavage domain. Therefore, absence of functional full‐length ET2 mRNA in the analysed et2‐3 T‐DNA insertion plants could be confirmed. The differential expression was associated with the DMRs 1890 and 1891, located within the coding region of ET2 showing reduction of methylation.
The top upregulated gene in et1‐1 and the et1‐1 et2‐3 double mutant was the cDNA AT2G09187 (lg2FC = 6.54, P adj = 1.1 × 10−221 in et1‐1 and lg2FC = 6.52, P adj = 9.7 × 10−221 in the double mutant), annotated as a transposable element gene and matching the annotated transposable element AT2TE15880 from the Athila6A family. We confirmed upregulation in the et1‐1 mutant by qRT‐PCR (Fig. 6a). The induction is specific for the et1‐1 mutant, indicating a functional difference between both ET mutants concerning the regulation of this transposon. The induced transcript overlapped with the highly differentially methylated region hDMR165 (Fig. 6b), with CG methylation loss specific to et1‐1.
Figure 6.
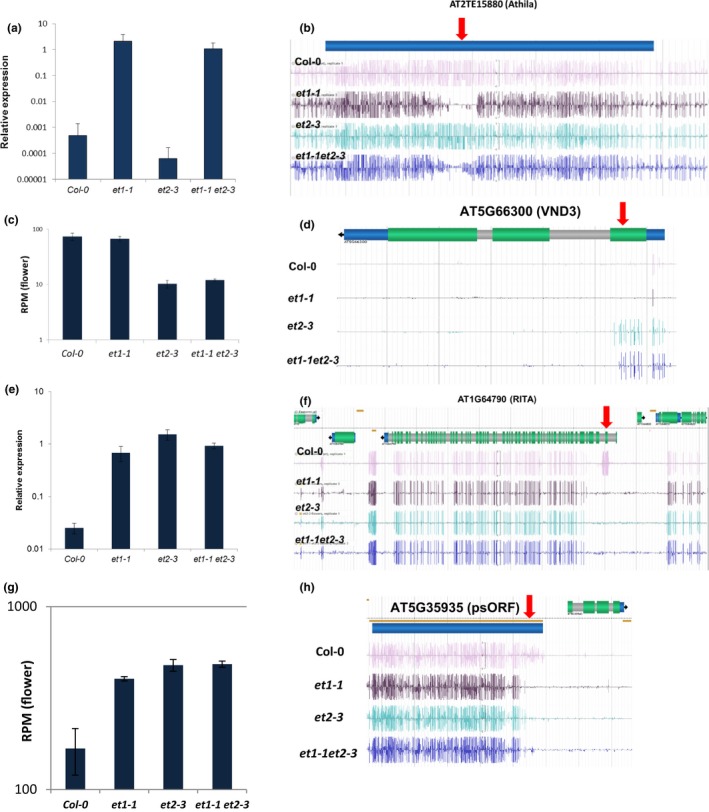
Selected differentially expressed genes (DEGs) in Arabidopsis thaliana et mutant flowers and correlation with differentially methylated regions (DMRs). (a) Relative expression of AT2G09187 (transcribed from AT2TE15880, Athila6A) confirmed by real‐time RT‐qPCR from shoot apical meristem (SAM). Bars indicate the mean of three independent samples with ± SE. (b) DNA methylation signature in the region of AT2TE15880 encoding the Athila6A retroelement. Red arrow indicates hDMR165. (c) Expression analysis of flower tissue of AT5G66300 (VND3) derived from RNA sequencing. Displayed are reads per million from three independent experiments. (d) DNA methylation signature in the region of AT5G66300 encoding VND3 with hDMR865 (red arrow). (e) Relative expression of AT1G64795 (RITA) confirmed by real‐time RT‐qPCR from SAM. (f) DNA methylation signature in the region of AT1G64790 annotated as ILYTHIA. AT1G64795 (RITA) transcripts are antisense orientated to ILYTHIA and covering hDMR153. Blue regions, untranslated regions; green regions, translated regions; grey regions, introns; red arrow points towards the respective hDMR865. Methylation signature shown is as a representative from three independent replicates. (g) Expression analysis of flower tissue of AT5G35935 (psORF) derived from RNA sequencing. Displayed are reads per million from three independent experiments. (h) DNA methylation signature in the region of AT5G35935 annotated as psORF; red arrow points towards the respective hDMR750.
The top6 gene, which showed lg2FC = −2.8 higher transcript abundance in the et2 and et1‐1 et2‐3 flowers, is VND3 (AT5G66300, Fig. 6c). VND3 is a VASCULAR‐RELATED NAC‐DOMAIN transcription factor (Yamaguchi et al., 2010; Zhou et al., 2014) associated with xylem vessel formation (Ivanov et al., 2008). Transcriptional suppression of VND3 was associated with a gain of methylation (hDMR865) at the transcriptional start site of the gene (Fig. 6d).
One gene not present among the top 10 DEGs (sense), but being lg2FC = 4.2 up‐regulated in all mutants (Fig. 6e), was associated with hDMR153 (Fig. 6f). This region is referred to as RITA (AT1G64795, encoded in antisense orientation upstream of ILYTHIA, AT1G64790 and not in the TAIR10 dataset) already described as a metastable DMR (Havecker et al., 2012). As mentioned above, psORF (AT5G35935), hypomethylated in both et mutants (hDMR750), was found to be transcriptionally activated in the mutants (Fig. 6g,h).
In et1‐1, a complementation approach was performed using the endogenous ProET1:ET1 sequence. For the majority of up‐regulated genes in et1‐1, namely AT5G48850 (SDI1), AT1G65480 (FT ), AT2G44460 (BGLU28), AT4G31800 (WRKY18), AT5G40360 (MYB115), AT2G09187 (Athila6A) and the 5′ located antisense transcripts of AT1G64790 (ILLITHYA) RITA (Havecker et al., 2012), transcript level could not be restored to the Col‐0 level by transgenic insertion of ProET1:ET1. For genes found to be downregulated, such as AT1G26770 (EXPA10), AT1G02820 (LEA) and AT4G27330 (SPL) restoration of ET1 transcript level resulted in Col‐0‐like expression (Fig. S4).
Phenotypic characterisation of mutants
The phenotypic analysis of et mutants revealed a series of pleiotropic anomalies during plant development, similar to many other epigenetic pathway mutants (Kakutani et al., 1996; Ronemus et al., 1996).
One of the phenotypic defects observed in et mutant plants became apparent during endosperm differentiation. The endosperm nuclei of the et mutants exhibited a characteristically altered morphology with greatly enlarged nucleoli, possibly indicating enhanced transcriptional activity of rDNA genes (Shaw & Brown, 2012; Baker, 2013) or activated DNA damage repair (Kobayashi, 2008; Shaw & Brown, 2012) (Fig. 7a,b). In contrast to Col‐0 seeds (Fig. 7a), et1‐1 and et2‐3 showed enlarged nuclei in c. 25% of the samples analysed via differential interference contrast (DIC) microscopy (n = 250 seeds; n = 65, n = 68, respectively). In the single mutant et2‐1, c. 30% of endosperms exhibited enlarged nucleoli (n = 75), and in the double mutant et1‐1 et2‐1, up to 70% of endosperms were found with increased nucleoli (n = 172; Figs 7b, S5).
Figure 7.
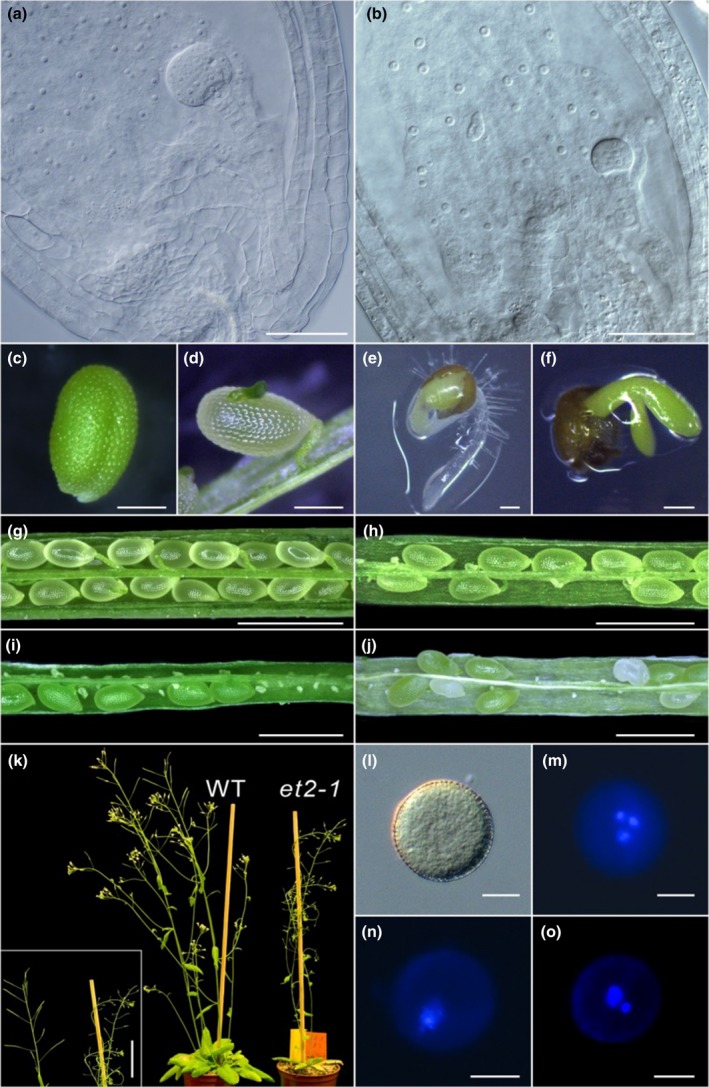
Phenotypic characterisation of various reproductive organs. Affected endosperm differentiation in et mutants. In comparison to Arabidopsis thaliana Col‐0 (a) the endosperm nuclei are greatly enlarged in the et1‐1/et2‐1 double mutant. (b) The morphological effect has been quantified in all et mutants (Supporting Information Fig. S5a). Precocious germination of et mutants in siliques. (c) Col‐0 immature seed. (d) et2‐3 immature seed germinates as early as in the siliques with the cotyledon permeating first along the side of the seed coat. Precocious germination in vitro. In Col‐0 seed the radicle penetrates the seed coat first (e), while in the et1‐1 mutant (f) the cotyledon penetrates first. The in vitro germination was quantified for all et mutants (Fig. S5b). Dissected Col‐0 silique with viable seeds at late walking stick embryo stage (g) and et mutant siliques at a comparable developmental stage containing infertile ovules of (h) et1‐1, (i) et2‐1 and (j) et1‐1/et2‐1. The quantification of infertile ovules observed in siliques of Col‐0 and et mutants is reported in Fig. S5(g). (k) Comparison between a Col‐0 plant (left) and an et2‐1 plant (right) shows high sterility in the et mutant. In the left corner a detail of the sterile siliques is shown. (l–o) Distortion in et mutant pollen. Col‐0 pollen under (l) bright‐field imaging and (m) after DAPI‐staining: Col‐0 pollen nuclei show the larger vegetative nucleus and two generative nuclei. Various distortions during pollen differentiation were found in et mutants. (n) Completely collapsed pollen in et1‐1 and (o) pollen with only one generative nucleus in et2‐3. Complete quantification of pollen nuclei distortion is reported in Fig. S5(e). Bars: (a, b) 50 μm; (c–f) 0.2 mm; (g–j) 1 mm; (k) 3 cm; (l–o) 10 μm.
In et mutants immature seeds started to germinate as early as in the silique. While during regular germination the radicle penetrates the seed coat first, in et mutants the cotyledon emerged first along the side of the seed coat (Fig. 7c,d). No precocious germination was detected in the Col‐0 control. Precocious germination of the et mutants was also observed when immature seeds were germinated in vitro (Fig. 7e,f), and the in vitro germination rate of mutants was elevated (Fig. S6).
The male gametophytes, which develop within the anther, consist of two sperm cells encased within a vegetative cell. Pollen of Col‐0 and et mutants was analysed using DAPI staining (n = 200 each line). In Col‐0, the vegetative nucleus and the two generative nuclei were clearly distinguishable, whereas many abnormal and collapsed pollen grains were detectable in et mutants (Figs 7l–o, S7). The female gametophyte or embryo sac develops within the ovule and consists of two synergids, one egg cell, one central cell and three antipodal cells which degenerate at the mature stage before fertilization (Drews & Koltunow, 2011). In the et mutants, the fusion of the two polar nuclei was partially compromised. The single mutants et1‐1 and et2‐3 showed c. 10% female gametophytes with distortions of polar nuclei fusion (n = 40 and n = 45, respectively), et2‐1 c. 5% (n = 24) and et1‐1 et2‐1 c. 15% (n = 63; Fig. S8).
The et single and double mutant plants also exhibited reduced fertility. Seed set studies of five plants (10 siliques per plant) revealed in et1‐1 and et2‐3 mutants that 10% and 20% of ovules were infertile, respectively. In the et2‐1 mutant as well as in the double mutant et1‐1 et2‐1, a striking 60% of ovules were infertile (Fig. 7g–k).
The flowers of single and double et mutants had aberrant organ numbers, with all whorls being affected (Fig. 8). Flower morphology was quantified from 180 flowers from eight plants per genotype. In et1‐1, 20% of the sepals, 60% of the stamens and 30% of the petals showed anomalies. In et2‐3, 10% of the sepals, 65% of the stamens and 10% of the petals displayed defects (Fig. S9). Homeotic transformations were also found. The most frequent transformation was the conversion of the stamen into carpel‐like structures (Fig. 8). The et2‐1 mutant showed a homeotic transformation rate of c. 50%, whereas the double mutant et1‐1 et2‐1 reached c. 80%. The double mutant showed formation of multiple ovules (up to five per transformed anther) and several stigma‐like structures (up to four per transformed anther) (Fig. S9). To characterise the stamen‐derived ovules in more detail, the tissue was cleared and analysed by DIC microscopy. The ectopic ovules contained a normal gametophyte with fully developed egg cell, synergids and central cell. The normal polarity (synergids localized next to the micropyle, followed by egg cell and central cell) was distorted in the ectopic ovules (Fig. 8).
Figure 8.
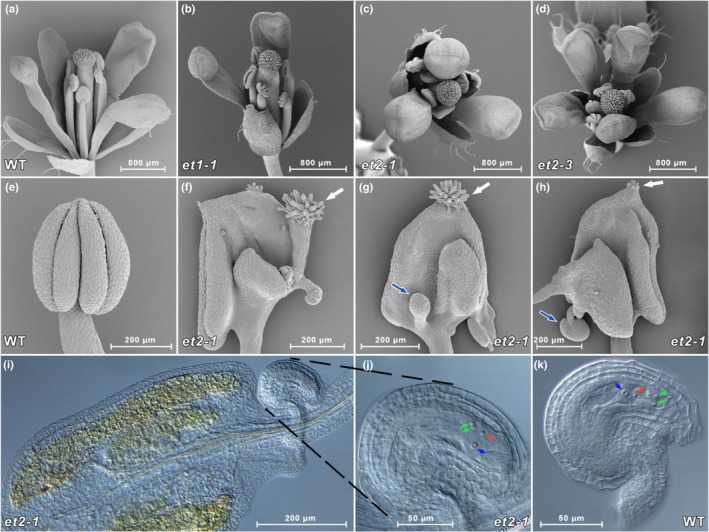
Phenotype of flower organs and stamen‐derived ovules. Changed numbers of flower organs in Arabidopsis thaliana et1‐1, et2‐1 and et2‐3 mutants and homeotic transformation of anthers into carpel‐like structures in et2‐1 mutants. Reflection electron micrographs (REM) of (a) Col‐0 (WT), and (b) selected mutant flowers with two petals and two sepals in et1‐1, (c) with three petals in et2‐1, and (d) five petals in et2‐3. Reflection electron micrographs of (e) Col‐0 anthers and (f–h) various homeotic transformations of anthers into carpel‐like structures including stigma (white arrows) and ovule formation in et2‐1 mutant plants (blue arrows). (i, j) Stamen‐derived ovules of the et2‐1 mutant containing a fully developed gametophyte with egg cell (red arrows), two synergid cells (green arrows) and central cell (blue arrows). The normal polarity of the gametophytic cell types is partially distorted in (j) et2‐1 ovules when compared with (k) Col‐0 ovule. Quantification of the altered flower organ number and of the homeotic phenotype is reported in Supporting Information Fig. S5(c,d).
ET2 mutant plants accumulate mutations
Based on our hypothesis and supported by the results obtained from phenotypic inspection (enlarged nucleoli, pleiotropic phenotypes), methylation (DMRs) and transcriptional (flowering time, delay in circadian rhythm) analyses, we hypothesised that ET factors are involved in DNA damage repair.
For this analysis 1‐wk‐old seedlings were actively stressed by high‐intensity UV light. The UV‐induced CPDs were analysed by immunodetection (Moriel‐Carretero & Aguilera, 2010). While no CPDs were detectable in untreated control samples (Fig. S10), a clear signal was observed for UV‐treated Col‐0 (Fig. 9a). Slight quantitative differences were detectable in stressed et1‐1, whereas et2‐3 and et1‐1 et2‐3 showed a strong qualitative increase of detectable CPDs after UV stress (Fig. 9b).
Figure 9.
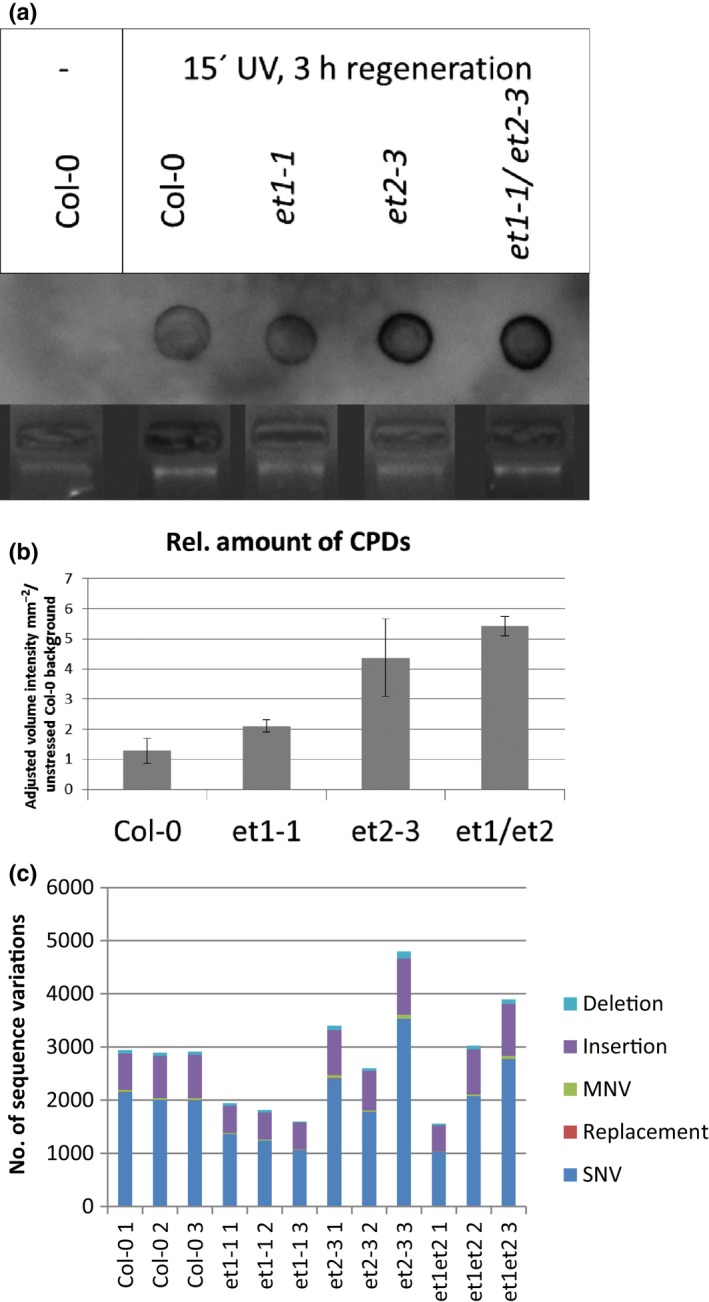
Higher mutation rate in Arabidopsis thaliana et2 mutant plants. (a) Immunodetection of cyclobutane pyrimidine dimers (CPDs) on dot blotted genomic DNA (bottom) extracted from plants after 15 min of UV stress and 3 h regeneration time using a primary antibody against thymidine dimers. (b) Quantification of CPD immunosignals: CPDs were quantified as mean of relative amount of adjusted volume intensity mm−2 relative to untreated Col‐0 background signal. SE indicates the variation among three independent experiments. (c) Sequence variation analysis of et mutants using the RNA sequencing dataset. Colours indicate type of sequence variant.
We used the RNA‐seq data to search for new mutations compared to the A. thaliana reference sequence (TAIR10). Although this approach is hampered by the fact that RNA editing appears as sequence variations (Shao et al., 2014), this method was chosen to quantify differences. Detectable sequence variation can be classified into deletions, insertions, multinucleotide variations (MNVs), replacements and single nucleotide variations (SNVs). The group of SNVs is the most abundant class of mutations. Compared to the reference genome, a similar number of SNVs were detected among the samples in the Col‐0 reference plants. Interestingly, the number of detectable SNVs in the et1‐1 plants was slightly lower, indicating a closer similarity to the TAIR10 reference genome, probably due to the Col‐0 initially used for generation of the ET‐1 T‐DNA insertion. In the et2‐3 plants a stronger deviation between the tested samples was recognised, with the highest accumulation of SNVs in et2‐3 sample 3. A similar variation was detected in the et1‐1/et2‐3 samples (Fig. 9c).
Discussion
Identified DMRs in the et mutants indicate similarities to mutants with impaired demethylation
Based on our hypothesis that ET factors act on DNA by single‐strand cleavage, gain of methylation is expected for ET‐target regions in the ET loss of function mutants. Therefore, identified DMRs were separated for gain and loss of methylation and analysed individually. Approximately one‐third of the identified hDMRs showed gain of methylation in the mutants and two‐thirds loss of methylation. The detectable hypomethylation might result from complex feedback regulation, also reported for ros1 (Zhu et al., 2007) and dme mutant plants (Ortega‐Galisteo et al., 2008). The evolutionary neo‐functionalisation of the ET2‐based gene duplication might explain the identified ET1‐ and ET2‐specific DMR and DEGs.
PCA of hypomethylated hDMRs in et mutants indicated similarities with met1 and vim123 mutants (Kim et al., 2014; Shook & Richards, 2014). This observation indicated the unspecific loss of methylation in genomic regions which are under control of the DNA methylation maintenance pathway. The hypermethylated hDMRs exhibit a high similarity to DMRs detected in the genome of the rdd mutant, a triple mutant defective for ROS1 and DeMeter Like‐2 and 3 (DML2 and DML3) (Penterman et al., 2007b), all involved in demethylation of DNA. Moreover, selected regions known to be affected by active demethylation such as AT1G26400, AT1G34245 and AT5G10140 were found to be hypermethylated in all sequence contexts in the et mutants. Together this implies either a function of ETs in demethylation via deregulating ROS1, DME and DML2/3 or ETs represent another novel component of the active demethylation pathway. Because DME and DMLs are not found among the differentially expressed genes in et mutants, we favour the second view. As regulation at the post‐translational level or upregulation in a different context cannot be excluded, the detailed molecular mechanism remains to be investigated.
Rare overlap between DEGs and regions with strong methylation difference (hDMRs)
Using our definition of hDMRs and DEGs, an overlap of regions and expression was barely detectable: AT2G09187 (overlapping with the Athila6A retrotransposon AT2TE15880) with hDMR165, AT5G56780 (AtET2) with hDMR517 and AT5G66300 (VND3) overlapping with hDMR865. Such rare overlap between DMRs and DEGs has been reported by several other studies (Havecker et al., 2012; Kawakatsu et al., 2016). The position of the DMR, located in a gene body or promotor, together with its genomic environment make it difficult to predict whether the change in methylation is a cause or consequence of differential expression. The rare overlap might indicate that our criteria defining an hDMR definition are very strict. As shown in the top list of DEGs, there are small regions of differential methylation as well as a number of SMPs in the genomic environment of DEGs (Table 2). These might lead to a difference in the amount of detectable transcripts of the respective genes in the mutants.
The over‐representation of detectable hDMRs associated with coding regions indicates a mechanism which might be associated with histone modifications such as H3K9 acetylation (H3K9ac) and H3K4 trimethylation (H3K4me3) (Ha et al., 2011), and these chromatin marks might also improve the recognition of putative ET binding sites. Such influence has been described for the histone acetyltransferase IDM1 which is required for demethylation (Qian et al., 2012). In addition, the identification of the NERD‐pathway target genes (Pontier et al., 2012) HELITRON1 (AT1TE93275) and psORF (AT5G35935) might indicate an association of H3K4 histone modification with ET function.
Specific cases of metastable DMRs and their associated change in gene expression
Our studies identified two genic regions with a strong correlation between differential methylation and associated gene expression in the et mutants. AT1G64795 (RITA) was described as a metastable DMR (Havecker et al., 2012). The identified DNA methylation pattern was found to correspond to Col‐0 6000, which was the corresponding genotype used for the SALK T‐DNA collection. Although expression of this region was not reduced by transgenic reconstitution of ET1 function in the et1‐1 mutant, we cannot conclude whether ETs affect this metastable locus or whether the identified loss of methylation is derived from the use of Col‐0 6000 as SALK mutant background.
The second region, specific for et1‐1, corresponds to the Athila6 transposon belonging to the clade of the Ty3/Gypsy family (Pelissier et al., 1995; Wicker et al., 2007; Slotkin, 2010). Transcriptional activation of Athila6A was reported for mutants of the MOM1 gene encoding a regulator of transcriptional gene silencing (Yokthongwattana et al., 2010), for mutants of the gene MORC6 which is required for heterochromatin condensation and gene silencing (Moissiard et al., 2014), and for mutants of ARABIDOPSIS TRITHORAX RELATED PROTEIN ATX5 and ATX6 (Jacob et al., 2014).
Similar to RITA, the expression level of Athila6 was not reduced by transgenic reconstitution of ET1 function. Again, we could not determine whether loss of ET function mediates a heritable, noncomplementable modification.
Indications for a function of ET factors in DNA repair
The transcriptional induction of ET1 by ionising radiation (Culligan et al., 2006) supported the initial hypothesis (Ivanov et al., 2008) that ETs are involved in DNA repair mechanisms. Inspection of the genevestigator database (Zimmermann et al., 2004) identified the nucleoside antagonist Cordycepin (3′‐deoxyadenosine) as the strongest inducer of ET2 transcription (Fig. S11), also reported to affect the DNA damage response (Lee et al., 2012).
The enlarged nuclei detected in the endosperm of et mutants indicates activated DNA damage repair (Kobayashi, 2008; Shaw & Brown, 2012). Activation of retroelements as detected in particular for the et1‐1 mutant might cause subsequent mutations. Also, the enhanced DNA damage can delay expression of circadian genes (Chung et al., 2016), which in turn might affect DNA methylation patterns and expression of downstream target genes (Chow & Ng, 2017).
The reduced expression of AT4G27330 (SPL, SPOROCYTELESS; Yang et al., 1999) is a molecular feature associated with the precocious germination and incorrect orientation of the female gametophyte resulting in germination with cotyledons first. In addition, incorrect organisation of organ number and failures in development observed in correlation with the reduced expression found in et1‐1 and et2‐3 resemble the described phenotypes based on SPL reduction (Ito et al., 2004; Liu et al., 2009). The misexpression and phenotypic prominences could be complemented by expression of ET1 arguing for a direct effect of ET function. A stress‐sensing mechanism including DNA damage regulating SPL expression has already been discussed (Zhao et al., 2017).
Here we show the accumulation of CPDs in et mutants after UV stress. As the loss of ET function resulted in an accumulation of unrepaired thymidine dimers, we propose that ET factors are involved in the mechanism of DNA repair. A similar observation was reported for ros1 and ddm1 (Questa et al., 2013). ROS1 acts as glycosylase and loss of its function also results in hyper‐methylation of specific genomic regions (Morales‐Ruiz et al., 2006). PCA of hyper‐methylated hDMRs, representing ET sites of action, revealed a close similarity to rdd mutants, which are also affected by a disturbed DNA damage repair mechanism. Close inspection of hDMRs in the ET2 mutant revealed no specific binding sequence, but suggested the presence of two adjacent pyrimidine nucleotides. It was reported that methylated cytosines are more susceptible to UV‐induced CPD formation (Martinez‐Fernandez et al., 2017). Based on the structure and in planta phenotypes we propose that ETs bind at DNA regions including CPDs with preferential histone modification. Here ETs might act by DNA cleavage and by initiating DNA repair.
The identification of clock‐related DEGs using GO analysis further suggests the DNA repair mechanism. The interplay of clock genes and UV‐B response has already been described (Sancar et al., 2000; Thompson & Sancar, 2002; Horak & Farre, 2015). The detected delay in the circadian rhythm in et mutants is in agreements with CRY1‐related repair mechanisms (Sancar et al., 2000; Thompson & Sancar, 2002). The differential expression of HYH (et1‐1), a key regulator of the UV‐B response (Binkert et al., 2014), and the linker Histone1‐3 (AT2G18050) supports the proposed function of ETs. H1‐3 is required for stress adaption on the chromatin level (Rutowicz et al., 2015). RNA interference directed against H1‐3 affected the imprinting mechanism and DNA methylation (Rea et al., 2012). A search for DME downstream targets by analysis of DME overexpression revealed strong upregulation of H1‐3 (Ohr et al., 2007). Therefore, downregulation of H1‐3 might also contribute to detection of ET‐mediated DNA methylation differences.
The increased number of detectable SNPs in et2‐3, derived from the analysis of RNA sequencing data, supports the idea that ET2 acts in DNA repair. The detectable pleiotropic phenotypes, which occur at random and are heritable, might result from a higher mutation rate as a consequence of reduced DNA damage repair. In summary, all indications point toward a role of ETs as novel factors involved in DNA methylation in A. thaliana.
Author contributions
HB conceived the project; FT, PR, BTMH, AC, TR, MK and CB performed the research; MK, FT, LA, CB, SS, IG, DW and HB analysed the data. MK, FT, CB and HB wrote the article with contributions of all the authors.
Supporting information
Please note: Wiley Blackwell are not responsible for the content or functionality of any Supporting Information supplied by the authors. Any queries (other than missing material) should be directed to the New Phytologist Central Office.
Fig. S1 DNA methylation of selected regions analysed in detail by bisulphite sequencing (%).
Fig. S2 Cluster analysis of et mutant hDMRs relative to Col‐0 methylation.
Fig. S3 Identification of common motifs in et2‐3 highly differential methylated regions (hDMRs).
Fig. S4 qPCR analysis of ET1 complementation.
Fig. S5 Affected endosperm differentiation in et mutants.
Fig. S6 Precocious germination of et mutants.
Fig. S7 Quantification of pollen nuclei distortion.
Fig. S8 Distorted embryo sac development in et mutants.
Fig. S9 Homoeotic transformation of stamen into carpel‐like structures in double mutant plants.
Fig. S10 Immunodetection of CPDs on dot blotted genomic DNA extracted from leaf tissue of 2‐wk‐old plants.
Fig. S11 Genevestigator analysis of ET‐gene expression.
Methods S1 Detailed information on RNA deep sequencing, DNA methylation analysis and Microscopy techniques.
Table S1 Primers used in this study.
Table S2 hDMRs and DMRs.
Table S3 DEGs.
Acknowledgements
We greatly appreciate the technical assistance of Sabine Skiebe, Elke Liemann, Annett Busching and Jana Lorenz. We thank Dr A. Himmelbach for the deep RNA sequencing and C. Lanz for help with BS sequencing. We thank Anne Fiebig and Dr Uwe Scholz for data submission to EMBL/ENA. This project was supported by core funding of the IPK Gatersleben (HB) and DFG project BA1235/16‐1 (RKD) the Max Planck Society and DFG SFB 1101 (DW). The authors declare no competing financial interests.
Contributor Information
Helmut Bäumlein, Email: baumlein@ipk-gatersleben.de.
Markus Kuhlmann, Email: kuhlmann@ipk-gatersleben.de.
Data accessibility
Results of the whole genome bisulphite sequencing have been deposited at the European Nucleotide Archive under accession number PRJEB12413. DNA methylation data have been uploaded to the epigenome browser of the EPIC Consortium (https://www.plant-epigenome.org/; https://genomevolution.org/wiki/index.php/EPIC-CoGe) and can be accessed at http://genomevolution.org/r/939v. The flower and seedlings transcriptome data have been deposited at the European Nucleotide Archive under accession numbers PRJEB19779 and PRJEB14889, respectively. All data deposited will be made publicly available upon publication.
References
- Alonso JM, Stepanova AN, Leisse TJ, Kim CJ, Chen H, Shinn P, Stevenson DK, Zimmerman J, Barajas P, Cheuk R et al 2003. Genome‐wide insertional mutagenesis of Arabidopsis thaliana . Science 301: 653–657. [DOI] [PubMed] [Google Scholar]
- Arvidsson S, Kwasniewski M, Riano‐Pachon DM, Mueller‐Roeber B. 2008. QuantPrime–a flexible tool for reliable high‐throughput primer design for quantitative PCR. BMC Bioinformatics 9: 465. [DOI] [PMC free article] [PubMed] [Google Scholar]
- Bailey TL, Williams N, Misleh C, Li WW. 2006. MEME: discovering and analyzing DNA and protein sequence motifs. Nucleic Acids Research 34: W369–W373. [DOI] [PMC free article] [PubMed] [Google Scholar]
- Baker NE. 2013. Developmental regulation of nucleolus size during Drosophila eye differentiation. PLoS ONE 8: e58266. [DOI] [PMC free article] [PubMed] [Google Scholar]
- Binkert M, Kozma‐Bognar L, Terecskei K, De Veylder L, Nagy F, Ulm R. 2014. UV‐B‐responsive association of the Arabidopsis bZIP transcription factor ELONGATED HYPOCOTYL5 with target genes, including its own promoter. Plant Cell 26: 4200–4213. [DOI] [PMC free article] [PubMed] [Google Scholar]
- Borges F, Calarco JP, Martienssen RA. 2012. Reprogramming the epigenome in Arabidopsis pollen. Cold Spring Harbor Symposia on Quantitative Biology 77: 1–5. [DOI] [PMC free article] [PubMed] [Google Scholar]
- Chen H, Nelson RS, Sherwood JL. 1994. Enhanced recovery of transformants of Agrobacterium tumefaciens after freeze–thaw transformation and drug selection. BioTechniques 16: 664–668, 670. [PubMed] [Google Scholar]
- Choi Y, Gehring M, Johnson L, Hannon M, Harada JJ, Goldberg RB, Jacobsen SE, Fischer RL. 2002. DEMETER, a DNA glycosylase domain protein, is required for endosperm gene imprinting and seed viability in Arabidopsis. Cell 110: 33–42. [DOI] [PubMed] [Google Scholar]
- Chow HT, Ng DW. 2017. Regulation of miR163 and its targets in defense against Pseudomonas syringae in Arabidopsis thaliana . Scientific Reports 7: 46433. [DOI] [PMC free article] [PubMed] [Google Scholar]
- Chung PJ, Park BS, Wang H, Liu J, Jang IC, Chua NH. 2016. Light‐inducible MiR163 targets PXMT1 transcripts to promote seed germination and primary root elongation in Arabidopsis. Plant Physiology 170: 1772–1782. [DOI] [PMC free article] [PubMed] [Google Scholar]
- Clough SJ, Bent AF. 1998. Floral dip: a simplified method for Agrobacterium‐mediated transformation of Arabidopsis thaliana . Plant Journal 16: 735–743. [DOI] [PubMed] [Google Scholar]
- Culligan KM, Robertson CE, Foreman J, Doerner P, Britt AB. 2006. ATR and ATM play both distinct and additive roles in response to ionizing radiation. Plant Journal 48: 947–961. [DOI] [PubMed] [Google Scholar]
- Daxinger L, Hunter B, Sheikh M, Jauvion V, Gasciolli V, Vaucheret H, Matzke M, Furner I. 2008. Unexpected silencing effects from T‐DNA tags in Arabidopsis. Trends in Plant Science 13: 4–6. [DOI] [PubMed] [Google Scholar]
- Dereeper A, Guignon V, Blanc G, Audic S, Buffet S, Chevenet F, Dufayard JF, Guindon S, Lefort V, Lescot M et al 2005. Phylogeny.fr: robust phylogenetic analysis for the non‐specialist. Nucleic Acids Res 2008: W465–469. [DOI] [PMC free article] [PubMed] [Google Scholar]
- Drews GN, Koltunow AM. 2011. The female gametophyte. Arabidopsis Book 9: e0155. [DOI] [PMC free article] [PubMed] [Google Scholar]
- Du J, Johnson LM, Jacobsen SE, Patel DJ. 2015. DNA methylation pathways and their crosstalk with histone methylation. Nature Reviews Molecular Cell Biology 16: 519–532. [DOI] [PMC free article] [PubMed] [Google Scholar]
- Dunin‐Horkawicz S, Feder M, Bujnicki JM. 2006. Phylogenomic analysis of the GIY‐YIG nuclease superfamily. BMC Genomics 7: 98. [DOI] [PMC free article] [PubMed] [Google Scholar]
- Ellerstrom M, Reidt W, Ivanov R, Tiedemann J, Melzer M, Tewes A, Moritz T, Mock HP, Sitbon F, Rask L et al 2005. Ectopic expression of EFFECTOR OF TRANSCRIPTION perturbs gibberellin‐mediated plant developmental processes. Plant Molecular Biology 59: 663–681. [DOI] [PubMed] [Google Scholar]
- Gong Z, Morales‐Ruiz T, Ariza RR, Roldan‐Arjona T, David L, Zhu JK. 2002. ROS1, a repressor of transcriptional gene silencing in Arabidopsis, encodes a DNA glycosylase/lyase. Cell 111: 803–814. [DOI] [PubMed] [Google Scholar]
- Grau J, Posch S, Grosse I, Keilwagen J. 2013. A general approach for discriminative de novo motif discovery from high‐throughput data. Nucleic Acids Research 41: e197. [DOI] [PMC free article] [PubMed] [Google Scholar]
- Ha M, Ng DW, Li WH, Chen ZJ. 2011. Coordinated histone modifications are associated with gene expression variation within and between species. Genome Research 21: 590–598. [DOI] [PMC free article] [PubMed] [Google Scholar]
- Hagmann J, Becker C, Muller J, Stegle O, Meyer RC, Wang G, Schneeberger K, Fitz J, Altmann T, Bergelson J et al 2015. Century‐scale methylome stability in a recently diverged Arabidopsis thaliana lineage. PLoS Genetics 11: e1004920. [DOI] [PMC free article] [PubMed] [Google Scholar]
- Havecker ER, Wallbridge LM, Fedito P, Hardcastle TJ, Baulcombe DC. 2012. Metastable differentially methylated regions within Arabidopsis inbred populations are associated with modified expression of non‐coding transcripts. PLoS ONE 7: e45242. [DOI] [PMC free article] [PubMed] [Google Scholar]
- Hohmann N, Wolf EM, Lysak MA, Koch MA. 2015. A time‐calibrated road map of Brassicaceae species radiation and evolutionary history. Plant Cell 27: 2770–2784. [DOI] [PMC free article] [PubMed] [Google Scholar]
- Horak E, Farre EM. 2015. The regulation of UV‐B responses by the circadian clock. Plant Signaling & Behavior 10: e1000164. [DOI] [PMC free article] [PubMed] [Google Scholar]
- Ito T, Wellmer F, Yu H, Das P, Ito N, Alves‐Ferreira M, Riechmann JL, Meyerowitz EM. 2004. The homeotic protein AGAMOUS controls microsporogenesis by regulation of SPOROCYTELESS. Nature 430: 356–360. [DOI] [PubMed] [Google Scholar]
- Ivanov R, Tiedemann J, Czihal A, Baumlein H. 2012. Transcriptional regulator AtET2 is required for the induction of dormancy during late seed development. Journal of Plant Physiology 169: 501–508. [DOI] [PubMed] [Google Scholar]
- Ivanov R, Tiedemann J, Czihal A, Schallau A, le Diep H, Mock HP, Claus B, Tewes A, Baumlein H. 2008. EFFECTOR OF TRANSCRIPTION2 is involved in xylem differentiation and includes a functional DNA single strand cutting domain. Developmental Biology 313: 93–106. [DOI] [PubMed] [Google Scholar]
- Jacob Y, Bergamin E, Donoghue MT, Mongeon V, LeBlanc C, Voigt P, Underwood CJ, Brunzelle JS, Michaels SD, Reinberg D et al 2014. Selective methylation of histone H3 variant H3.1 regulates heterochromatin replication. Science 343: 1249–1253. [DOI] [PMC free article] [PubMed] [Google Scholar]
- Kakutani T, Jeddeloh JA, Flowers SK, Munakata K, Richards EJ. 1996. Developmental abnormalities and epimutations associated with DNA hypomethylation mutations. Proceedings of the National Academy of Sciences, USA 93: 12406–12411. [DOI] [PMC free article] [PubMed] [Google Scholar]
- Kankel MW, Ramsey DE, Stokes TL, Flowers SK, Haag JR, Jeddeloh JA, Riddle NC, Verbsky ML, Richards EJ. 2003. Arabidopsis MET1 cytosine methyltransferase mutants. Genetics 163: 1109–1122. [DOI] [PMC free article] [PubMed] [Google Scholar]
- Karimi M, Depicker A, Hilson P. 2007. Recombinational cloning with plant gateway vectors. Plant Physiology 145: 1144–1154. [DOI] [PMC free article] [PubMed] [Google Scholar]
- Kawakatsu T, Huang SC, Jupe F, Sasaki E, Schmitz RJ, Urich MA, Castanon R, Nery JR, Barragan C, He Y et al 2016. Epigenomic diversity in a global collection of Arabidopsis thaliana accessions. Cell 166: 492–505. [DOI] [PMC free article] [PubMed] [Google Scholar]
- Kawakatsu T, Nery JR, Castanon R, Ecker JR. 2017. Dynamic DNA methylation reconfiguration during seed development and germination. Genome Biology 18: 171. [DOI] [PMC free article] [PubMed] [Google Scholar]
- Kim J, Kim JH, Richards EJ, Chung KM, Woo HR. 2014. Arabidopsis VIM proteins regulate epigenetic silencing by modulating DNA methylation and histone modification in cooperation with MET1. Molecular Plant 7: 1470–1485. [DOI] [PMC free article] [PubMed] [Google Scholar]
- Kobayashi T. 2008. A new role of the rDNA and nucleolus in the nucleus–rDNA instability maintains genome integrity. BioEssays 30: 267–272. [DOI] [PubMed] [Google Scholar]
- Krysan PJ, Young JC, Sussman MR. 1999. T‐DNA as an insertional mutagen in Arabidopsis. Plant Cell 11: 2283–2290. [DOI] [PMC free article] [PubMed] [Google Scholar]
- Kuhlmann M, Mette MF. 2012. Developmentally non‐redundant SET domain proteins SUVH2 and SUVH9 are required for transcriptional gene silencing in Arabidopsis thaliana . Plant Molecular Biology 79: 623–633. [DOI] [PMC free article] [PubMed] [Google Scholar]
- Lee HJ, Burger P, Vogel M, Friese K, Bruning A. 2012. The nucleoside antagonist cordycepin causes DNA double strand breaks in breast cancer cells. Investigational New Drugs 30: 1917–1925. [DOI] [PubMed] [Google Scholar]
- Liu X, Huang J, Parameswaran S, Ito T, Seubert B, Auer M, Rymaszewski A, Jia G, Owen HA, Zhao D. 2009. The SPOROCYTELESS/NOZZLE gene is involved in controlling stamen identity in Arabidopsis. Plant Physiology 151: 1401–1411. [DOI] [PMC free article] [PubMed] [Google Scholar]
- Liu X, Liu S, Feng Y, Liu JZ, Chen Y, Pham K, Deng H, Hirschi KD, Wang X, Cheng N. 2013. Structural insights into the N‐terminal GIY‐YIG endonuclease activity of Arabidopsis glutaredoxin AtGRXS16 in chloroplasts. Proceedings of the National Academy of Sciences, USA 110: 9565–9570. [DOI] [PMC free article] [PubMed] [Google Scholar]
- Maere S, Heymans K, Kuiper M. 2005. BiNGO: a Cytoscape plugin to assess overrepresentation of gene ontology categories in biological networks. Bioinformatics 21: 3448–3449. [DOI] [PubMed] [Google Scholar]
- Martinez‐Fernandez L, Banyasz A, Esposito L, Markovitsi D, Improta R. 2017. UV‐induced damage to DNA: effect of cytosine methylation on pyrimidine dimerization. Signal Transduction and Targeted Therapy 2: 17021. [DOI] [PMC free article] [PubMed] [Google Scholar]
- Mockler TC, Michael TP, Priest HD, Shen R, Sullivan CM, Givan SA, McEntee C, Kay SA, Chory J. 2007. The DIURNAL project: DIURNAL and circadian expression profiling, model‐based pattern matching, and promoter analysis. Cold Spring Harbor Symposia on Quantitative Biology 72: 353–363. [DOI] [PubMed] [Google Scholar]
- Moissiard G, Bischof S, Husmann D, Pastor WA, Hale CJ, Yen L, Stroud H, Papikian A, Vashisht AA, Wohlschlegel JA et al 2014. Transcriptional gene silencing by Arabidopsis microrchidia homologues involves the formation of heteromers. Proceedings of the National Academy of Sciences, USA 111: 7474–7479. [DOI] [PMC free article] [PubMed] [Google Scholar]
- Moolenaar GF, Bazuine M, van Knippenberg IC, Visse R, Goosen N. 1998a. Characterization of the Escherichia coli damage‐independent UvrBC endonuclease activity. Journal of Biological Chemistry 273: 34896–34903. [DOI] [PubMed] [Google Scholar]
- Moolenaar GF, Uiterkamp RS, Zwijnenburg DA, Goosen N. 1998b. The C‐terminal region of the Escherichia coli UvrC protein, which is homologous to the C‐terminal region of the human ERCC1 protein, is involved in DNA binding and 5′‐incision. Nucleic Acids Research 26: 462–468. [DOI] [PMC free article] [PubMed] [Google Scholar]
- Morales‐Ruiz T, Ortega‐Galisteo AP, Ponferrada‐Marin MI, Martinez‐Macias MI, Ariza RR, Roldan‐Arjona T. 2006. DEMETER and REPRESSOR OF SILENCING 1 encode 5‐methylcytosine DNA glycosylases. Proceedings of the National Academy of Sciences, USA 103: 6853–6858. [DOI] [PMC free article] [PubMed] [Google Scholar]
- Moriel‐Carretero M, Aguilera A. 2010. A postincision‐deficient TFIIH causes replication fork breakage and uncovers alternative Rad51‐ or Pol32‐mediated restart mechanisms. Molecular Cell 37: 690–701. [DOI] [PubMed] [Google Scholar]
- Murashige T, Skoog F. 1962. A revised medium for rapid growth and bio assays with tobacco tissue cultures. Physiologia Plantarum 15: 473–497. [Google Scholar]
- Ohr H, Bui AQ, Le BH, Fischer RL, Choi Y. 2007. Identification of putative Arabidopsis DEMETER target genes by GeneChip analysis. Biochemical and Biophysical Research Communications 364: 856–860. [DOI] [PMC free article] [PubMed] [Google Scholar]
- Ortega‐Galisteo AP, Morales‐Ruiz T, Ariza RR, Roldan‐Arjona T. 2008. Arabidopsis DEMETER‐LIKE proteins DML2 and DML3 are required for appropriate distribution of DNA methylation marks. Plant Molecular Biology 67: 671–681. [DOI] [PubMed] [Google Scholar]
- Pelissier T, Tutois S, Deragon JM, Tourmente S, Genestier S, Picard G. 1995. Athila, a new retroelement from Arabidopsis thaliana . Plant Molecular Biology 29: 441–452. [DOI] [PubMed] [Google Scholar]
- Penterman J, Uzawa R, Fischer RL. 2007a. Genetic interactions between DNA demethylation and methylation in Arabidopsis. Plant Physiology 145: 1549–1557. [DOI] [PMC free article] [PubMed] [Google Scholar]
- Penterman J, Zilberman D, Huh JH, Ballinger T, Henikoff S, Fischer RL. 2007b. DNA demethylation in the Arabidopsis genome. Proceedings of the National Academy of Sciences, USA 104: 6752–6757. [DOI] [PMC free article] [PubMed] [Google Scholar]
- Pontier D, Picart C, Roudier F, Garcia D, Lahmy S, Azevedo J, Alart E, Laudie M, Karlowski WM, Cooke R et al 2012. NERD, a plant‐specific GW protein, defines an additional RNAi‐dependent chromatin‐based pathway in Arabidopsis. Molecular Cell 48: 121–132. [DOI] [PubMed] [Google Scholar]
- Qian W, Miki D, Zhang H, Liu Y, Zhang X, Tang K, Kan Y, La H, Li X, Li S et al 2012. A histone acetyltransferase regulates active DNA demethylation in Arabidopsis. Science 336: 1445–1448. [DOI] [PMC free article] [PubMed] [Google Scholar]
- Questa JI, Fina JP, Casati P. 2013. DDM1 and ROS1 have a role in UV‐B induced‐ and oxidative DNA damage in A. thaliana . Frontiers in Plant Science 4: 420. [DOI] [PMC free article] [PubMed] [Google Scholar]
- Raventos D, Skriver K, Schlein M, Karnahl K, Rogers SW, Rogers JC, Mundy J. 1998. HRT, a novel zinc finger, transcriptional repressor from barley. Journal of Biological Chemistry 273: 23313–23320. [DOI] [PubMed] [Google Scholar]
- Rea M, Zheng W, Chen M, Braud C, Bhangu D, Rognan TN, Xiao W. 2012. Histone H1 affects gene imprinting and DNA methylation in Arabidopsis. Plant Journal 71: 776–786. [DOI] [PMC free article] [PubMed] [Google Scholar]
- Ronemus MJ, Galbiati M, Ticknor C, Chen J, Dellaporta SL. 1996. Demethylation‐induced developmental pleiotropy in Arabidopsis. Science 273: 654–657. [DOI] [PubMed] [Google Scholar]
- Rutowicz K, Puzio M, Halibart‐Puzio J, Lirski M, Kotlinski M, Kroten MA, Knizewski L, Lange B, Muszewska A, Sniegowska‐Swierk K et al 2015. A specialized histone H1 variant Is required for adaptive responses to complex abiotic stress and related DNA methylation in Arabidopsis. Plant Physiology 169: 2080–2101. [DOI] [PMC free article] [PubMed] [Google Scholar]
- Sancar A, Thompson C, Thresher RJ, Araujo F, Mo J, Ozgur S, Vagas E, Dawut L, Selby CP. 2000. Photolyase/cryptochrome family blue‐light photoreceptors use light energy to repair DNA or set the circadian clock. Cold Spring Harbor Symposia on Quantitative Biology 65: 157–171. [DOI] [PubMed] [Google Scholar]
- Shao CG, Ma XX, Meng YJ. 2014. SNP or RNA editing? Journal of Plant Biochemistry and Biotechnology 23: 123–124. [Google Scholar]
- Shaw P, Brown J. 2012. Nucleoli: composition, function, and dynamics. Plant Physiology 158: 44–51. [DOI] [PMC free article] [PubMed] [Google Scholar]
- Shook MS, Richards EJ. 2014. VIM proteins regulate transcription exclusively through the MET1 cytosine methylation pathway. Epigenetics 9: 980–986. [DOI] [PMC free article] [PubMed] [Google Scholar]
- Slotkin RK. 2010. The epigenetic control of the Athila family of retrotransposons in Arabidopsis. Epigenetics 5: 483–490. [DOI] [PubMed] [Google Scholar]
- Smoot ME, Ono K, Ruscheinski J, Wang PL, Ideker T. 2011. Cytoscape 2.8: new features for data integration and network visualization. Bioinformatics 27: 431–432. [DOI] [PMC free article] [PubMed] [Google Scholar]
- Smyth DR, Bowman JL, Meyerowitz EM. 1990. Early flower development in Arabidopsis. Plant Cell 2: 755–767. [DOI] [PMC free article] [PubMed] [Google Scholar]
- Stoddard BL. 2005. Homing endonuclease structure and function. Quarterly Reviews of Biophysics 38: 49–95. [DOI] [PubMed] [Google Scholar]
- Stroud H, Greenberg MV, Feng S, Bernatavichute YV, Jacobsen SE. 2013. Comprehensive analysis of silencing mutants reveals complex regulation of the Arabidopsis methylome. Cell 152: 352–364. [DOI] [PMC free article] [PubMed] [Google Scholar]
- Sussman MR, Amasino RM, Young JC, Krysan PJ, Austin‐Phillips S. 2000. The Arabidopsis knockout facility at the University of Wisconsin‐Madison. Plant Physiology 124: 1465–1467. [DOI] [PMC free article] [PubMed] [Google Scholar]
- Thompson CL, Sancar A. 2002. Photolyase/cryptochrome blue‐light photoreceptors use photon energy to repair DNA and reset the circadian clock. Oncogene 21: 9043–9056. [DOI] [PubMed] [Google Scholar]
- Van Roey P, Meehan L, Kowalski JC, Belfort M, Derbyshire V. 2002. Catalytic domain structure and hypothesis for function of GIY‐YIG intron endonuclease I‐TevI. Natural Structural Biology 9: 806–811. [DOI] [PubMed] [Google Scholar]
- Wicker T, Sabot F, Hua‐Van A, Bennetzen JL, Capy P, Chalhoub B, Flavell A, Leroy P, Morgante M, Panaud O et al 2007. A unified classification system for eukaryotic transposable elements. Nature Reviews Genetics 8: 973–982. [DOI] [PubMed] [Google Scholar]
- Yamaguchi M, Ohtani M, Mitsuda N, Kubo M, Ohme‐Takagi M, Fukuda H, Demura T. 2010. VND‐INTERACTING2, a NAC domain transcription factor, negatively regulates xylem vessel formation in Arabidopsis. Plant Cell 22: 1249–1263. [DOI] [PMC free article] [PubMed] [Google Scholar]
- Yang WC, Ye D, Xu J, Sundaresan V. 1999. The SPOROCYTELESS gene of Arabidopsis is required for initiation of sporogenesis and encodes a novel nuclear protein. Genes & Development 13: 2108–2117. [DOI] [PMC free article] [PubMed] [Google Scholar]
- Yokthongwattana C, Bucher E, Caikovski M, Vaillant I, Nicolet J, Mittelsten Scheid O, Paszkowski J. 2010. MOM1 and Pol‐IV/V interactions regulate the intensity and specificity of transcriptional gene silencing. EMBO Journal 29: 340–351. [DOI] [PMC free article] [PubMed] [Google Scholar]
- Zhai J, Liu J, Liu B, Li P, Meyers BC, Chen X, Cao X. 2008. Small RNA‐directed epigenetic natural variation in Arabidopsis thaliana . PLoS Genetics 4: e1000056. [DOI] [PMC free article] [PubMed] [Google Scholar]
- Zhao F, Zheng YF, Zeng T, Sun R, Yang JY, Li Y, Ren DT, Ma H, Xu ZH, Bai SN. 2017. Phosphorylation of SPOROCYTELESS/NOZZLE by the MPK3/6 kinase is required for anther development. Plant Physiology 173: 2265–2277. [DOI] [PMC free article] [PubMed] [Google Scholar]
- Zhou J, Zhong R, Ye ZH. 2014. Arabidopsis NAC domain proteins, VND1 to VND5, are transcriptional regulators of secondary wall biosynthesis in vessels. PLoS ONE 9: e105726. [DOI] [PMC free article] [PubMed] [Google Scholar]
- Zhu J, Kapoor A, Sridhar VV, Agius F, Zhu JK. 2007. The DNA glycosylase/lyase ROS1 functions in pruning DNA methylation patterns in Arabidopsis. Current Biology 17: 54–59. [DOI] [PubMed] [Google Scholar]
- Zimmermann P, Hirsch‐Hoffmann M, Hennig L, Gruissem W. 2004. GENEVESTIGATOR. Arabidopsis microarray database and analysis toolbox. Plant Physiology 136: 2621–2632. [DOI] [PMC free article] [PubMed] [Google Scholar]
Associated Data
This section collects any data citations, data availability statements, or supplementary materials included in this article.
Supplementary Materials
Please note: Wiley Blackwell are not responsible for the content or functionality of any Supporting Information supplied by the authors. Any queries (other than missing material) should be directed to the New Phytologist Central Office.
Fig. S1 DNA methylation of selected regions analysed in detail by bisulphite sequencing (%).
Fig. S2 Cluster analysis of et mutant hDMRs relative to Col‐0 methylation.
Fig. S3 Identification of common motifs in et2‐3 highly differential methylated regions (hDMRs).
Fig. S4 qPCR analysis of ET1 complementation.
Fig. S5 Affected endosperm differentiation in et mutants.
Fig. S6 Precocious germination of et mutants.
Fig. S7 Quantification of pollen nuclei distortion.
Fig. S8 Distorted embryo sac development in et mutants.
Fig. S9 Homoeotic transformation of stamen into carpel‐like structures in double mutant plants.
Fig. S10 Immunodetection of CPDs on dot blotted genomic DNA extracted from leaf tissue of 2‐wk‐old plants.
Fig. S11 Genevestigator analysis of ET‐gene expression.
Methods S1 Detailed information on RNA deep sequencing, DNA methylation analysis and Microscopy techniques.
Table S1 Primers used in this study.
Table S2 hDMRs and DMRs.
Table S3 DEGs.
Data Availability Statement
Results of the whole genome bisulphite sequencing have been deposited at the European Nucleotide Archive under accession number PRJEB12413. DNA methylation data have been uploaded to the epigenome browser of the EPIC Consortium (https://www.plant-epigenome.org/; https://genomevolution.org/wiki/index.php/EPIC-CoGe) and can be accessed at http://genomevolution.org/r/939v. The flower and seedlings transcriptome data have been deposited at the European Nucleotide Archive under accession numbers PRJEB19779 and PRJEB14889, respectively. All data deposited will be made publicly available upon publication.