

Abstract
Dasabuvir is mainly metabolized by cytochrome P450 (CYP) 2C8 and is predominantly used in a regimen containing ritonavir. Ritonavir and clopidogrel are inhibitors of CYP3A4 and CYP2C8, respectively. In a randomized, crossover study in 12 healthy subjects, we examined the impact of clinical doses of ritonavir (for 5 days), clopidogrel (for 3 days), and their combination on dasabuvir pharmacokinetics, and the effect of ritonavir on clopidogrel. Clopidogrel, but not ritonavir, increased the geometric mean AUC0‐∞ of dasabuvir 4.7‐fold; range 2.0–10.1‐fold (P = 8·10−7), compared with placebo. Clopidogrel and ritonavir combination increased dasabuvir AUC0‐∞ 3.9‐fold; range 2.1–7.9‐fold (P = 2·10−6), compared with ritonavir alone. Ritonavir decreased the AUC0‐4h of clopidogrel active metabolite by 51% (P = 0.0001), and average platelet inhibition from 51% without ritonavir to 31% with ritonavir (P = 0.0007). In conclusion, clopidogrel markedly elevates dasabuvir concentrations, and patients receiving ritonavir are at risk for diminished clopidogrel response.
Study Highlights.
WHAT IS THE CURRENT KNOWLEDGE ON THE TOPIC?
☑ Dasabuvir is mainly metabolized by hepatic CYP2C8. Clopidogrel is a mechanism‐based CYP2C8 inhibitor, but PBPK modeling studies have suggested its impact on dasabuvir pharmacokinetics to be limited. CYP3A4 is involved in clopidogrel bioactivation, but it is not known how the strong CYP3A4 inhibitor ritonavir affects the pharmacokinetics and antiplatelet efficacy of clopidogrel.
WHAT QUESTION DID THIS STUDY ADDRESS?
☑ This research characterized the effects of clopidogrel, ritonavir, and their combination on the pharmacokinetics of dasabuvir. Secondarily, the study explored whether ritonavir affects the bioactivation of clopidogrel.
WHAT DOES THIS STUDY ADD TO OUR KNOWLEDGE?
☑ Clopidogrel is a strong CYP2C8 inhibitor and it increases dasabuvir exposure about 5‐fold, even 10‐fold in some subjects. Furthermore, ritonavir impairs the antiplatelet effect of clopidogrel and decreases clopidogrel active metabolite AUC.
HOW MIGHT THIS CHANGE CLINICAL PHARMACOLOGY OR TRANSLATIONAL SCIENCE?
☑ Clopidogrel can potentially increase the risk for adverse effects of dasabuvir. Moreover, clopidogrel should not be the primarily prescribed antiplatelet agent for patients on ritonavir therapy. Dasabuvir may serve as a sensitive CYP2C8 probe in drug–drug interaction studies.
Dasabuvir, a nonstructural protein 5B inhibitor, is part of a novel four‐drug (3D) regimen for the treatment of chronic hepatitis C virus (HCV) genotype 1 infection, which affects more than 80 million people worldwide.1, 2 The drug–drug interaction (DDI) potential of the dasabuvir, paritaprevir/ritonavir, and ombitasvir regimen has been characterized as a part of the marketing approval process, but the compounds are yet individually understudied in this regard.3, 4, 5, 6 In vitro, the biotransformation of dasabuvir to its tert‐butyl hydroxyl metabolite (M1), the most abundant metabolite in plasma,7 is mediated predominantly by cytochrome P450 (CYP) 2C8, while CYP3A4 is responsible for about 30% of the overall metabolism of dasabuvir in the absence of ritonavir.7, 8, 9 Accordingly, the concomitant administration of gemfibrozil, a strong CYP2C8 inhibitor, increased the area under plasma concentration–time curve (AUC) of dasabuvir 11‐fold in humans, and prolonged its half‐life (t ½) 18‐fold.6 Due to the potential hazards of DDIs, concurrent administration of dasabuvir with strong CYP2C8 inhibitors is contraindicated.10 Moreover, from another perspective, the sensitivity of dasabuvir to CYP2C8 inhibition could make it applicable in pharmacokinetic studies as a CYP2C8 probe substrate.11 Of note, dasabuvir itself does not induce or inhibit CYP enzymes to a clinically relevant extent.6, 12
Clopidogrel is a prodrug, activated in two steps. About 90% of clopidogrel is hydrolyzed by the polymorphic carboxylesterase 1 (CES1) to a pharmacologically inactive carboxylic acid metabolite,13, 14, 15 which is further glucuronized to an acyl‐β‐D‐glucuronide metabolite by uridine 5′‐diphospho‐glucuronosyltransferase (UGT) 2B enzymes.16, 17 The bioactivation of clopidogrel to the pharmacologically active cis‐5‐thiol metabolite is susceptible to changes in CYP2C19 activity,18, 19 but also CYP3A contributes to clopidogrel activation. For example, grapefruit juice, an inhibitor of CYP3A4 in the gut wall, has impaired the bioactivation of clopidogrel and consequently the inhibition of platelet aggregation.20 In antiviral drug combinations, ritonavir is commonly adopted as a pharmacokinetic booster due to its strong CYP3A4 inhibitory effect, permitting lower and standardized dosing of other drugs such as paritaprevir in the 3D protocol.21 Despite the prevalent utilization of ritonavir, its impact on clopidogrel pharmacokinetics and antiplatelet effects is yet largely unexplored.
In recent years, clopidogrel has been found to significantly increase the exposure to several CYP2C8 substrates, e.g., repaglinide, pioglitazone, and montelukast.22, 23, 24, 25 The main mechanism of the aforementioned DDIs is the strong time‐dependent CYP2C8 inactivation by clopidogrel's phase II acyl‐β‐D‐glucuronide metabolite.22 Along with CYP2C8 inhibition, additional interaction mechanisms, e.g., inhibition of CYP3A4 and organic anion transporting polypeptide (OATP) 1B1, a hepatic influx transporter, by clopidogrel have been suggested to explain these DDIs.9, 26 In clinical studies, however, clopidogrel has not augmented the exposure to sensitive CYP3A4 and OATP1B1 substrates.24, 27
Marked increases in dasabuvir exposure are potentially associated with adverse effects, most notably prolongation of the QTc interval.3, 10, 28 Therefore, identifying clinically meaningful DDIs is essential for patient safety. Furthermore, there is an urge for selective and sensitive CYP2C8 probe substrates for clinical research use,11 and the pharmacokinetic properties of dasabuvir appear promising for such a purpose, but are yet incompletely examined in humans. Given the aforementioned reasons, we conducted a clinical study to characterize the impact of clopidogrel and ritonavir on dasabuvir pharmacokinetics and to elaborate the complementary roles of CYP2C8 and CYP3A4 in dasabuvir metabolism (Figure 1). Moreover, our secondary aim was to investigate whether coadministered ritonavir could affect the antiplatelet efficacy of clopidogrel.
Figure 1.

Study design. Twelve healthy individuals ingested as pretreatment either placebo (PLC), or clopidogrel (CLOP; 300 mg on day 3 followed by 75 mg on days 4 and 5 at 8.00 am) for 3 days; or ritonavir (RTV; 100 twice daily at 8.00 am and pm) for 5 days; or both ritonavir for 5 and clopidogrel for 3 days. On day 3 of each phase, the volunteers were administered 250 mg of dasabuvir (DAS) at 9.00 am.
Results
Effect of clopidogrel on dasabuvir pharmacokinetics
Clopidogrel increased the geometric mean AUC0‐∞ of dasabuvir to 467% (90% confidence interval (CI) of geometric mean ratio 323–674%) of that during placebo (Figure 2 , Table 1). The AUC0‐∞ of dasabuvir was increased in all 12 participants (Figure 3). In addition, clopidogrel prolonged the dasabuvir mean t ½ from 8.4 to 15.4 hours (90% CI: 159–213%).
Figure 2.

The effect of ritonavir (100 mg twice daily on days 1–5), clopidogrel (300 mg on day 3, followed by 75 mg on days 4 and 5), and their combination (ritonavir 100 mg twice daily on days 1–5, and clopidogrel 300 mg on day 3 and 75 mg on days 4 and 5) on the plasma concentrations of dasabuvir (a), and its M1 metabolite (b). On day 3 of each of the four phases, including placebo phase, dasabuvir (250 mg) was administered to 12 healthy individuals 1 hour after the morning dose of pretreatment. Data are presented as geometric means with 90% CI. For clarity, some error bars have been omitted. Insets depict the same data on a semilogarithmic scale.
Table 1.
Pharmacokinetic variables of dasabuvir and its M1 metabolite in a four‐phase crossover study in 12 healthy volunteers, who ingested 250 mg of dasabuvir 1 hour after an oral pretreatment dose on study day 3
| Variable | Placebo phase | Clopidogrel phase |
Clopidogrel phase to placebo phase ratio (90% CI); P‐value |
Ritonavir phase | Clopidogrel and ritonavir phase |
Clopidogrel and ritonavir phase to ritonavir phase ratio (90% CI); P‐value |
|---|---|---|---|---|---|---|
| Dasabuvir | ||||||
| C max (ng/mL) | 367 (38) | 597 (51) |
1.63 (1.03–2.57) P = 0.07 |
286 (37) | 521 (51) |
1.82 (1.27–2.61) P = 0.004 |
| t max (h) | 2.5 (2.0–4.0) | 3.5 (2.0–6.0) | P = 0.3 | 4.0 (2.0–6.0) | 3.0 (3.0–6.0) | P > 0.09 |
| t ½ (h) | 8.40 (27) | 15.4 (18) |
1.84 (1.59–2.13) P = 1·10−6 |
8.22 (25) | 11.5 (20) |
1.40 (1.14–1.73) P = 0.005 |
| AUC0‐23h (ng·h/mL) | 2,610 (30) | 8,420 (45) |
3.22 (2.20–4.72) P = 0.00002 |
2,090 (36) | 6,540 (41) |
3.13 (2.17–4.52) P = 0.00002 |
| AUC0‐∞ (ng·h/mL) | 2,980 (33) | 13,900 (42) |
4.67 (3.23–6.74) P = 8·10−7 |
2,370 (38) | 9,250 (43) |
3.89 (2.75–5.51) P = 2·10−6 |
| M1 | ||||||
| C max (U/mL) | 28.6 (44) | 5.83 (81) |
0.20 (0.11–0.36) P = 0.00006 |
24.8 (45) | 5.39 (56) |
0.22 (0.13–0.36) P = 0.00002 |
| t max (h) | 4.0 (2.0–4.0) | 4.0 (3.0–23) | P = 0.2 | 4.0 (3.0–6.0) | 4.0 (3.0–23) | P > 0.09 |
| t ½ (h) | 7.87 (32) | 17.3 (23) |
2.20 (1.72–2.81) P = 0.00001 |
7.35 (25) | 14.1 (18) |
1.92 (1.57–2.34) P = 0.00001 |
| AUC0‐23h (U·h/mL) | 208 (34) | 86 (72) |
0.41 (0.26–0.65) P = 0.001 |
169 (26) | 81 (49) |
0.48 (0.32–0.71) P = 0.002 |
| AUC0‐∞ (U·h/mL) | 230 (32) | 188 (56) |
0.82 (0.55–1.22) P > 0.9 |
187 (24) | 148 (44) |
0.79 (0.56–1.13) P = 0.5 |
| M1:dasabuvir AUC0‐23h ratio | 0.0795 (28) | 0.0102 (42) |
0.13 (0.11–0.15) P = 5·10−12 |
0.0888 (35) | 0.0124 (32) |
0.14 (0.12–0.17) P = 5·10−11 |
| M1:dasabuvir AUC0‐∞ ratio | 0.0774 (29) | 0.0135 (32) |
0.17 (0.16–0.19) P = 2·10−14 |
0.0786 (38) | 0.0160 (26) |
0.20 (0.17–0.25) P = 5·10−10 |
The pretreatment phases were: Placebo (days 3–5), clopidogrel (300 mg on day 3, followed by 75 mg on days 4 and 5), ritonavir (100 mg twice daily on days 1‐5), clopidogrel–ritonavir combination (clopidogrel 300 mg on day 3 and 75 mg on days 4 and 5, and ritonavir 100 mg twice daily on days 1–5).
Data are given as geometric mean with geometric coefficient of variation, except for t max, which is given as median with range. The geometric mean ratios between the two phases are given with 90% confidence intervals. C max, peak plasma concentration; t max, time to C max; t ½, half‐life; AUC, area under the plasma concentration–time curve.
Figure 3.
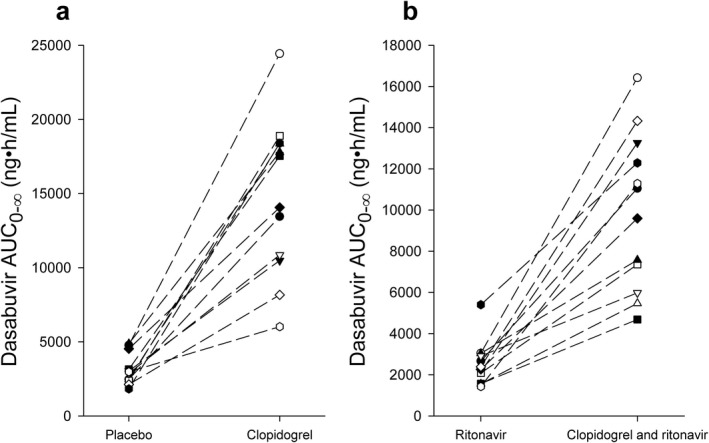
The individual area under the plasma concentration time curve from zero to infinity (AUC0‐∞) of dasabuvir in placebo and clopidogrel phases (a), and in ritonavir and clopidogrel–ritonavir phases (b) in 12 healthy subjects after ingestion of 250 mg of dasabuvir in a crossover study during the four study phases. Dasabuvir (250 mg) was administered on the day 3, 1 hour after the morning pretreatment with placebo, clopidogrel, ritonavir, or clopidogrel–ritonavir.
Clopidogrel decreased the AUC0‐23h of the major M1 metabolite of dasabuvir to 41% (90% CI: 26–65%) of that during placebo phase, whereas no significant change in the AUC0‐∞ was observed (Figure 2 , Table 1). In the clopidogrel phase, the peak plasma concentration (C max) of M1 was decreased to 20% (90% CI: 11–36%) of that in the placebo phase. Furthermore, clopidogrel prolonged the t ½ of M1 from 7.9 to 17.3 hours (90% CI: 172–281%) and decreased the M1:dasabuvir AUC0‐∞ ratio to 17% (90% CI: 16–19%) of that when placebo was administered. Moreover, no correlation between the AUC0‐∞ of clopidogrel acyl‐β‐D‐glucuronide and the fold‐changes in dasabuvir AUC0‐∞ or M1:dasabuvir AUC0‐∞ ratio were observed either with or without ritonavir.
Effect of ritonavir on dasabuvir pharmacokinetics
Ritonavir did not cause significant changes in the pharmacokinetics of dasabuvir or M1, when compared to pretreatment with placebo (Figures 2, 3 , Table 1, Supplemental Table S1). In the ritonavir phase, however, a statistically insignificant trend of lower dasabuvir plasma concentrations was observed when compared with the placebo phase.
Effect of clopidogrel‐ritonavir combination on dasabuvir pharmacokinetics
When clopidogrel and ritonavir were administered concomitantly, the mean AUC0‐∞ of dasabuvir was 389% (90% CI: 275–551%) of that during the ritonavir phase (Figures 2, 3 , Table 1). The C max of dasabuvir was increased to 182% (90% CI: 127–261%), and the t ½ was prolonged from 8.2 to 11.5 hours (90% CI: 114–173%) when compared with the ritonavir phase.
During the clopidogrel–ritonavir phase, the AUC0‐23h of M1 was 48% (90% CI: 32–71%) of that during the ritonavir phase, whereas no statistically significant changes in its AUC0‐∞ were observed (Figure 2 , Table 1). The clopidogrel–ritonavir combination decreased the M1:dasabuvir AUC0‐∞ ratio to 20% (90% CI: 17–25%) of that in the ritonavir phase. Moreover, the C max of M1 was reduced to 22% (90% CI: 13–36%) of that during the ritonavir phase. The clopidogrel–ritonavir combination lengthened the t ½ of M1 from 7.4 to 14.1 hours (90% CI: 157–234%) when compared with ritonavir only.
The effect of ritonavir on clopidogrel pharmacokinetics and platelet aggregation inhibition
Ritonavir decreased the plasma concentrations of the active metabolite of clopidogrel and the platelet inhibitory effect of clopidogrel (Figure 4 , Table 2). In the clopidogrel–ritonavir phase, the C max and AUC0‐4h of clopidogrel active metabolite were 52% (90% CI: 41–65%) and 49% (90% CI: 39–61%) of those in the clopidogrel phase, respectively (Figure 4 , Table 2). The average inhibition of platelet aggregation was decreased from 51% in the clopidogrel phase to 31% in the clopidogrel–ritonavir phase (mean difference 90% CI: –27% to –12%; Figure 4 , Table 2). The maximal platelet inhibition by clopidogrel was also reduced from 60% to 40% during concurrent ritonavir (mean difference 90% CI: –29% to –11%). Combining ritonavir with clopidogrel shortened the t ½ of clopidogrel carboxylic acid and clopidogrel acyl‐β–D‐glucuronide from 3.0 to 2.5 hours (90% CI: 72–95%) and from 2.8 to 2.0 hours (90% CI: 63–81%), respectively. Other pharmacokinetic variables of clopidogrel or its metabolites were not affected by ritonavir.
Figure 4.

The plasma concentrations of clopidogrel (a), clopidogrel active cis‐5‐thiol metabolite (b), clopidogrel carboxylic acid (c), and clopidogrel acyl‐β‐D‐glucuronide (d), and the percent inhibition of platelet aggregation (e) after clopidogrel 300 mg with and without ritonavir 100 mg twice a day initiated 2 days before clopidogrel administration. In addition, the plasma concentrations of ritonavir (f) after the fifth 100 mg ritonavir dose with and without clopidogrel 300 mg in the morning of day 3 are shown. A single oral dose of 250 mg dasabuvir was administered 1 hour after the morning dose of clopidogrel, ritonavir, and their combination. Data are presented as geometric means (except for the mean percent inhibition of platelet aggregation, which are given as arithmetic means) with 90% CI. For clarity, some error bars have been omitted.
Table 2.
Pharmacokinetic variables of clopidogrel, clopidogrel active cis‐5‐thiol metabolite, clopidogrel carboxylic acid, and clopidogrel acyl‐β‐D‐glucuronide, and average platelet inhibition by clopidogrel in 12 healthy volunteers after 300 mg of clopidogrel with and without pretreatment with ritonavir 100 mg twice daily
| Variable | Clopidogrel phase | Clopidogrel and ritonavir phase |
Clopidogrel and ritonavir phase to clopidogrel phase ratio or mean difference (90% CI); P‐value, if significant |
|---|---|---|---|
| Clopidogrel | |||
| C max (ng/mL) | 4.49 (110) | 3.53 (140) | 0.79 (0.40–1.57) |
| t max (h) | 1.5 (0.92–2.0) | 1.5 (0.92–2.0) | |
| t ½ (h) | 1.98 (22) | 1.77 (28) | 0.89 (0.72–1.11) |
| AUC0‐4h (ng·h/mL ) | 8.53 (100) | 6.44 (130) | 0.75 (0.40–1.44) |
| AUC0‐∞ (ng·h/mL) | 10.8 (94) | 8.14 (130) | 0.75 (0.39–1.43) |
| Clopidogrel active metabolite | |||
| C max (ng/mL) | 13.0 (72) | 6.77 (140) | 0.52 (0.41–0.65); P = 0.0003 |
| t max (h) | 0.92 (0.92–1.5) | 0.92 (0.92–1.5) | |
| t ½ (h) | 1.05 (58) | 0.89 (90) | 0.85 (0.66–1.08) |
| AUC0‐4h (ng·h/mL ) | 18.7 (77) | 9.16 (150) | 0.49 (0.39–0.61); P = 0.0001 |
| AUC0‐∞ (ng·h/mL) | 19.3 (79) | 14.9 (170) | 0.77 (0.59–1.00) |
| Clopidogrel active metabolite: clopidogrel AUC0‐∞ ratio | 1.79 (110) | 1.83 (200) | 1.03 (0.53–1.97) |
| Clopidogrel carboxylic acid | |||
| C max (ng/mL) | 12,200 (22) | 12,300 (34) | 1.01 (0.89–1.15) |
| t max (h) | 0.92 (0.92–1.5) | 0.92 (0.92–1.5) | |
| t ½ (h) | 2.98 (21) | 2.46 (12) | 0.83 (0.72–0.95); P = 0.03 |
| AUC0‐4h (ng·h/mL ) | 26,800 (29) | 27,800 (37) | 1.04 (0.91–1.18) |
| AUC0‐∞ (ng·h/mL) | 44,300 (26) | 41,600 (37) | 0.94 (0.80–1.10) |
| Clopidogrel acyl‐β‐D‐glucuronide | |||
| C max (ng/mL) | 1,420 (57) | 1,610 (43) | 1.13 (0.86–1.47) |
| t max (h) | 1.75 (0.92–2.0) | 1.5 (1.5–3.0) | |
| t ½ (h) | 2.83 (19) | 2.02 (8.5) | 0.71 (0.63–0.81); P = 0.0007 |
| AUC0‐4h (ng·h/mL ) | 3,630 (56) | 4,030 (45) | 1.11 (0.86–1.43) |
| AUC0‐∞ (ng·h/mL) | 6,840 (53) | 6,430 (46) | 0.94 (0.71–1.23) |
| Inhibition of platelet aggregation | |||
| Average inhibition at 0‐24 h (%) | 51 (24) | 31 (28) | –20 (–27 to –12); P = 0.0007 |
| Maximal inhibition (%) | 60 (23) | 40 (29) | –20 (–29 to –11); P = 0.002 |
On day 3 of the clopidogrel–ritonavir phase, clopidogrel and the fifth ritonavir dose were ingested simultaneously, 1 hour before dasabuvir 250 mg.
Data are given as geometric mean with geometric coefficient of variation, except for t max and inhibition of platelet aggregation, which are given as median with range, and arithmetic mean with standard deviation, respectively.
Ritonavir
Only minor differences in ritonavir pharmacokinetics were observed between the two ritonavir containing phases (Figure 4, Table S1). During coadministration of clopidogrel, the t ½ of ritonavir was 112% (90% CI: 105–119%) of that in the ritonavir phase, and the time to C max (t max) of ritonavir was longer (median 3.0 hours) than in the ritonavir only phase (median 1.75 hours) (Table S2).
Discussion
CYP2C8 has a major role in the metabolism of dasabuvir,5, 6, 7, 12, 29 while clopidogrel inhibits the metabolism of CYP2C8 substrates.22, 23, 24, 25 Dasabuvir is usually administered as a component of the 3D regimen, which includes ritonavir, a strong inhibitor of CYP3A4, whereas the formation of clopidogrel's active metabolite responsible for the antithrombotic effect is partially CYP3A4‐mediated.20, 30 Accordingly, we administered clopidogrel, ritonavir, their combination, or placebo as pretreatments and a single dose of dasabuvir to 12 healthy volunteers (Figure 1), in order to evaluate the effect of clopidogrel on the pharmacokinetics of dasabuvir and the effect of ritonavir on the pharmacokinetics of clopidogrel and dasabuvir.
The results of our clinical study revealed two clinically important DDIs. First, clopidogrel markedly increased dasabuvir exposure and inhibited the CYP2C8‐mediated formation of the primary M1 metabolite of dasabuvir. In the clopidogrel phase, the geometric mean AUC0‐∞ of dasabuvir was 4.7 times as large as that during the placebo phase, with 6 of the 12 subjects showing more than 5‐fold increase in dasabuvir AUC0‐∞, the highest increase being >10‐fold. The clopidogrel–ritonavir combination increased dasabuvir AUC0‐∞ 3.9‐fold (range about 2–8‐fold), compared to that during the ritonavir phase. Moreover, clopidogrel prolonged the t ½ of dasabuvir and reduced the M1:dasabuvir AUC ratio by more than 80%, consistent with strong CYP2C8 inhibition by clopidogrel. Second, our results showed that ritonavir impairs the bioactivation of clopidogrel to its active cis‐5‐thiol metabolite. In the clopidogrel–ritonavir phase, the C max and AUC0‐4h of clopidogrel active metabolite were only 52% and 49% of those during the clopidogrel phase, respectively. As a consequence, the inhibition of platelet aggregation by clopidogrel was markedly decreased by ritonavir.
A recent physiologically based pharmacokinetic (PBPK) modeling study predicted that clopidogrel would increase dasabuvir AUC 1.9–2.8‐fold, which would imply a reduction in dasabuvir clearance of 47–64% only and a DDI of limited clinical importance, and suggested that clopidogrel is only a moderate CYP2C8 inhibitor.9 The PBPK model included a large adjustment of the inhibitory constant of clopidogrel for OATP1B1, so that OATP1B1 inhibition by clopidogrel has a role in the clopidogrel–repaglinide DDI.9 In humans, however, clopidogrel has not affected the pharmacokinetics of OATP1B1 and CYP3A4/OATP1B1 substrates pitavastatin and simvastatin, respectively24, 27; and of note, dasabuvir is not an OATP1B1 substrate.3 Moreover, the report's primary PBPK model incorporated a markedly lower unbound hepatocyte‐to‐plasma concentration ratio of clopidogrel acyl‐β‐D‐glucuronide than that used in previous models.9, 22 Because the formation of acyl‐β‐D‐glucuronide metabolite of clopidogrel takes place in close proximity to CYP2C8 within the endoplasmic reticulum in hepatocytes, no active hepatic uptake is required to achieve higher acyl‐β‐D‐glucuronide concentrations at the CYP2C8 site than in plasma.16 The authors of the PBPK study hypothesized that the weak induction of CYP2C8 by ritonavir would decrease the impact of clopidogrel on dasabuvir pharmacokinetics.9 As a result of a multidisciplinary review of the possible interaction between clopidogrel and dasabuvir, mainly based on the PBPK modeling predictions,9 the US Food and Drug Administration (FDA) concluded that no changes to the prescribing information of dasabuvir are warranted, i.e., a contraindication for clopidogrel–dasabuvir combination was not added.26 Our current clinical results indicate, however, that clopidogrel increases dasabuvir exposure more than what the PBPK model by Shebley et al. predicted.9 These results highlight the challenges related to PBPK modeling of complex DDIs, especially when mechanisms are not fully understood and rich clinical data are unavailable.
As dasabuvir is routinely ingested with ritonavir, comparing the effect of the clopidogrel–ritonavir combination on dasabuvir pharmacokinetics to that of ritonavir alone is the clinically most relevant scenario. In this comparison, dasabuvir C max was raised >2‐fold in four individuals, with the highest increase being 3.8‐fold, and it is possible that at steady state during administration of dasabuvir twice daily, the increases in dasabuvir C max are even greater. According to the manufacturer, supratherapeutic dasabuvir exposures are associated with hemoglobin decrease and potential to prolong the QTc interval.3, 10 As opposed to healthy subjects, patients may have additional risk factors for QTc prolongation, such as electrolyte imbalances, polypharmacy, and multiple medical conditions. Consequently, although ritonavir may slightly attenuate the effect of clopidogrel on dasabuvir during long‐term treatment,9 caution is recommended when clopidogrel is combined with the 3D regimen, especially in patients predisposed to prolongation of the QTc interval.
There is a shortage of selective and sensitive CYP2C8 model substrates. The strongest known CYP2C8 inhibitor, gemfibrozil, has increased the AUCs of the CYP2C8 substrates pioglitazone, montelukast, and repaglinide about 3‐, 4.5‐, and 8‐fold, respectively.31, 32, 33 Pioglitazone's limited sensitivity for CYP2C8 inhibition makes it a suboptimal CYP2C8 probe substrate,34 as do the additional disposition mechanisms of montelukast (UGT1A3‐mediated metabolism and possible transporter‐mediated hepatic uptake),35, 36 and repaglinide (OATP1B1‐mediated hepatic uptake, and biotransformation by CYP3A4).34 In the presence of the CYP3A4 inhibitor ritonavir, the fraction of dasabuvir metabolized by CYP2C8 is suggested to be >0.9, since gemfibrozil has increased the AUC of dasabuvir 11‐fold during ritonavir coadministration.6, 9, 12 However, the effect of gemfibrozil on dasabuvir has not been studied in the absence of ritonavir. In the present study, the CYP2C8 inhibitor clopidogrel increased the AUC of dasabuvir slightly more without ritonavir (4.7‐fold) than in the presence of ritonavir (3.9‐fold) and reduced the M1:dasabuvir ratio by at least 80% both with and without ritonavir. Thus, our results imply that the contribution of CYP2C8 to dasabuvir metabolism is at least of the same magnitude without ritonavir as with ritonavir coadministration, likely to exceed 80% in both situations. Therefore, dasabuvir could be a sensitive CYP2C8 model substrate for DDI studies, when used without concurrently administered ritonavir. However, only low dasabuvir doses should be used to guarantee the safety of volunteers. Additionally, we observed a statistically insignificant trend of lower dasabuvir concentrations (–20%) in the ritonavir phase than in the placebo phase, which could suggest a weak CYP2C8 induction by ritonavir or other mechanism leading to reduced dasabuvir exposure.9 As a limitation of the present study, however, the potential increase in dasabuvir hepatic intrinsic clearance by ritonavir had probably not reached full steady state by the third ritonavir pretreatment day when dasabuvir was administered.
The current study also corroborates the strong CYP2C8 inhibitory properties of clopidogrel, as it augmented dasabuvir AUC about 5‐fold on average. Moreover, the M1:dasabuvir AUC ratios were decreased by >80% by clopidogrel, indicating strong inhibition of the formation of M1. As the metabolism of dasabuvir is not entirely CYP2C8‐mediated, clopidogrel would very likely increase the AUC of a hypothetical and completely CYP2C8‐selective substrate by >5‐fold. Given these findings, the recent classification of clopidogrel as a strong CYP2C8 inhibitor in the FDA Draft Guidance for Clinical Drug Interaction Studies seems to be justified.37 This should be taken into account when clopidogrel is used in patient groups that are at risk for polypharmacy with CYP2C8 substrates.
In previous studies, the CYP3A4 inhibitors grapefruit juice and ketoconazole have impaired the antiplatelet effects of clopidogrel and decreased the AUC of its active cis‐5‐thiol metabolite by 86% and 22–29%, respectively.20, 38 In addition to being a strong CYP3A4 inhibitor, however, ritonavir also acts as weak CYP2D6 inhibitor and CYP inducer.39, 40 Because several enzymes, e.g., CYP2C19, CYP2B6, and CYP3A4 mediate the bioactivation of clopidogrel,41 the net effect of ritonavir on clopidogrel pharmacokinetics was not obvious before the current study. The observed substantially impaired inhibition of platelet aggregation by clopidogrel and the ∼50% decreased C max and AUC0‐4h of its active metabolite suggest that ritonavir can markedly decrease the antithrombotic efficacy of clopidogrel. In line with our findings, Marsousi et al. very recently (after the submission of our study) reported a 3.2‐fold lower exposure to clopidogrel active metabolite and diminished platelet inhibition in HIV‐infected patients using long‐term ritonavir boosted antiretroviral therapies when compared with healthy controls.42 None of these eight patients on ritonavir were using other medications known to significantly magnify the impact of ritonavir on the antiplatelet effect and pharmacokinetics of clopidogrel.42 Moreover, also one case report described diminished clopidogrel response due to ritonavir in a patient using clopidogrel, ritonavir, and isoniazid concomitantly.43 This interaction may be particularly relevant in individuals with reduced CYP2C19 activity, since in our study, clopidogrel active metabolite concentrations were very low and platelet inhibition weak in CYP2C19*2 carriers during ritonavir treatment (Figure S1).
In conclusion, clinical doses of clopidogrel greatly increase the exposure to dasabuvir and inhibit the CYP2C8‐mediated formation of the major dasabuvir metabolite, M1. The observed effect was similar in both relevant perpetrator drug comparisons: clopidogrel vs. placebo, and clopidogrel‐ritonavir combination vs. ritonavir. In addition, ritonavir significantly diminished the antiplatelet effect of clopidogrel, which likely increases the risk for atherothrombotic events if the two drugs are used concurrently. Because of the dual clopidogrel–dasabuvir and ritonavir–clopidogrel interactions, which both may have harmful consequences, it is advisable to avoid concomitant administration of clopidogrel with dasabuvir–ritonavir‐containing regimens, such as the 3D protocol. Furthermore, our findings confirm that dasabuvir could be applicable as a CYP2C8 probe substrate for DDI studies.11
Methods
Subjects and study design
Twelve healthy nonsmoking volunteers (six women, six men; age range, 20–33 years; body mass index range, 19.4–26.6 kg/m2) participated in the study after giving written informed consent. Their health was confirmed by medical history, clinical examination, electrocardiography, and routine laboratory tests before entering the study. All participants had normal blood platelet counts and hemoglobin values. None of the subjects used oral contraceptives or other continuous medication.
The study protocol was approved by the Coordinating Ethics Committee of the Helsinki and Uusimaa Hospital District (record number 66/13/03/00/2016), and the Finnish Medicines Agency Fimea (EudraCT number 2016‐000149‐30). A randomized, placebo‐controlled, four‐phase crossover study was conducted with a washout period of 3 weeks between the days of dasabuvir administration. The subjects ingested as pretreatment either placebo (Placebo tablets, University Pharmacy, Helsinki, Finland), or clopidogrel (300 mg on day 3 followed by 75 mg on days 4 and 5 at 8.00 am; Plavix, Sanofi‐Aventis, Paris, France) for 3 days; or ritonavir (100 twice daily at 8.00 am and pm; Norvir, AbbVie, Ludwigshafen am Rhein, Germany) for 5 days; or both ritonavir for 5 and clopidogrel for 3 days. On day 3, 250 mg dasabuvir (Exviera 250 mg tablet, AbbVie) was administered at 9.00 am (Figure 1). On the days of dasabuvir ingestion, the volunteers had fasted overnight, and a standard warm meal was served 3 hours, and snacks 7 and 9 hours after the administration of dasabuvir. The subjects were not allowed to use grapefruit products 1 week before and during the study. Use of other drugs or omega‐3 fatty acid dietary supplements was not permitted from 1 week before to 1 week after the study. Use of alcohol was prohibited the day before and on the days of dasabuvir administration.
Sampling
Timed blood samples were drawn from a cannulated forearm vein, or by venipuncture before the administration of pretreatment, and 5 minutes before and 0.5, 1, 2, 3, 4, 6, 9, 23, 47, and 71 hours after the dasabuvir ingestion. The blood samples were collected into ethylenediaminetetraacetic acid (EDTA)‐containing tubes, which were placed on ice immediately after sampling. Plasma was separated within 30 minutes and stored at –70°C until analysis. The samples for the determination of clopidogrel and its metabolites were treated with 2‐bromo‐3′‐methoxyacetophenone within 30 seconds of blood sample collection in whole blood EDTA samples, in order to derivatize the active metabolite of clopidogrel (excluding the samples taken before the administration of pretreatment, and 23, 47, and 71 hours after dasabuvir ingestion), as previously described.27
Determination of drug concentrations
All measurements were carried out using a Nexera X2 UPLC system (Shimadzu, Kyoto, Japan) coupled to a 5500 Qtrap mass spectrometer interfaced with an electrospray ion source (ABSciex, Toronto, Ontario, Canada). For the plasma dasabuvir, dasabuvir M1 and ritonavir, the samples were pretreated using a Phree phospholipid removal plate (Phenomenex, Torrance, CA) according to the manufacturer's instructions. The analytes were separated on a Luna Omega C18 column (1.6 μm particle size, 2.1·100 mm internal diameter; Phenomenex) using a gradient elution with a mobile phase consisting of 0.1% formic acid and acetonitrile. The mobile phase gradient was a linear increase of acetonitrile from 30% to 90% over 6 minutes, followed by an equilibration step back to the starting composition. The flow rate and the column temperature were maintained at 250 μL/min and 30°C, and an aliquot of 3 μL was injected into the system. Deuterium‐labeled ritonavir served as an internal standard for all analytes. The mass spectrometer was operated in a positive polarity mode and the targeted ion transitions (m/z) were 494 to 359 for dasabuvir, 510 to 412 for dasabuvir M1, and 721 to 140 for ritonavir. The quantification limits for dasabuvir and ritonavir were 0.8 ng/mL and 5.0 ng/mL. A signal‐to‐noise ratio (S/N) of 10:1 was used as a limit of detection for dasabuvir M1, and the quantities were given in arbitrary units (U/mL) relative to the ratio of the peak height of the dasabuvir M1 to that of the internal standard. The linear detector response (r > 0.995) of dasabuvir M1 was confirmed by a 1,000‐fold serial dilution of the authentic sample extracts with a high metabolite content. The day‐to‐day coefficients of variation (CV) were 9.4% (2.0 ng/mL), 7.3% (200 ng/mL), and 3.5% (2,000 ng/mL) for dasabuvir, and 8.7% (500 ng/mL) and 5.2% (5,000 ng/mL) for ritonavir.
The determination of plasma clopidogrel and its metabolites were performed as previously described.27 The quantification limits were 0.05 ng/mL for clopidogrel and clopidogrel active cis‐5‐thiol metabolite, and 100 ng/mL for clopidogrel carboxylic acid and clopidogrel acyl‐β‐D‐glucuronide. The day‐to‐day precision values for all compounds were below 15% (expressed as CV%) and accuracy within ± 15%, except for the lower limit of quantification, for which both precision and accuracy were within ±20%.
Platelet function testing
The antiplatelet activity of clopidogrel was tested in all 12 participants with a turbidimetric optical detection system (VerifyNow P2Y12, Accumetrics, San Diego, CA) in citrate anticoagulated whole‐blood samples collected at just before, and 55 minutes, 2, 4, 10, and 24 hours after clopidogrel dosing.44, 45 The average inhibition values were calculated by dividing the area under the effect vs. time curve from time 0 to 24 hours by the corresponding time interval.
Pharmacokinetics
The C max, t max, AUC0‐23h, AUC0‐∞, and t ½ were calculated for dasabuvir and its M1 metabolite by standard noncompartmental methods using Phoenix WinNonlin, v. 6.4 (Certara, Princeton, NJ). The same pharmacokinetic parameters were calculated for ritonavir and clopidogrel, but instead of AUC0‐23h, AUC0‐10h was calculated for ritonavir, and AUC0‐4h for clopidogrel and its metabolites.
Genotyping
The genotyping methods and data are presented in the Supplementary Methods and Results.
Statistical analysis
Based on the pharmacokinetic results of previous drug interaction studies, 12 subjects were estimated to be adequate to detect a 30% change in the AUC of dasabuvir between the placebo, clopidogrel, ritonavir, and clopidogrel/ritonavir phases, with a power of at least 80% (α level 5%). The results are expressed as geometric means and geometric mean ratios with geometric CV or 90% CIs unless stated otherwise. Logarithmic transformation was used for pharmacokinetic variables, except t max, before statistical analysis. The pharmacokinetic variables were compared by repeated‐measures analysis of variance with treatment phase as a within‐subjects factor, with pairwise comparisons with the Fisher's least significant difference method. Due to the six pairwise comparisons in the pharmacokinetic parameters of dasabuvir, Bonferroni correction was applied. The t max data were compared using the Wilcoxon signed rank test. Correlations between the AUC0‐∞ of clopidogrel acyl‐β‐D‐glucuronide, and the fold‐increases in dasabuvir AUC0‐∞ and M1:dasabuvir AUC0‐∞ ratio were quantified as Kendall's correlation coefficients and tested using Kendall's test. P‐values below 0.05 were considered statistically significant. Statistical analyses were performed using SPSS Statistics for Windows v. 22.0 (IBM, Armonk, NY).
Funding
The study was supported by grants from the Academy of Finland (Grant decision 278123, 2014), and by State funding for university‐level health research (Hospital District of Helsinki and Uusimaa, Finland).
Conflict of interest
The authors declare no competing interests for this work.
Author contributions
M.K.I., A.T., O.L.‐R., Mikko Neuvonen, P.J.N., Mikko Niemi, and J.T.B. wrote the article; M.K.I., A.T., O.L.‐R., Mikko Neuvonen, P.J.N., Mikko Niemi, and J.T.B. designed the research; M.K.I., A.T., O.L.‐R., Mikko Neuvonen, P.J.N., Mikko Niemi, and J.T.B. performed the research; M.K.I., A.T., O.L.‐R., Mikko Neuvonen, P.J.N., Mikko Niemi, and J.T.B. analyzed the data.
Supporting information
Acknowledgments
The authors thank Eija Mäkinen‐Pulli and Lisbet Partanen for skillful technical assistance.
References
- 1. Messina, J.P. , et al Global distribution and prevalence of hepatitis C virus genotypes. Hepatology 61, 77–87 (2015). [DOI] [PMC free article] [PubMed] [Google Scholar]
- 2. Deeks, E.D. Ombitasvir/paritaprevir/ritonavir plus dasabuvir: a review in chronic HCV genotype 1 infection. Drugs 75, 1027–1038 (2015). [DOI] [PubMed] [Google Scholar]
- 3. US Food and Drug Administration. Center for Drug Evaluation and Research . Clinical pharmacology and biopharmaceutics review(s) for Viekira Pak. <http://www.accessdata.fda.gov/drugsatfda_docs/nda/2014/206619Orig1s000ClinPharmR.pdf> (2014). Accessed 15 January 2018.
- 4. Khatri, A. , Trinh, R. , Zhao, W. , Podsadecki, T. & Menon, R. Drug‐drug interaction between the direct‐acting antiviral regimen of ombitasvir‐paritaprevir‐ritonavir plus dasabuvir and the HIV antiretroviral agent dolutegravir or abacavir plus lamivudine. Antimicrob. Agents Chemother. 60, 6244–6251 (2016). [DOI] [PMC free article] [PubMed] [Google Scholar]
- 5. Polepally, A.R. , et al Drug‐drug interactions between the anti‐hepatitis C virus 3D regimen of ombitasvir, paritaprevir/ritonavir, and dasabuvir and eight commonly used medications in healthy volunteers. Clin. Pharmacokinet. 55, 1003–1014 (2016). [DOI] [PMC free article] [PubMed] [Google Scholar]
- 6. Menon, R.M. , et al Drug‐drug interaction profile of the all‐oral anti‐hepatitis C virus regimen of paritaprevir/ritonavir, ombitasvir, and dasabuvir. J. Hepatol. 63, 20–29 (2015). [DOI] [PubMed] [Google Scholar]
- 7. Shen, J. , et al Metabolism and disposition of hepatitis C polymerase inhibitor dasabuvir in humans. Drug Metab. Dispos. 44, 1139–1147 (2016). [DOI] [PubMed] [Google Scholar]
- 8. Shebley, M. , et al Mechanisms and predictions of drug‐drug interactions of the hepatitis C virus three direct‐acting antiviral regimen: Paritaprevir/ritonavir, ombitasvir, and dasabuvir. Drug Metab. Dispos. 45, 755–764 (2017). [DOI] [PubMed] [Google Scholar]
- 9. Shebley, M. , Fu, W. , Badri, P. , Bow, D. & Fischer, V. Physiologically based pharmacokinetic modeling suggests limited drug‐drug interaction between clopidogrel and dasabuvir. Clin. Pharmacol. Ther. 102, 679–687 (2017). [DOI] [PMC free article] [PubMed] [Google Scholar]
- 10. US Food and Drug Administration . Prescribing highlights for Viekira Pak. <https://www.accessdata.fda.gov/drugsatfda_docs/label/2014/206619lbl.pdf> (2014). Accessed 15 January 2018.
- 11. Backman, J.T. , Filppula, A.M. , Niemi, M. & Neuvonen, P.J. Role of cytochrome P450 2C8 in drug metabolism and interactions. Pharmacol. Rev. 68, 168–241 (2016). [DOI] [PubMed] [Google Scholar]
- 12. King, J.R. , Zha, J. , Khatri, A. , Dutta, S. & Menon, R.M. Clinical pharmacokinetics of dasabuvir. Clin. Pharmacokinet. 56, 1115–1124 (2017). [DOI] [PubMed] [Google Scholar]
- 13. Tang, M. , et al Antiplatelet agents aspirin and clopidogrel are hydrolyzed by distinct carboxylesterases, and clopidogrel is transesterificated in the presence of ethyl alcohol. J. Pharmacol. Exp. Ther. 319, 1467–1476 (2006). [DOI] [PubMed] [Google Scholar]
- 14. Tarkiainen, E.K. , et al Carboxylesterase 1 c.428G>A single nucleotide variation increases the antiplatelet effects of clopidogrel by reducing its hydrolysis in humans. Clin. Pharmacol. Ther. 97, 650–658 (2015). [DOI] [PubMed] [Google Scholar]
- 15. Hagihara, K. , et al A possible mechanism for the differences in efficiency and variability of active metabolite formation from thienopyridine antiplatelet agents, prasugrel and clopidogrel. Drug Metab. Dispos. 37, 2145–2152 (2009). [DOI] [PubMed] [Google Scholar]
- 16. Kahma, H. , et al Clopidogrel carboxylic acid glucuronidation is mediated mainly by UGT2B7, UGT2B4, and UGT2B17: implications for pharmacogenetics and drug‐drug interactions. Drug Metab. Dispos. 46, 141–150 (2018). [DOI] [PubMed] [Google Scholar]
- 17. Ji, J.Z. , et al Human UGT2B7 is the major isoform responsible for the glucuronidation of clopidogrel carboxylate. Biopharm. Drug Dispos. 39, 88–89 (2018). [DOI] [PubMed] [Google Scholar]
- 18. Simon, T. , et al Genetic determinants of response to clopidogrel and cardiovascular events. N. Engl. J. Med. 360, 363–375 (2009). [DOI] [PubMed] [Google Scholar]
- 19. Gilard, M. , et al Influence of omeprazole on the antiplatelet action of clopidogrel associated with aspirin: the randomized, double‐blind OCLA (Omeprazole CLopidogrel Aspirin) study. J. Am. Coll. Cardiol. 51, 256–260 (2008). [DOI] [PubMed] [Google Scholar]
- 20. Holmberg, M.T. , Tornio, A. , Neuvonen, M. , Neuvonen, P.J. , Backman, J.T. & Niemi, M. Grapefruit juice inhibits the metabolic activation of clopidogrel. Clin. Pharmacol. Ther. 95, 307–313 (2014). [DOI] [PubMed] [Google Scholar]
- 21. Brayer, S.W. & Reddy, K.R. Ritonavir‐boosted protease inhibitor based therapy: a new strategy in chronic hepatitis C therapy. Expert Rev. Gastroenterol. Hepatol. 9, 547–558 (2015). [DOI] [PubMed] [Google Scholar]
- 22. Tornio, A. , et al Glucuronidation converts clopidogrel to a strong time‐dependent inhibitor of CYP2C8: a phase II metabolite as a perpetrator of drug‐drug interactions. Clin. Pharmacol. Ther. 96, 498–507 (2014). [DOI] [PubMed] [Google Scholar]
- 23. Itkonen, M.K. , Tornio, A. , Neuvonen, M. , Neuvonen, P.J. , Niemi, M. & Backman, J.T. Clopidogrel markedly increases plasma concentrations of CYP2C8 substrate pioglitazone. Drug Metab. Dispos. 44, 1364–1371 (2016). [DOI] [PubMed] [Google Scholar]
- 24. Kim, S.J. , et al Clarification of the mechanism of clopidogrel‐mediated drug‐drug interaction in a clinical cassette small‐dose study and its prediction based on in vitro information. Drug Metab. Dispos. 44, 1622–1632 (2016). [DOI] [PubMed] [Google Scholar]
- 25. Itkonen, M.K. , et al Clopidogrel but not prasugrel significantly inhibits the CYP2C8‐mediated metabolism of montelukast in humans. Clin. Pharmacol. Ther. doi: 10.1002/cpt.947 (2017) [Epub ahead of print]. [DOI] [PMC free article] [PubMed] [Google Scholar]
- 26. Arya, V. , Zhao, P. , Reynolds, K.S. , Mishra, P. & Younis, I.R. Utilizing PBPK modeling to evaluate the potential of a significant drug‐drug interaction between clopidogrel and dasabuvir: A scientific perspective. Clin. Pharmacol. Ther. 102, 578–580 (2017). [DOI] [PubMed] [Google Scholar]
- 27. Itkonen, M.K. , Tornio, A. , Neuvonen, M. , Neuvonen, P.J. , Niemi, M. & Backman, J.T. Clopidogrel has no clinically meaningful effect on the pharmacokinetics of the organic anion transporting polypeptide 1B1 and cytochrome P450 3A4 substrate simvastatin. Drug Metab. Dispos. 43, 1655–1660 (2015). [DOI] [PubMed] [Google Scholar]
- 28. Stark, J.E. Potential for a significant interaction between clopidogrel and dasabuvir. Clin. Infect. Dis. 61, 134–135 (2015). [DOI] [PubMed] [Google Scholar]
- 29. Klibanov, O.M. , Gale, S.E. & Santevecchi, B. Ombitasvir/paritaprevir/ritonavir and dasabuvir tablets for hepatitis C virus genotype 1 infection. Ann. Pharmacother. 49, 566–581 (2015). [DOI] [PubMed] [Google Scholar]
- 30. Jiang, X.L. , Samant, S. , Lesko, L.J. & Schmidt, S. Clinical pharmacokinetics and pharmacodynamics of clopidogrel. Clin. Pharmacokinet. 54, 147–166 (2015). [DOI] [PMC free article] [PubMed] [Google Scholar]
- 31. Niemi, M. , Backman, J.T. , Neuvonen, M. & Neuvonen, P.J. Effects of gemfibrozil, itraconazole, and their combination on the pharmacokinetics and pharmacodynamics of repaglinide: potentially hazardous interaction between gemfibrozil and repaglinide. Diabetologia 46, 347–351 (2003). [DOI] [PubMed] [Google Scholar]
- 32. Karonen, T. , Filppula, A. , Laitila, J. , Niemi, M. , Neuvonen, P.J. & Backman, J.T. Gemfibrozil markedly increases the plasma concentrations of montelukast: a previously unrecognized role for CYP2C8 in the metabolism of montelukast. Clin. Pharmacol. Ther. 88, 223–230 (2010). [DOI] [PubMed] [Google Scholar]
- 33. Jaakkola, T. , Backman, J.T. , Neuvonen, M. & Neuvonen, P.J. Effects of gemfibrozil, itraconazole, and their combination on the pharmacokinetics of pioglitazone. Clin. Pharmacol. Ther. 77, 404–414 (2005). [DOI] [PubMed] [Google Scholar]
- 34. Tornio, A. , Niemi, M. , Neuvonen, P.J. & Backman, J.T. Drug interactions with oral antidiabetic agents: pharmacokinetic mechanisms and clinical implications. Trends Pharmacol. Sci. 33, 312–322 (2012). [DOI] [PubMed] [Google Scholar]
- 35. Hirvensalo, P. , et al Comprehensive pharmacogenomic study reveals an important role of UGT1A3 in montelukast pharmacokinetics. Clin. Pharmacol. Ther. doi: 10.1002/cpt.891 (2017) [Epub ahead of print]. [DOI] [PMC free article] [PubMed] [Google Scholar]
- 36. Varma, M.V. , et al Transporter‐mediated hepatic uptake plays an important role in the pharmacokinetics and drug‐drug interactions of montelukast. Clin. Pharmacol. Ther. 101, 406–415 (2017). [DOI] [PubMed] [Google Scholar]
- 37. US Food and Drug Administration. Center for Drug Evaluation and Research . Clinical Drug Interaction Studies — Study Design, Data Analysis, and Clinical Implications Guidance for Industry. <https://www.fda.gov/downloads/drugs/guidances/ucm292362.pdf> (2017). Accessed 15 January 2018.
- 38. Farid, N.A. , et al Cytochrome P450 3A inhibition by ketoconazole affects prasugrel and clopidogrel pharmacokinetics and pharmacodynamics differently. Clin. Pharmacol. Ther. 81, 735–741 (2007). [DOI] [PubMed] [Google Scholar]
- 39. Kirby, B.J. , Collier, A.C. , Kharasch, E.D. , Whittington, D. , Thummel, K.E. & Unadkat, J.D. Complex drug interactions of HIV protease inhibitors 1: inactivation, induction, and inhibition of cytochrome P450 3A by ritonavir or nelfinavir. Drug Metab. Dispos. 39, 1070–1078 (2011). [DOI] [PMC free article] [PubMed] [Google Scholar]
- 40. Aarnoutse, R.E. , et al Effect of low‐dose ritonavir (100 mg twice daily) on the activity of cytochrome P450 2D6 in healthy volunteers. Clin. Pharmacol. Ther. 78, 664–674 (2005). [DOI] [PubMed] [Google Scholar]
- 41. Kazui, M. , et al Identification of the human cytochrome P450 enzymes involved in the two oxidative steps in the bioactivation of clopidogrel to its pharmacologically active metabolite. Drug Metab. Dispos. 38, 92–99 (2010). [DOI] [PubMed] [Google Scholar]
- 42. Marsousi, N. , et al Impact of boosted antiretroviral therapy on the pharmacokinetics and efficacy of clopidogrel and prasugrel active metabolites. Clin. Pharmacokinet. doi: 10.1007/s40262-018-0637-6 (2018) [Epub ahead of print]. [DOI] [PubMed] [Google Scholar]
- 43. Metzger, N.L. & Momary, K.M. A patient with HIV and tuberculosis with diminished clopidogrel response. Int. J. Std. AIDS 25, 532–534 (2014). [DOI] [PubMed] [Google Scholar]
- 44. Lordkipanidze, M. , Pharand, C. , Nguyen, T.A. , Schampaert, E. & Diodati, J.G. Assessment of VerifyNow P2Y12 assay accuracy in evaluating clopidogrel‐induced platelet inhibition. Ther. Drug Monit. 30, 372–378 (2008). [DOI] [PubMed] [Google Scholar]
- 45. Jeong, Y.H. , Bliden, K.P. , Antonino, M.J. , Park, K.S. , Tantry, U.S. & Gurbel, P.A. Usefulness of the VerifyNow P2Y12 assay to evaluate the antiplatelet effects of ticagrelor and clopidogrel therapies. Am. Heart J. 164, 35–42 (2012). [DOI] [PubMed] [Google Scholar]
Associated Data
This section collects any data citations, data availability statements, or supplementary materials included in this article.
Supplementary Materials