

Abstract
High‐throughput imaging with single‐cell resolution has enabled remarkable discoveries in cell physiology and Systems Biology investigations. A common, and often the most challenging step in all such imaging implementations, is the ability to segment multiple images to regions that correspond to individual cells. Here, a robust segmentation strategy for microbial cells using Quantitative Phase Imaging is reported. The proposed method enables a greater than 99% yeast cell segmentation success rate, without any computationally‐intensive, post‐acquisition processing. We also detail how the method can be expanded to bacterial cell segmentation with 98% success rates with substantially reduced processing requirements in comparison to existing methods. We attribute this improved performance to the remarkably uniform background, elimination of cell‐to‐cell and intracellular optical artifacts, and enhanced signal‐to‐background ratio—all innate properties of imaging in the optical‐phase domain. © 2017 The Authors. Cytometry Part A published by Wiley Periodicals, Inc. on behalf of International Society for Advancement of Cytometry.
Keywords: label free, image cytometry, segmentation, single‐cell
Introduction
A plethora of biological research efforts now rely on imaging to unmask the underlying molecular‐level mechanisms of cell function 1, 2. Critically, such approaches operate with single cell resolution, thus offering two distinct advantages in comparison to conventional population‐based implementations 3, 4, 5, 6, 7. The first is the ability to map the spatiotemporal organization of organelles 8, 9 and molecular level events (10,11), thus uniquely linking intracellular architecture to function. The second is the capability to unravel the intrinsic phenotypic variability in a cell population, an innate phenomenon 12, 13, 14, 15 even under steady‐state conditions 16.
Aided primarily by the advent of cost‐effective and accessible information technologies, biological imaging has now entered the high‐throughput (and “big‐data”) arena. To this end, imaging can be automated to acquire 3D information of individual cells at multiple wavelengths, locations, and time‐points 17, 18. While such automated imaging, frequently referred to as image cytometry and high‐content screening 19, 20, 21, 22, 23, 24, does not enable cell sorting, it does exhibit unique capabilities with respect to conventional flow cytometry 25, 26, 27. Briefly, these capabilities pertain to the possibility of dynamically tracking individual cells, increased sensitivity, as well as the power to normalize the phenotypic content to cell size 28, 29, 30, 31.
A common need in all automated imaging, often considered as the “cornerstone” and most challenging step in the analysis of image cytometry data, is the ability to detect and outline the contour of individual cells. This process is also referred to as “cell‐segmentation,” namely the grouping of pixels that belong to the same cell 32. While segmentation is conceptually simple, it lacks generality and, therefore, cannot be reliably and effortlessly implemented in all cell lines, imaging modalities, and cell densities with no post‐acquisition processing 28. The absence of such a universal segmentation procedure is not surprising given the enormous intracellular, cell‐to‐cell, and cell type to cell type light intensity variability across the field‐of‐view (FOV) of fluorescent and bright‐field transmission images. In fluorescence microscopy, stain localization can be unpredictable and highly variable between cells (see Fig. 1a), while phototoxic and photobleaching effects can further undermine the segmentation process—especially during long‐term imaging experiments. Similarly, bright‐field transmission imaging, including phase‐contrast (PC) and differential interference contrast (DIC), can also suffer from variable light scattering coefficients between cells, and within cells due to variable cytosolic and wall/membrane densities (see Fig. 1b).
Figure 1.
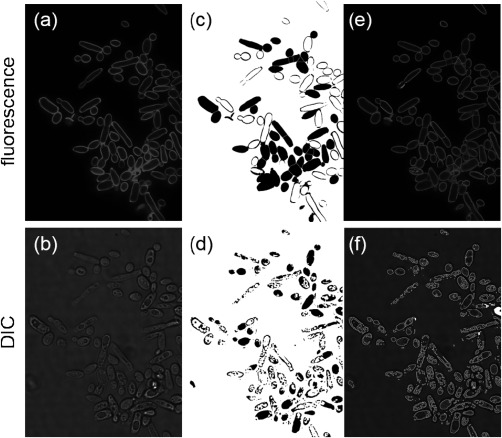
Segmentation of individual yeast cells, using either fluorescence via a cell‐wall specific stain shown in (a), or Differential Interference Contrast (DIC) shown in (b). Both types of images were analyzed via max‐entropy thresholding and watershed algorithms (ImageJ)—shown in (c) and (d) for fluorescence and DIC respectively. Subsequently the computed regions of interest (ROI) were overlaid with the original images—shown in (e) and (f). While fluorescence exhibits a higher success rate (52%), both imaging modalities fail to properly segment all cells, evidencing the need for further image processing.
To overcome the cell‐to‐cell and intracellular intensity variability, several approaches have been reported, including implementations both during and after image acquisition. The former—hardware—based implementations typically pertain to acquiring multiple images at different focus levels, followed by 2D projection to generate enhanced contrast between the cell and the background 33, 34, 35. The latter—software—based implementations rely on sophisticated processing algorithms that are applied post‐image acquisition. These go beyond the basic, and least computationally intensive intensity thresholding, to more advanced procedures based on feature detection, region accumulation, and morphological filtering to name a few 32. To this end, various freely‐available software tools have been developed to aid users in cell segmentation 28, 36, 37, 38, 39, 40, 41.
Despite such remarkable progress, however, each of the aforementioned segmentation implementations typically operate optimally in a limited range of experimental conditions, such as specific cell types, growth conditions, cell densities, and imaging modalities. This limitation poses a significant challenge, as data acquisition and analysis fine‐tuning are essential for procedures that go beyond optimized experimental conditions. In turn, this necessity impedes the throughput, and scaling‐up of many biological procedures 1.
To address this shortcoming, we report an optical‐phase thresholding strategy for cell segmentation using Quantitative Phase Imaging (QPI), an inherently label‐free technique. By detecting the phase of the transmitted wavefront at the image plane rather than its intensity (Fig. 2), we identified a substantially more sensitive metric for localizing the cell contour, with minimal dependence on the cell‐to‐cell and intracellular signal variability. This approach enabled a 99% segmentation success rate in Saccharomyces cerevisiae yeast cells at various optical magnifications, with no further post‐processing other than the classical thresholding and watershed algorithms. Furthermore, by implementing a frequency domain band‐pass filtering, a 98% segmentation success rate was achieved for Escherichia coli bacteria.
Figure 2.
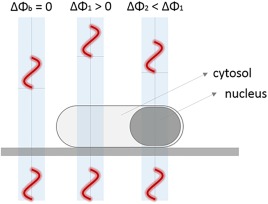
Schematic illustration of the optical‐phase thresholding implementation for segmenting individual microbial cells. The transmitted wavefront exhibits variable phase delays with the background being zero (ΔΦ b), contrary to the non‐zero phase delay induced by the cell cytosol and intracellular organelles (ΔΦ 1, ΔΦ 2). [Color figure can be viewed at wileyonlinelibrary.com]
Methods
Microscopy
Microscopy was performed using a quantitative phase imaging system (Cell Vista SLIM Pro, Phi Optics, Inc.) 42, coupled to an inverted microscope equipped with phase contrast, an automated XYZ stage, as well as a 40× (NA 0.6, PH2), 60× (NA 0.7, PH2), and 100× (NA 1.3, PH3) magnification objectives (Leica, USA). Images were acquired using the ORCA‐Flash4.0 V2 sCMOS sensor (Hamamatsu, Japan) for yeast cells, and the Grasshopper 3 GS3‐U3‐28S4M (Point Grey Research) for bacterial cells. All acquired phase images were processed on a desktop computer using ImageJ (National Institutes of Health, USA). The acquisition parameters were typically set at a 50 ms exposure, and a 15 ms refresh rate for the integrated spatial light modulator. The stability of the phase imaging measurements was independently characterized using polystyrene particles (1 µm in diameter), immobilized between a glass coverslip and an agarose gel. This controlled analysis revealed enhanced stability, with a coefficient of variation of approximately 1.1% in temporal fluctuations (see Supporting Information Fig. 1).
The procedure for phase image analysis for yeast and bacteria segmentation is detailed in the “Results” section.
Sample Preparation
Saccharomyces cerevisiae cells (ATCC® 18824™) were grown in rich YPD medium (10 g/L yeast extract, 20 g/L Peptone, and 20 g/L dextrose), and transferred to fresh medium every 24 hours at a 25× dilution. All experiments were performed at 24 hours following dilution. For fluorescent imaging of the cell wall (see Fig. 1a), 20 µL of the Calcofluor‐white stock solution (Product No. 6726, Eng. Scientific Inc.) was added to 1 mL of the yeast culture suspension.
For quantitative phase imaging, 3 µL were sampled from the suspension culture, deposited onto a glass cover slip, covered with a second coverslip, and pressed gently to minimize the distance between coverslips. The later step was critical to minimize undesired cell motion. Alternative approaches to eliminate undesired motion of yeast cells—especially in the context of microfluidics—can be also achieved by functionalizing one glass coverslip with a chemical monolayer [e.g., poly‐L‐lysine 43, 44].
Where applicable, a specific amount of the density gradient medium iodixanol (OptiPrep, Sigma Aldrich, USA) was added in the suspension culture. Iodixanol acted as a contrast agent by modulating the refractive index of the extracellular medium. To this end, the pre‐defined iodixanol volume was added directly in the yeast suspension culture and mixed thoroughly for 1 minute, prior to depositing the cells on the coverslip.
Escherichia coli (ATCC 12141™) were grown in standard LB medium (10 g/L tryptone, 10 g/L NaCl, and 5 g/L yeast extract), and transferred to fresh medium every 24 hours at a 50× dilution. All experiments were performed approximately 1 hour following dilution. To eliminate cell motion during imaging, the cells were deposited on an agarose pad (Fisher BioReagents, low‐melt agarose). The pads were prepared by dissolving approximately 2% agarose in water at 75°C for 40 minutes, followed by depositing 400 μL of the mixture between two glass coverslips, and let to dry for approximately 30 minutes 10. Subsequently, one coverslip was removed and 2 μL of the E. coli suspension was deposited on the agarose surface. The cell suspension was allowed to dry in a biosafety cabinet for approximately 15 minutes, and was then covered with another glass coverslip for imaging.
Results
A typical optical‐phase image acquired at a 100× magnification for a S. cerevisiae cell is illustrated in Figure 3a. The cell‐induced median phase‐delay was 0.5 radians, yielding a signal‐to‐background ratio (SBR) greater than a factor of 500. By repeating the measurement for over 340 observations (Fig. 3b), we identified that the phase delay induced by each individual cell is always greater than the background by more than two orders of magnitude, with a median SBR value of 500. Importantly, the background optical‐phase delay (i.e., pixels that do not correspond to a cell) was remarkably uniform across the field of view. This enhanced background uniformity eliminated false positive detection during the segmentation procedure outlined below. Both the enhanced SBR and uniform background critically enabled the segmentation of individual S. cerevisiae cells with a 100% success rate. This rate is defined as the ratio of true positive observations (TP) over the total number of observations in the “ground truth.” Ground truth and TP observations correspond to those determined by manual segmentation, and to those where the computer detected cell contour matches the manual one, respectively 45.
Figure 3.
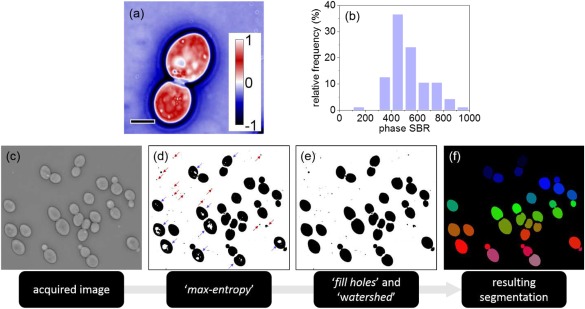
(a) A quantitative phase image of a budding S. cerevisiae cell at 100× magnification; scale bar (lower left) corresponds to 5 µm, and the calibration bar (right) exhibits the phase‐delay per pixel in radians. (b) A histogram representing the signal‐to‐background ratio (SBR) for n = 340 single‐cell observations. (c–f) The image processing pipeline including image acquisition (c), optical phase thresholding via “max‐entropy” (d), application of the “fill holes” and “watershed” algorithms (e), followed by cell segmentation coupled to size filtering with a 1,000 pixel threshold to eliminate any undesired, smaller‐sized background objects (f). [Color figure can be viewed at wileyonlinelibrary.com]
To execute the cell segmentation procedure, the following steps were implemented, relying solely on the default procedures and settings of the ImageJ software package:
Phase‐thresholding was implemented using the “maximum entropy” algorithm 46; the resulting binary image, shown in Figure 3d, evidenced that all individual cells were properly thresholded, with the exception of: 1) cells inducing low optical‐phase delay at pixels corresponding to specific low refractive index cytosolic regions (indicated by blue arrows), and 2) non‐desirable smaller‐sized objects identified in the background (indicated by red arrows).
to fully incorporate cells exhibiting low refractive index cytosolic regions to the segmentation process, we applied the default ImageJ “fill‐holes” and “watershed” algorithms with no further modification 47; the resulting binary image, shown in Figure 3e, indicates how these two computationally minimal steps enable the successful binarization of all cells within the image's FOV;
to finalize the segmentation process we applied the default ImageJ “particle analysis” procedure, by excluding: (a) the non‐desirable background objects via size filtering with a 1,000 pixel threshold; and (b) cells that are only partially within the full FOV of the image (“exclude on edges,” ImageJ). The resulting binary image, shown in Figure 3f, indicates the successful identification and segmentation of all cells in the field of view, an outcome that was repeatable for over 340 single‐cell observations.
We expanded the aforementioned investigation to two additional magnifications, namely 40× and 60× (Figs. 4a and 4b). Under these conditions, the segmentation success rate was moderately reduced to approximately 96% for both magnifications (Figs. 4c and 4d). This decrease is attributed to the reduced XY optical resolution, which in turn contributes to the reduced contrast between the extracellular background with the low‐refractive index cytosolic regions. As a result, it becomes challenging to accurately identify and binarize the contour of a few cells (<5% for both magnifications). Albeit minor, this sub‐population is characterized by distinct physiological parameters, and thus its inclusion in the screening processes needs to be maximized.
Figure 4.
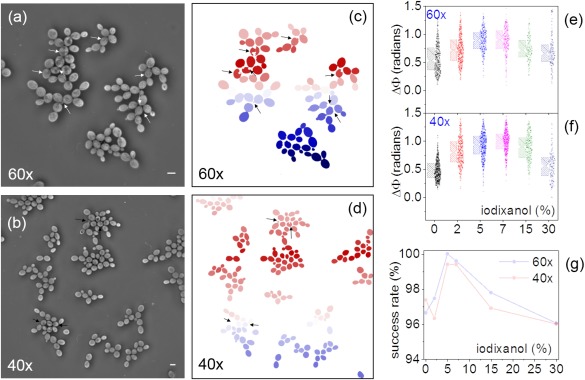
(a, b) Phase images of S. cerevisiae cells at 60× and 40× magnifications respectively; the scale bar (lower right) denotes 10 µm in both images. (c, d) The binary images of (a) and (b) after processing; the arrows indicate the cells that were unsuccessfully segmented. (e, f) Data‐overlaid boxcharts (10%–25%–75%–90%) illustrating the single‐cell phase‐delay under various iodixanol concentrations at 60× (g) and 40× (f) magnifications; 300 observations on average were acquired per iodixanol and magnification conditions. (g) The segmentation success rate at 60× and 40× magnifications as a function of the iodixanol concentration. [Color figure can be viewed at wileyonlinelibrary.com]
To address the reduced segmentation accuracy at 40× and 60× magnifications, we modulated the refractive index of the extracellular environment to boost the optical‐phase contrast between the cells and the background. To this end, we introduced a small amount of density gradient medium (iodixanol, OptiPrep, Sigma Aldrich) in the suspension culture prior to depositing on the cover slips. Such density gradient media are cost‐effective and widely available due to emerging needs of whole‐body clearing in intact tissue imaging 48, 49. Iodixanol was specifically chosen to maintain isosmotic conditions (∼290 mOsm).
By varying the iodixanol content in the cell medium, we identified that a 5% iodixanol concentration bestows the highest phase delay induced by individual S. cerevisiae cells. This is illustrated in the boxcharts of Figures 4e and 4f, evidencing an approximately twofold optical‐phase contrast enhancement for both magnifications. By performing the aforementioned image analysis procedure at this iodixanol concentration, we attained the highest segmentation success rates for both 60× and 40× magnifications at 100% and 99.4%, respectively, as shown in Figure 4g. Such segmentation success rates were possible to maintain even for dense images of greater than 100 cells per image.
In addition to S. cerevisiae yeast cells, we also investigated the optical‐phase thresholding based approach for segmenting bacteria cells. To this end, we employed Escherichia coli as a cell model system. To eliminate cell motion during imaging, bacteria cells were deposited on agarose pads, as detailed in the “Methods” section. Under such conditions, we found that—unlike yeast cells—the segmentation success rate was highly dependent on the cell density per FOV.
Specifically, at low cell densities (1–30 cells per FOV), the yeast segmentation procedure yielded 100% success rates by increasing the tolerance factor of the watershed algorithm from the default value of 0.5–3 (see Supporting Information Fig. 2). On the contrary, higher cell densities (>30 cells per FOV) exhibited reduced success rates (∼87%), irrelevant of the watershed tolerance factor. This is primarily attributed to the dense packing of the bacteria cells induced by the drying process, and the potentially associated shadowing of cells residing at lower levels along the optical path. The shadowing challenge was addressed by applying a band pass filter (with 1–40 pixels cut‐off frequencies) to all images prior to the yeast cell segmentation procedure. As shown in the table and figures of the Supporting Information Figure 2, this frequency domain filtering approach improved the success rate to 98%.
Discussion
In summary, we report the robust segmentation of individual S. cerevisiae cells at success rates greater than 99% by employing the optical‐phase metric of the transmitted wavefront rather than its intensity. These rates are comparable to the substantially more computationally intensive segmentation approaches of phase‐contrast yeast images [e.g., CellStar 45], and occasionally exceed them 50, 51. In comparison to these sophisticated image processing methods, however, the proposed interference‐based strategy requires no computationally intensive post‐acquisition image processing, other than default routines of low computational requirements that are available in most processing packages, such as ImageJ. We attribute this advantage to the elimination of the optical artifacts common in fluorescence and transmission images, which primarily emanate from cell‐to‐cell and cytosolic staining/scattering variability, as well as the ability to attain a background with a uniform optical‐phase across the field of view.
In addition, we report a cost‐effective method to boost the optical‐phase contrast between the target and the background, by introducing an isosmotic contrast agent to the cell medium. This refractive index modulation approach yielded a nearly 100% successful segmentation at lower magnifications. It is worth adding that mammalian cell segmentation was recently reported using digital holography 52, 53, 54; however, these approaches required more computationally‐intensive processing via morphological operations and marker‐controlled power watershed segmentation. Such processing needs may be attributed to the different cell types that were examined in these reports, or due to the use of coherent illumination rather than incoherent radiation as probed by way of example here.
While our results cannot be immediately generalized to all microbial cell types, as well as imaging and growth conditions, the nearly 100% segmentation success rate with no post‐acquisition image processing suggests the broad applicability of cell segmentation with quantitative phase imaging. This is supported by the similar level of success rates we attained for E. coli cells. To this end, we applied a minimally computationally intensive post‐acquisition processing using a frequency domain bandpass filter prior to segmentation. This approach yielded an approximately 98% segmentation success rate was achieved even for ultra‐dense images containing greater than 100 cells per image FOV. This rate is comparable to the substantially more processing intensive approaches, such as the maximum likelihood estimation (MALME) for phase‐contrast images of E. coli cells 55.
Overall, our findings indicate that the optical‐phase thresholding paradigm is a crucial step toward further scaling‐up of high‐throughput imaging with single‐cell resolution.
Supporting information
Supporting Information.
Acknowledgments
The authors have no conflicts of interest, financial or otherwise, to declare. The authors would also like to acknowledge Holly Wichman and LuAnn Scott (University of Idaho, Department of Biological Sciences) for the supply of Eschericia coli and LB growth medium.
Literature Cited
- 1. Meijering E, Carpenter AE, Peng H, Hamprecht FA, Olivo‐Marin J‐C. Imagining the future of bioimage analysis. Nat Biotech 2016;34:1250–1255. [DOI] [PubMed] [Google Scholar]
- 2. Stephens DJ, Allan VJ. Light microscopy techniques for live cell imaging. Science 2003;300:82–86. [DOI] [PubMed] [Google Scholar]
- 3. Vasdekis AE, Stephanopoulos G. Review of methods to probe single cell metabolism and bioenergetics. Metab Eng 2015; 27:115–135. [DOI] [PMC free article] [PubMed] [Google Scholar]
- 4. Wang D, Bodovitz S. Single cell analysis: The new frontier in ‘omics’. Trends Biotechnol 2010;28:281–290. [DOI] [PMC free article] [PubMed] [Google Scholar]
- 5. Zenobi R. Single‐cell metabolomics: Analytical and biological perspectives. Science 2013;342:1243259. [DOI] [PubMed] [Google Scholar]
- 6. Bennett MR, Hasty J. Microfluidic devices for measuring gene network dynamics in single cells. Nat Rev Genet 2009;10:628–638. [DOI] [PMC free article] [PubMed] [Google Scholar]
- 7. Armbrecht L, Dittrich PS. Recent advances in the analysis of single cells. Anal Chem 2016;89:2–21. [DOI] [PMC free article] [PubMed] [Google Scholar]
- 8. Rafelski SM, Viana MP, Zhang P, Chan Y‐HM, Thorn KS, Yam P, Fung JC, Li H, Costa LdF, Marshall WF. Mitochondrial network size scaling in budding yeast. Science 2012;338:822–824. [DOI] [PMC free article] [PubMed] [Google Scholar]
- 9. Meyer RE, Kim S, Obeso D, Straight PD, Winey M, Dawson DS. Mps1 and Ipl1/Aurora B act sequentially to correctly orient chromosomes on the meiotic spindle of budding yeast. Science 2013;339:1071–1074. [DOI] [PMC free article] [PubMed] [Google Scholar]
- 10. Young JW, Locke JCW, Altinok A, Rosenfeld N, Bacarian T, Swain PS, Mjolsness E, Elowitz MB. Measuring single‐cell gene expression dynamics in bacteria using fluorescence time‐lapse microscopy. Nat Protoc 2012;7:80–88. [DOI] [PMC free article] [PubMed] [Google Scholar]
- 11. Tay S, Hughey JJ, Lee TK, Lipniacki T, Quake SR, Covert MW. Single‐cell NF‐[kgr]B dynamics reveal digital activation and analogue information processing. Nature 2010;466:267–271. [DOI] [PMC free article] [PubMed] [Google Scholar]
- 12. Elowitz MB, Levine AJ, Siggia EG, Swain PS. Stochastic gene expression in a single cell. Science 2002;297:1183–1186. [DOI] [PubMed] [Google Scholar]
- 13. Kussell E, Leibler S. Phenotypic diversity, population growth, and information in fluctuating environments. Science 2005;309:2075–2078. [DOI] [PubMed] [Google Scholar]
- 14. Lidstrom ME, Konopka MC. The role of physiological heterogeneity in microbial population behavior. Nat Chem Biol 2010;6:705–712. [DOI] [PubMed] [Google Scholar]
- 15. Cai L, Friedman N, Xie XS. Stochastic protein expression in individual cells at the single molecule level. Nature 2006;440:358–362. [DOI] [PubMed] [Google Scholar]
- 16. Kafri R, Levy J, Ginzberg MB, Oh S, Lahav G, Kirschner MW. Dynamics extracted from fixed cells reveal feedback linking cell growth to cell cycle. Nature 2013;494:480–483. [DOI] [PMC free article] [PubMed] [Google Scholar]
- 17. Vonesch C, Aguet F, Vonesch JL, Unser M. The colored revolution of bioimaging. IEEE Signal Process Mag 2006;23:20–31. [Google Scholar]
- 18. Caicedo JC, Singh S, Carpenter AE. Applications in image‐based profiling of perturbations. Curr Opin Biotechnol 2016;39:134–142. [DOI] [PubMed] [Google Scholar]
- 19. Tarnok A. Innovations in image cytometry. Cytometry A 2012;81A:183–184. [DOI] [PubMed] [Google Scholar]
- 20. Dunn JM, Mackenzie GD, Oukrif D, Mosse CA, Banks MR, Thorpe S, Sasieni P, Bown SG, Novelli MR, Rabinovitch PS, et al. Image cytometry accurately detects DNA ploidy abnormalities and predicts late relapse to high‐grade dysplasia and adenocarcinoma in Barrett's oesophagus following photodynamic therapy. Br J Cancer 2010;102:1608–1617. [DOI] [PMC free article] [PubMed] [Google Scholar]
- 21. Robinson JP. Comparative overview of flow and image cytometry. Curr Protoc Cytom 2005;Chapter 12:Unit 12.1. [DOI] [PubMed] [Google Scholar]
- 22. Ozaki Y‐i, Uda S, Saito TH, Chung J, Kubota H, Kuroda S. A quantitative image cytometry technique for time series or population analyses of signaling networks. plos ONE 2010;5:e9955. [DOI] [PMC free article] [PubMed] [Google Scholar]
- 23. Gasparri F. An overview of cell phenotypes in HCS: Limitations and advantages. Exp Opin Drug Discov 2009;4:643–657. [DOI] [PubMed] [Google Scholar]
- 24. Eggert US, Mitchison TJ. Small molecule screening by imaging. Curr Opin Chem Biol 2006;10:232–237. [DOI] [PubMed] [Google Scholar]
- 25. Edwards BS, Oprea T, Prossnitz ER, Sklar LA. Flow cytometry for high‐throughput, high‐content screening. Curr Opin Chem Biol 2004;8:392–398. [DOI] [PubMed] [Google Scholar]
- 26. Kamentsky LA, Melamed MR, Derman H. Spectrophotometer: New instrument for ultrarapid cell analysis. Science 1965;150:630–631. [DOI] [PubMed] [Google Scholar]
- 27. Barlogie B, Raber MN, Schumann J, Johnson TS, Drewinko B, Swartzendruber DE, Gohde W, Andreeff M, Freireich EJ. Flow‐cytometry in clinical. Cancer Res 1983;43:3982–3997. [PubMed] [Google Scholar]
- 28. Hilsenbeck O, Schwarzfischer M, Skylaki S, Schauberger B, Hoppe PS, Loeffler D, Kokkaliaris KD, Hastreiter S, Skylaki R, Filipczyk A, et al. Software tools for single‐cell tracking and quantification of cellular and molecular properties. Nat Biotech 2016;34:703–706. [DOI] [PubMed] [Google Scholar]
- 29. Schroeder T. Long‐term single‐cell imaging of mammalian stem cells. Nat Methods 2011;8:S30–S35. [DOI] [PubMed] [Google Scholar]
- 30. Neumann B, Walter T, Heriche JK, Bulkescher J, Erfle H, Conrad C, Rogers P, Poser I, Held M, Liebel U, et al. Phenotypic profiling of the human genome by time‐lapse microscopy reveals cell division genes. Nature 2010;464:721–727. [DOI] [PMC free article] [PubMed] [Google Scholar]
- 31. Vasdekis A, Silverman A, Stephanopoulos G. Origins of cell‐to‐cell bioprocessing diversity and implications of the extracellular environment revealed at the single‐cell level. Sci Rep 2015;5:17689. [DOI] [PMC free article] [PubMed] [Google Scholar]
- 32. Meijering E. Cell segmentation: 50 years down the road [life sciences]. IEEE Signal Process Mag 2012;29:140–145. [Google Scholar]
- 33. Selinummi J, Ruusuvuori P, Podolsky I, Ozinsky A, Gold E, Yli‐Harja O, Aderem A, Shmulevich I. Bright field microscopy as an alternative to whole cell fluorescence in automated analysis of macrophage images. PLoS One 2009;4:e7497. [DOI] [PMC free article] [PubMed] [Google Scholar]
- 34. Drey LL, Graber MC, Bieschke J. Counting unstained, confluent cells by modified bright‐field microscopy. BioTechniques 2013;55:114056. [DOI] [PMC free article] [PubMed] [Google Scholar]
- 35. Ali R, Gooding M, Szilágyi T, Vojnovic B, Christlieb M, Brady M. Automatic segmentation of adherent biological cell boundaries and nuclei from brightfield microscopy images. Mach Vis Appl 2012;23:607–621. [Google Scholar]
- 36. Eliceiri KW, Berthold MR, Goldberg IG, Ibanez L, Manjunath BS, Martone ME, Murphy RF, Peng H, Plant AL, Roysam B, et al. Biological imaging software tools. Nat Meth 2012;9:697–710. [DOI] [PMC free article] [PubMed] [Google Scholar]
- 37. Huth J, Buchholz M, Kraus JM, Molhave K, Gradinaru C, Wichert G‐v, Gress TM, Neumann H, Kestler HA. TimeLapseAnalyzer: Multi‐target analysis for live‐cell imaging and time‐lapse microscopy. Comput Methods Prog Biomed 2011;104:227–234. [DOI] [PubMed] [Google Scholar]
- 38. Klein J, Leupold S, Biegler I, Biedendieck R, Munch R, Jahn D. TLM‐Tracker: Software for cell segmentation, tracking and lineage analysis in time‐lapse microscopy movies. Bioinformatics 2012;28:2276–2277. [DOI] [PubMed] [Google Scholar]
- 39. de Chaumont F, Dallongeville S, Chenouard N, Herve N, Pop S, Provoost T, Meas‐Yedid V, Pankajakshan P, Lecomte T, Le Montagner Y, et al. Icy: An open bioimage informatics platform for extended reproducible research. Nat Methods 2012;9:690–696. [DOI] [PubMed] [Google Scholar]
- 40. Carpenter AE, Jones TR, Lamprecht MR, Clarke C, Kang IH, Friman O, Guertin DA, Chang JH, Lindquist RA, Moffat J, et al. CellProfiler: Image analysis software for identifying and quantifying cell phenotypes. Genome Biol 2006;7:R100. [DOI] [PMC free article] [PubMed] [Google Scholar]
- 41. Mayer C, Dimopoulos S, Rudolf F, Stelling J. Using CellX to quantify intracellular events In: Ausubel FM, et al., editors. Current Protocols in Molecular Biology. New York: John Wiley & Sons, Inc; 2001. [DOI] [PubMed] [Google Scholar]
- 42. Kim T, Zhou R, Mir M, Babacan SD, Carney PS, Goddard LL, Popescu G. White‐light diffraction tomography of unlabelled live cells. Nat Photon 2014;8:256–263. [Google Scholar]
- 43. Vasdekis AE, O'Neil CP, Hubbell JA, Psaltis D. Microfluidic assays for DNA manipulation based on a block copolymer immobilization strategy. Biomacromolecules 2010;11:827–831. [DOI] [PubMed] [Google Scholar]
- 44. Mazia D, Schatten G, Sale W. Adhesion of cells to surfaces coated with polylysine. Applications to electron microscopy. J Cell Biol 1975;66:198–200. [DOI] [PMC free article] [PubMed] [Google Scholar]
- 45. Versari C, Stoma S, Batmanov K, Llamosi A, Mroz F, Kaczmarek A, Deyell M, Lhoussaine C, Hersen P, Batt G. Long‐term tracking of budding yeast cells in brightfield microscopy: Cellstar and the Evaluation Platform. J R Soc Interface 2017;14:705. [DOI] [PMC free article] [PubMed] [Google Scholar]
- 46. Kapur JN, Sahoo PK, Wong AKC. A new method for gray‐level picture thresholding using the entropy of the histogram. Comput Vis Graph Image Process 1985;29:273–285. [Google Scholar]
- 47. Roerdink JBTM, Meijster A. The watershed transform: Definitions, algorithms and parallelization strategies. Fundam Inf 2000;41:187–228. [Google Scholar]
- 48. Yang B, Treweek JB, Kulkarni RP, Deverman BE, Chen CK, Lubeck E, Shah S, Cai L, Gradinaru V. Single‐cell phenotyping within transparent intact tissue through whole‐body clearing. Cell 2014;158:945–958. [DOI] [PMC free article] [PubMed] [Google Scholar]
- 49. Marx V. Microscopy: Seeing through tissue. Nat Meth 2014;11:1209–1214. [DOI] [PubMed] [Google Scholar]
- 50. Doncic A, Eser U, Atay O, Skotheim JM. An algorithm to automate yeast segmentation and tracking. plos ONE 2013;8:e57970. [DOI] [PMC free article] [PubMed] [Google Scholar]
- 51. Zhang C, Huber F, Knop M, Hamprecht FA. Yeast cell detection and segmentation in bright field microscopy. In: 2014 IEEE 11th International Symposium on Biomedical Imaging (ISBI); 2014.
- 52. El‐Zehiry N, Hayden O, Kamen A. Cell segmentation in digital holographic images. In: 2016 IEEE 13th International Symposium on Biomedical Imaging (ISBI); 2016.
- 53. Yi F, Moon I, Javidi B, Boss D, Marquet P. Automated segmentation of multiple red blood cells with digital holographic microscopy. J Biomed Opt 2013;18:26006. [DOI] [PubMed] [Google Scholar]
- 54. Koyuncu CF, Arslan S, Durmaz I, Cetin‐Atalay R, Gunduz‐Demir C. Smart markers for watershed‐based cell segmentation. plos ONE 2012;7:e48664. [DOI] [PMC free article] [PubMed] [Google Scholar]
- 55. Chowdhury S, Kandhavelu M, Yli‐Harja O, Ribeiro AS. Cell segmentation by multi‐resolution analysis and maximum likelihood estimation (MAMLE). BMC Bioinform 2013;14:S8. [DOI] [PMC free article] [PubMed] [Google Scholar]
Associated Data
This section collects any data citations, data availability statements, or supplementary materials included in this article.
Supplementary Materials
Supporting Information.