

Abstract
The hypoxic microenvironment is an important contributor of glioblastoma (GBM) aggressiveness via HIF1α, while tumour inflammation is profoundly influenced by FAT Atypical Cadherin (FAT1). This study was designed to explore the functional interaction and significance of FAT1 and HIF1α under severe hypoxia‐mimicking tumour microenvironment in primary human tumours. We first identified a positive correlation of FAT1 with HIF1α and its target genes in GBM tumour specimens, revealing the significance of the FAT1‐HIF1α axis in glioma cells. We found that severe hypoxia leads to an increased expression of FAT1 and HIF1α in U87MG and U373MG cells. To reveal the relevance of FAT1 under hypoxic conditions, we depleted endogenous FAT1 under hypoxia and found a substantial reduction in the expression of HIF1α and its downstream target genes like CA9, GLUT1, VEGFA, MCT4, HK2, BNIP3 and REDD1, as well as a significant reduction in the invasiveness in GBM cells. At the molecular level, under hypoxia the FAT1 depletion‐associated reduction in HIF1α was due to compromised EGFR‐Akt signaling as well as increased VHL‐dependent proteasomal degradation of HIF1α. In brief, for the first time, these results reveal an upstream master regulatory role of FAT1 in the expression and role of HIF1α under hypoxic conditions and that FAT1‐HIF1α axis controls the invasiveness of GBM. Hence, FAT1 represents a novel potential therapeutic target for GBM.
Keywords: FAT1, HIF1α, Hypoxia, EGFR‐AKT, VHL, Glioblastoma
Short abstract
What's new?
The hypoxic microenvironment is an important contributor of glioblastoma aggressiveness via HIF1α while tumor inflammation is profoundly influenced by FAT Atypical Cadherin (FAT1). This study explores the functional interaction of FAT1 and HIF1α in severe hypoxia‐mimicking tumor microenvironments. The results show that FAT1 upregulation is critical for enhancing and maintaining high HIFIα levels in tumors with severe hypoxia. FAT1 both increases HIFIα transcription and decreases HIFIα degradation in glioblastoma multiforme cell lines under hypoxic conditions. With FAT1 regulating the activity of HIF1α under hypoxic condition and the FAT1‐HIF1α axis controlling the invasiveness of glioblastoma, FAT1 represents a novel potential therapeutic target for glioblastomas.
Glioblastomas (GBM) are the commonest and most lethal intracranial tumours. The GBMs exhibit a relentless malignant progression characterized by invasiveness and resistance to therapy.1, 2 In GBM, hypoxia is readily recognizable, resulting in the necrotic areas in the core of the tumour and surrounded by evidence of hypoxic response and neovascularisation.3 It is known that hypoxia contributes to an aggressive phenotype in tumours, including features of resistance to apoptosis, drug resistance, increased invasiveness and tumour heterogeneity and aggressive growth patterns.4 Survival and proliferation of GBM cells under such adverse condition requires an adaptation to the environment, wherein, hypoxia‐inducible factor‐1 (HIF1α) is a key adaptive molecule for regulating the cellular response.5 On activation and stabilisation during hypoxia, HIF1α upregulates target genes involved in the process of angiogenesis, tumour invasion and metastasis, energy metabolism, and adaptive survival in GBM6, 7 and tumours at‐large.8 Overexpression of HIF1α in surgically resected tumour specimens has been shown to have positive correlation with tumour aggressiveness and poor prognosis in different tumours including GBM.9 HIF1α is known to be regulated by growth factors,10, 11 cytokines12 and mitogens.13, 14 EGFR/Akt pathway is a known positive regulator of HIF1α10 and this pathway may function via mTOR10, 11 or independent of it.15, 16 The EGFR/Akt pathway is known to be frequently activated in GBM.17
FAT1 is a transmembrane protein, mapped on human chromosome 4q34‐35.18 FAT1 is the human orthologue of Drosophila tumour suppressor gene ‘fat’. The name FAT was given by Dunne et al. (1995) in their paper as it structurally resembles Drosophila tumour suppressor protein ‘fat’. In Drosophila, the protein was named ‘fat’ as the recessive mutations at the locus lead to fattening or overgrowth of the Drosophila imaginal discs19 hence, was named as ‘fat locus’. FAT1 regulates the invasive and/or migratory potential of the normal20, 21 and cancer cells.22, 23 FAT1 exhibits a dual role as it could act as an oncogene23, 24, 25 or tumour suppressor26, 27 in different tumour types. For the first time, our laboratory had demonstrated a role of FAT1 in GBM.22, 28 While on one hand, a high proportion of FAT1 LOH was seen in glioma, on the other hand, we observed that FAT1 overexpression28 acted like an oncogene and promoted an inflammatory environment in GBM.22 The underlying mechanism includes stimulation of AP1‐mediated transcriptional activation due to the down‐regulation of the tumour suppressor gene, PDCD4.22 More recently, increased FAT1 expression has been noted in hepatocellular carcinoma due to reduced levels of the methyl group donor S‐adenosyl‐l‐methionine under hypoxia.25
Although FAT122 and HIF1α29 , 30 have emerged as two independent contributors of adverse phenotypes in glioma, a regulatory link between FAT1 and HIF1α remains unknown. We had previously reported the mRNA levels of FAT1 as well as HIF1α and its target genes in primary human GBM samples from the same cohort group.22, 31 On further analysis of these results, we observed a positive correlation of FAT1 with HIF1α and its target genes in these primary GBM specimens. Consequent to these findings, we have elucidated the molecular interaction between FAT1 and HIF1α under severe hypoxia in GBM cell lines (U87MG and U373MG) and the grade‐II glioma cell line (GOS3). In brief, we have identified an upstream regulatory role of FAT1 in the expression of HIF1α, and consequently, its functions in GBM cells under hypoxia and elucidated the underlying mechanism of this regulation. This identifies FAT1 as an upstream regulator of the hypoxic response in GBM.
Materials and Methods
Reagents and antibodies
FAT1 siRNA (HSS103567) and control siRNA (12935–300) from Invitrogen Life technologies (Grand Island, NY), siRNA against FAT1 (J‐010513–07‐0020), HIF1α (L‐004018–00‐0005) and control (D‐001810–10‐20) from Dharmacon (Lafayette, CO), HIF2α (S102663038) and negative siControl (1027310) from Qiagen (Hilden, Germany). Proteasome inhibitor (MG132) from CalBiochem. Antibodies: VHL, p‐Akt (Ser 473), p‐mTOR (Ser 2448) and EGFR from Cell signaling technology (Beverly, MA); β‐actin from Abcam (Cambridge, UK); HIF1α from Novus (Littleton, CO). Primers were designed using Primer3 software and ordered from MWG
Biotech (Ebersberg, Germany). HIF1α promoter luciferase construct was a kind gift from Dr. Mukhopadhyay (JNU, New Delhi).
Cell culture and siRNA transfection
Human glioma cell lines U87MG, U373MG and GOS3 were obtained from ATCC (Rockville, MD) cultured in Dulbecco's Modified Eagle Medium (Sigma‐Aldrich, St Louis, MO) as described earlier.22 Normoxic (20% O2, 5% CO2, 75% N2) and hypoxic environment (0.2% O2, 5% CO2 and 94.8% N2) was created using AnoxomatJB (Drachten, Netherlands). For transfection of FAT1 and HIF1α siRNA, 2 × 10⁵ cells were seeded per 25cm2 flask. After 24 hr, cells were transfected with siFAT1, siHIF1α and siControl according to the manufacturer's protocol with a final concentration of 100 nM of siRNA using Lipofectamine2000 and Opti‐Mem media (Invitrogen) and cultured under normoxic or hypoxic condition for 72 hr.
cDNA synthesis and q‐PCR
Total RNA was isolated from cells at appropriate time point using TRIzol reagent (Invitrogen, Grand Island, NY), quantified using a Nanodrop ND‐1000 spectrophotometer. DNase (Ambion) treatment was given and 1 µg of total RNA was used for cDNA synthesis and q‐PCR was done for expression analysis.22 The detail of the primers used for expression analysis is given in Supporting Information table (Supporting Information Table SI).
Western blot analysis
Lysates were prepared and blot was developed as mentioned earlier.22 Equal amounts of protein (60 µg) were resolved on a 10% SDS‐PAGE. Enhanced chemiluminescence Western blotting detection reagent (Pierce, Rockford, IL) was used to detect protein levels. Band densities of protein were normalized to β‐actin.
Cell viability assay and cell apoptosis analysis
To assess the effect of FAT1 knockdown on glioma cell viability, MTT assay was done.
For MTT assay, 8 × 10³ cells were seeded in each well of 96‐well flat bottom plates. Twenty‐four hour after plating, FAT1 and control siRNAs were transfected as described above and then maintained under normoxia or hypoxia. After 24 hr, 48 hr, 72 hr of siRNA transfection, MTT assay was performed as per manufacturer's protocol. Each experiment was done in triplicates and repeated thrice.
Migration and invasion assay
The migratory/invasive responses of glioma cells after FAT1 knockdown were analysed using the modified Boyden chamber/matrigel assay as described earlier.22 To assess the effect of FAT1 knockdown on migration/invasion under hypoxia, after siRNA transfection, cells were maintained under hypoxia for 72 hr and cell migration and invasion assay was performed.
HRE (HIF1α response element) luciferase reporter assay
U87MG cells (5 × 10⁴cells/well) were plated in 6‐well plates in triplicate. Cells were transfected with siFAT1 and siControl and then maintained under normoxic/hypoxic condition. After 24 hr of siRNA transfection, cells were transfected with 1 µg of HIF1α luciferase reporter plasmid with six copies of wild‐type‐ TACGTGAC or mutant‐ TAAAAGAC hypoxia‐responsive elements (HREs),32 along with 50 ng of pRL‐TK (Renilla luciferase) control plasmid using lipofectamine2000 as the transfection reagent. After 48 hr of reporter plasmid transfection, the cells were lysed using 1× passive‐lysis‐buffer (Promega) and luciferase activity was assayed as previously described.33 The luciferase activity observed in cells transfected with pGL3 vector was taken as a reference and in the cells co‐transfected with control siRNA/FAT1 siRNA and wildtype promoter construct was expressed as fold change.
Metabolic studies
ATP levels
Cells of 8 × 10³ per well were plated in 96‐well plate, after 24 hr of plating, cells were transfected with siFAT1 and siControl followed by hypoxia exposure. After 72 hr of siFAT1 transfection and hypoxic treatment, levels of ATP in the cells were measured using the CellTiter‐Glo Luminescent Cell Viability Assay Kit (Promega Biosciences, CA) following manufacturer's protocol. Luminescence was measured by a microplate luminometer.
Lactate levels
Cells of 8 × 10³ per well were plated in 96‐well plate and allowed to adhere for 24 hr. After 72 hr of siFAT1 transfection and hypoxic treatment, lactate levels were measured using the Beckman Coulter Machine at Sri Ganga Ram Hospital, New Delhi and were also confirmed using Biovision's Lactate Colorimetric Assay Kit II (Biovision, San Francisco).
Human GBM samples
Correlation of FAT1, HIF1α and hypoxia markers (PGK1 and VEGFA) in 35 human Grade IV GBM samples within the same cohort was done using the data already published.22, 31 Here, we analysed the correlation between FAT1 and hypoxia markers. Tumours were arranged in decreasing order of FAT1 expression and grouped into four quartiles (A, B, C and D). Group A had the highest FAT1 expression and group D the lowest.22 Expression level of HIF1α, PGK1 and VEGFA were compared between A and D and statistical correlation was done using Student's t test (1‐tailed). Similarly the Pearson correlation of FAT1 with HIF1α and its target genes was analysed in these GBM samples using SPSS (1‐tailed). FAT1 and HIF1α expression was also analysed in 18 grade II astrocytoma samples in a manner similar to that for Grade IV tumours. Again, HIF1α expression in the highest and lowest quartiles based on decreasing order of FAT1 expression was analysed, followed by statistical correlation and regression analysis using SPSS.
Statistical analysis
All in vitro experiments were performed in triplicate and repeated thrice. Differences were determined using Student's t test, and p ≤ 0.05 was considered significant. Data values are shown as the mean ± s.d. Graphs were prepared using Prism3 (Graph Pad). Real time data were analysed using REST software v2.0.1.13
Results
FAT1 status correlates well with the HIF1α expression in primary human GBM tumours
Here, we analysed the correlation status of the mRNA expression of FAT1 with HIF1α and its target genes (PGK1and VEGFA) in the cohort of patients used in our recent study22, 31 by statistical means. We arranged the GBM samples in the decreasing order of FAT1 expression and grouped these as quartiles.22 The expression of HIF1α (mean value ± s.d) in the first quartile having the highest FAT1 expression (group A) was compared with that observed in the fourth quartile having lowest FAT1 expression (group D). HIF1α expression was significantly higher (14.811 ± 18.894) in the highest FAT1 expressing quartile (group A) as compared to the lowest (3.455 ± 3.161) FAT1 expression quartile (group D) (Table 1). The difference was statistically significant with p = 0.04. Of the HIF1α targets, the correlation of FAT1 with PGK1 and VEGFA was significant with p = 0.05 and p = 0.02, respectively (Table 1). Furthermore, regression analysis (Pearson correlation) of 35 GBM samples for these values, showed that FAT1 mRNA levels were significantly correlated with HIF1α (R 2 = 0.520, p = 0.001), PGK1 (R 2 = 0.559, p < 0.001) and VEGFA (R 2 = 0.512, p = 0.001) levels. In addition to this, we have also analysed expression correlation of FAT1 and HIF1α in 18 grade II astrocytoma samples. Similar to GBM, the difference of HIF1α expression between the highest (33.10 ± 31.12) and lowest (1.16 ± 1.24) quartiles (as determined by FAT1 expression) was statistically significant (p = 0.049). This was also supported by regression analysis (Pearson coefficient = R 2 = 0.793, p < 0.001, n = 18, the exact values are given in Supporting Information Table S2). Furthermore, on comparing HIF1α expression in the highest and the lowest quartile based on FAT1 expression in all glioma tumours (grade II and grade IV taken together), we observed statistically significant difference (p = 0.013) in HIF1α expression mean = 22.94 in the quartile having high FAT1 expression and mean = 2.86 in quartile having low FAT1 expression. Moreover, we also observed significant correlation between HIF1α and FAT1, as done by Regression analysis (Pearson coefficient = R 2 = 0.506, p < 0.001, n = 52).
Table 1.
| Group | Samples | FAT1/18S | HIF1α/18S | PGK1/18S | VEGFA/18S |
|---|---|---|---|---|---|
| Group A | GBM10 | 70.56 | 42.3 | 30.8463 | 75.5054 |
| GBM35 | 34.844 | 26.8 | 107.3223 | 372.05 | |
| GBM11 | 19.99 | 12.8 | 93.898 | 368.0112 | |
| GBM8 | 19.49 | 46.4 | 50.2272 | 52.2627 | |
| GBM30 | 13.707 | 0.9 | 11.2373 | 79.7538 | |
| GBM24 | 13.99 | 1.8 | 15.0016 | 96.7001 | |
| GBM25 | 8.138 | 1 | 1.7115 | 1.6307 | |
| GBM6 | 5.98 | 0.8 | 15.916 | 63.3448 | |
| GBM5 | 5.29 | 0.5 | 2.4682 | 0.3564 | |
| Group B | GBM12 | 4.7 | 0 | 0.867 | 15.4506 |
| GBM7 | 4.66 | 76.7 | 17.9432 | 12.7923 | |
| GBM31 | 4 | 3 | 10.9273 | 125.6737 | |
| GBM33 | 3.949 | 3.6 | 5.7139 | 6.1086 | |
| GBM2 | 2.479 | 5.4 | 15.071 | 19.9339 | |
| GBM32 | 1.548 | 0.7 | 3.2328 | 10.4695 | |
| GBM29 | 1.5 | 0.6 | 2.4878 | 9.1565 | |
| GBM28 | 1.3 | 0 | 1.257 | 61.9258 | |
| GBM27 | 1.2 | 2.7 | 13.5682 | 69.513 | |
| Group C | GBM1 | 0.034 | 0.8 | 1.3526 | 1.0783 |
| GBM23 | 0.007 | 0 | 0.0474 | 0.0993 | |
| GBM21 | 0.006 | 1.8 | 2.7818 | 9.5844 | |
| GBM34 | 0.006 | 1.4 | 13.0413 | 10.0885 | |
| GBM4 | 0.003 | 4.3 | 2.801 | 1.333 | |
| GBM13 | 0.003 | 0 | 1.711 | 0.07 | |
| GBM3 | 0.002 | 0 | 10.5045 | 24.6914 | |
| GBM22 | 0.002 | 0.4 | 2.0787 | 0.559 | |
| Group D | GBM9 | 0.001 | 10.6 | 3.231 | 7.925 |
| GBM14 | 0.001 | 1.5 | 3.5548 | 0.3647 | |
| GBM15 | 0.001 | 0.6 | 0.7373 | 21.7746 | |
| GBM16 | 0.001 | 4 | 8.619 | 7.4995 | |
| GBM17 | 0.001 | 5 | 4.8664 | 4.0123 | |
| GBM18 | 0.001 | 3 | 12.2278 | 1.3481 | |
| GBM19 | 0.001 | 2.2 | 10.2216 | 2.0512 | |
| GBM20 | 0.001 | 4.2 | 42.2861 | 50.3719 | |
| GBM26 | 0.001 | 0 | 0.065 | 0.2561 |
GBM samples were arranged according to decreasing FAT1 expression as compared to normal brain RNA and were divided into four groups (group A, B, C and D). Significance was analysed using Student's t test (1‐tailed). The HIF1α expression (mean ± s.d) in the groups A and D were calculated (14.811 ± 18.894 and 3.455 ± 3.161, respectively) and the difference in the two groups were found to be statistically significant (p = 0.04). Similarly, on comparing the expression of HIF1α target genes (PGK1 and VEGFA) in groups A and D, there was a significant positive correlation between FAT1 and HIF1α target genes expression, with the mean ± s.d. of groups A and D being (36.514 ± 39.406 and 123.290 ± 143.704, respectively, in comparison to 9.534 ± 12.969 and 10.622 ± 16.345, respectively), with p = 0.05 for PGK1 and p = 0.02 for VEGFA.
Hypoxia increases expression of FAT1 and HIF1α in GBM cell lines
To validate the significance of the above findings observed in GBM tumours, GBM (U87MG and U373MG) and grade‐II glioma (GOS3) cell lines were maintained under normoxia (20% O2) or severe hypoxia (0.2% O2). The oxygen concentration selected for hypoxia experiments was based on the observation of maximal effect on the mRNA expression of HIF1α target genes like CA9, VEGFA and PGK1 under 0.2% O2 as compared to 1%, 2%, 6% and 20% of O2 in U87MG cell line (Supporting Information Fig S1). There was no difference in expression between mock and siControl treated cells and hence siControl has been used for better comparison with knockdown experiments shown subsequently. We noted that the basal FAT1 mRNA expression in GBM (U87MG and U373MG) cell lines was observed to be higher as compared to grade‐II glioma cell line (GOS3). Levels in GOS3 were 20% of that observed in U87MG (Fig. 1 a) under standard culture conditions with 20% oxygen. On exposing the cells to severe hypoxia (0.2% O2), the level of FAT1 mRNA was 7.8, 4.3 and 1.8 folds higher in U87MG, U373MG and GOS3 cells as compared to their respective normoxic counterparts (Fig. 1 b). On analysing HIF1α mRNA, it was found to be increased by 2.8, 1.8 and 1.5 folds higher in hypoxic U87MG, U373MG and GOS3 cell lines respectively as compared to their normoxic counterparts (Fig. 1 c). A significant increase in HIF1α protein was also observed in U87MG (1.45 fold) and U373MG (1.55 fold) cells but not in GOS3 (Fig. 1 d), supporting the notion that hypoxia increases expression of FAT1 and HIF1α in U87MG and U373MG cells.
Figure 1.
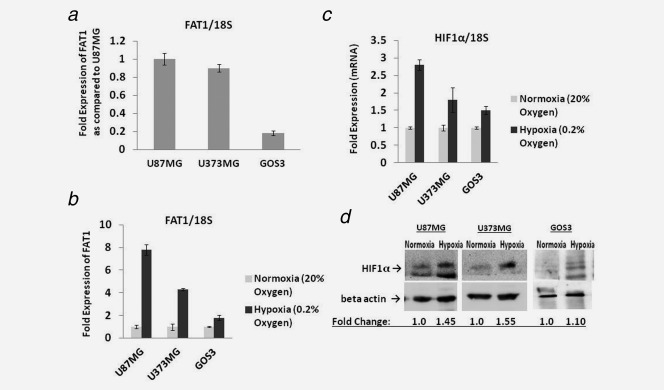
(a) mRNA Expression of FAT1 in glioma cell lines maintained under normoxic (20% O2) condition: FAT1 expression was checked in GBM (U87MG and U373MG) and grade II (GOS3) glioma cell lines by q‐PCR. GBM (U87MG and U373MG) cell lines were found to have higher FAT1 expression as compared to grade II glioma cell line, GOS3. 18S was used as an internal control. (b) Expression of FAT1 under hypoxic conditions: Glioma cell lines were maintained under both normoxia (20% O2) and hypoxia (0.2% O2). FAT1 mRNA expression was analysed by q‐PCR and was found to be significantly upregulated under hypoxic (siControl) condition in both U87MG and U373MG glioma cell lines (7.3 fold and 4.3 fold, respectively) as compared to their respective normoxic (siControl) cells. In GOS3, the level was 1.8 fold increased under hypoxia as compared to its normoxic counterpart. 18S was used as an internal control. (c,d) HIF1α mRNA and protein level in glioma cell lines: The glioma cells were grown under normoxic (20% O2) and hypoxic (0.2% O2) conditions for 72 hr; q‐PCR (c) and Western blot (d) analysis were done. Under hypoxic condition, the HIF1α level was found to be increased in both U87MG and U373MG glioma cell lines at both mRNA and protein level; in GOS3, the increase in HIF1α level under hypoxia was minimal. The blot lanes for GOS3 in Figure 1‐d are depicted again in Figure 2c. These were part of the experiment depicted in Figure 2c and are shown in both the figures to maintain the flow of the text. 18S was used as an internal control for q‐PCR and β‐actin was used as loading control for Western blot.
FAT1 is an upstream regulator of HIF1α expression
As hypoxia increased the expression of both FAT1 and HIF1α, we next investigated the possibility of a regulatory role of FAT1 in influencing the level of HIF1α by depleting the endogenous FAT1 using FAT1 specific siRNA21 in the glioma cell lines maintained under hypoxia (0.2% O2) (Fig. 2 a, Supporting Information Fig S2). We found that FAT1 depletion was accompanied by 65% and 37% reduction in the levels of HIF1α mRNA in U87MG and U373MG, as compared to cells treated with control siRNA (Fig. 2 b). Similarly, HIF1α protein levels were also decreased significantly in U87MG and U373MG cell lines on FAT1 knockdown (Fig. 2 c). In grade‐II glioma cell line (GOS3) with low endogenous FAT1 expression, the effect of FAT1 on HIF1α was minimal (Fig. 2 b). To confirm the effect of FAT1 knockdown on HIF1α expression, the U87MG cell line was exposed to severe hypoxia for different time periods before analysing the status of HIF1α. We observed a rapid induction of HIF1α protein in cells treated with control siRNA, while depletion of FAT1 impaired the ability of hypoxia to induce HIF1α (Supporting Information Fig S3), revealing a regulatory role of FAT1 on HIF1α expression. To study whether HIF1α, conversely, has a role in regulating the expression of FAT1 under hypoxia, HIF1α was knocked down using HIF1α specific siRNA and analysed the expression of FAT1. We observed a comparable expression of FAT1 in both siHIF1α and siControl treated cells with no effect on FAT1 expression after HIF1α knockdown (Fig. 2 d). HIF2α expression was also observed to be upregulated under hypoxia in U87MG cell line (Supporting Information Fig S4). HIF2α knockdown showed no effect on the expression of FAT1 (Supporting Information Fig S4). Next we examined the effect of FAT1 on HIF1α activity using a HIF1α luciferase reporter assay. U87MG cell line was maintained under hypoxia and co‐transfected with HIF1α reporter plasmid (wild‐type HIF1α promoter) or control plasmid (PGL3 empty vector)32 in cells with or without depleted FAT1. The results demonstrated 60% decrease in the HIF1α luciferase activity in siFAT1 treated cells (p = 0.01), in comparison to siControl treated cells (Fig. 2 e), reflecting the loss of positive regulatory effect of FAT1 after its knockdown on HIF1α activity under hypoxic condition. As expected, HIF1α luciferase activity in cells transfected with HRE mutated HIF1α promoter was undetectable (Supporting Information Fig S5). Collectively, these results validate a positive regulatory role of FAT1 on HIF1α expression and activity under hypoxic conditions in GBM cells.
Figure 2.

(a) siRNA mediated knockdown of FAT1 expression in glioma cell lines under hypoxia: siRNA (siControl and siFAT1) transfection was done in U87MG, U373MG and GOS3 cell lines maintained under hypoxia. FAT1 mRNA level was checked after 72 hr of siRNA transfection. We found >80% downregulation of FAT1 mRNA in siFAT1 transfected cells as compared to siControl transfected cells under hypoxic condition, 72 hr post‐transfection. 18S was used as internal control. All the experiments were done in triplicates and repeated thrice. (b,c) Effect of FAT1 knockdown on HIF1α expression in glioma cell lines: HIF1α mRNA and protein level were assessed, 72 hr post‐siFAT1 transfection, under hypoxic condition by q‐PCR and Western blot respectively. (b) At mRNA level, on FAT1 knockdown, HIF1α showed 65% and 37% reduction in U87MG and U373MG cells respectively under hypoxic condition. (c) Similarly, at protein level, significant decrease in HIF1α level in both siFAT1 treated U87MG and U373MG cells as compared to siControl treated cells was found. However, in GOS3, there was no significant difference in HIF1α at both mRNA and protein level between cells treated with control siRNA and those treated with FAT1 siRNA (b,c). 18S was used as internal control for q‐PCR and β‐actin was used as loading control for Western blot. Nor: Normoxia, Hyp siCont: Hypoxia siControl, Hyp siFAT1: Hypoxia siFAT1 (d) FAT1 expression after HIF1α knockdown in U87MG glioma cell line: FAT1 mRNA expression was checked by q‐PCR in U87MG cells 72 hr post transfection of HIF1α siRNA under hypoxic condition. On HIF1α knockdown, FAT1 expression was observed as comparable to Control siRNA treated cells. 18S was used as internal control. (e) Effect of FAT1 knockdown on HIF1α activity in U87MG glioma cell line maintained under hypoxia: HIF1α promoter luciferase assay was done to assess HIF1α transcriptional activity after FAT1 knockdown under hypoxic condition. After 24 hr of siFAT1 transfection, cells were transfected with 1 µg of HIF1α reporter plasmid. Luciferase activity was assayed 48 hr post‐HIF1α reporter plasmid transfection. The luciferase activity observed in cells transfected with pGL3 vector was taken as control and set to 1 and the activity observed in the cells co‐transfected with control siRNA/FAT1 siRNA and wildtype promoter construct was expressed as fold change. On FAT1 knockdown, 60% decrease (p = 0.01) in HIF1α promoter luciferase activity was observed in comparison to siControl treated cells, as determined by Student's t test. The experiment was repeated thrice and results are expressed as mean ± standard deviation. As mentioned earlier, the first two lanes for GOS3 in Figure 2c are also depicted in Figure 1d.
Revelation of FAT1 regulation of EGFR‐Akt signaling under hypoxia
Because the EGFR‐Akt pathway augments HIF1α expression under hypoxia,10 we next analysed the effect of FAT1 knockdown on the expression of EGFR as well as the expression and phosphorylated state of Akt in glioma cell lines under hypoxia. On FAT1 knockdown, there was 75% reduction in the level of EGFR transcription in U87MG cells (Fig. 3 a) and significant reduction of EGFR protein in U87MG and U373MG (Fig. 3 a) as compared to their respective siControl treated hypoxic cells. There was marked reduction in the levels of p‐Akt in both U87MG and U373MG cells (Fig. 3 b) after FAT1 knockdown as compared to their respective hypoxia control cells. p‐mTOR and p‐S6K1 levels under hypoxia in both U87MG and U373MG cells was found to be low as compared to normoxic counterparts (Fig. 3 b). On FAT1 knockdown, there was further reduction in their levels (Fig. 3 b). Hence, it appears that FAT1 regulates HIF1α expression via EGFR/Akt/mTOR pathway as previously reported.15, 16
Figure 3.

(a,b) Effect of FAT1 siRNA on EGFR, p‐Akt, p‐mTOR and p‐S6K1 expression level in glioma cells maintained under hypoxia: the levels of EGFR (a) was assessed by q‐PCR and Western blot analysis, p‐Akt, p‐mTOR and p‐S6K1 (b) was assessed by Western blot analysis. On FAT1 knockdown, there was marked decrease in the expression levels of EGFR, p‐Akt, p‐mTOR and p‐S6K1 when compared with their respective siControls. 18S was used as internal control for q‐PCR and β‐actin was used as control for Western blot. (c) Effect of FAT1 siRNA on VHL expression in glioma cell lines: VHL expression was assessed by q‐PCR and Western blot, 72 hr post‐transfection under hypoxic condition in U87MG and U373MG cells. At mRNA level, on FAT1 knockdown, there was no increase in VHL in comparison to siControl treated cells. Similarly, at protein level increase in VHL in siFAT1 treated cells in both the cell lines was observed. 18S was used as internal control for q‐PCR and β‐actin was used as control for Western blot. (d) Effect of MG132 (proteosomal inhibitor) on HIF1α level: Under normoxic condition, on MG132 treatment (for 48 hr), there was increase in the level of HIF1α due to decreased proteosomal degradation. Under hypoxia, on FAT1 knockdown, HIF1α levels were low but on MG132 treatment, there was 4.5 folds increase in the HIF1α level. β‐actin was used as a control. Nor: Normoxia, Hyp siCont: Hypoxia siControl, Hyp siFAT1: Hypoxia siFAT1. [The Western blot pictures for U87MG (Figs. 2c, 3a, 3b, and 3c) are from the same transferred blot, developed with the appropriate antibody. Hence, the β‐actin control is common and is depicted in each figure for ease of comparison. The background contrast of β‐actin has been altered with equal treatment to all lanes. Similarly, the Western blot pictures of U373MG (Figs. 3b and 3c) are also from the same blot transfer with a common β‐actin control depicted at both places].
FAT1 is a negative regulator of VHL (Von Hippel–Lindau) expression under hypoxia
VHL regulates HIF1α level in tissues by promoting its proteasomal degradation.34 Normally, VHL levels are high under normoxia and low under hypoxia.35 In glioma cells exposed to hypoxia, the level of VHL was observed to be low in comparison to its normoxic counterpart (Fig. 3 c). On FAT1 knockdown, there was no significant increase of VHL mRNA (Fig. 3 c); however, the levels of VHL protein were increased in both U87MG and U373MG cell lines (Fig. 3 c).
To further validate FAT1 regulated proteasomal degradation of HIF1α, glioma cells were treated with MG132 (proteasomal inhibitor) with and without FAT1 knockdown under hypoxia. Here, U87MG cell line was maintained under either normoxia or hypoxia followed by treatment with MG132 for 48 hr and levels of the HIF1α protein was determined by Western blot. Under normoxia, on treatment with MG132, there was a three fold increase in the level of HIF1α as compared to the untreated cells (Fig. 3 d). Under hypoxia, HIF1α protein was found to be four fold higher than their normoxic counterparts and the level was similar in both MG132 treated and untreated cells (Fig. 3 d), indicating the expected lack of proteasomal degradation of HIF1α under hypoxia. Next, we knocked‐down FAT1 and simultaneously treated with MG132. In hypoxic conditions, the HIF1α protein was found to be 4.5 folds higher after FAT1 knockdown with MG132 treatment, as compared to FAT1 knockdown‐MG132 untreated cells (Fig. 3 d). This indicates that even under hypoxia, glioma cells with FAT1 knockdown show increased proteasomal degradation of HIF1α. These findings suggest a regulatory effect of FAT1 on the status of HIF1α via proteasomal degradation in addition to the decreased synthesis of HIF1α via EGFR/Akt/mTOR pathway.
FAT1 regulation of HIF1α targets and metabolic activity in GBM cells
As HIF1α is known to regulate the expression of various genes including GLUT1, MCT4, REDD1 and HK2 which are known to be involved in anaerobic glycolytic pathway36; here, we analysed the effect of FAT1 on the expression of HIF1α target genes as well as the HIF1α regulated metabolic activity in gliomas. First, the expression of HIF1α target genes (CA9, VEGFA, GLUT1, MCT4, HK2, BNIP3 and REDD1) was analysed after FAT1 knockdown in cells maintained under hypoxia. The HIF1α target genes expression was found to be significantly upregulated under hypoxia in U87MG and U373MG cells; however, on FAT1 knockdown, there was significant reduction in the expression of all target genes in both the cell lines (Fig. 4 a). In general, effects of FAT1 knockdown on HIF1α target genes were modest in GOS3 cells as compared to GBM cell lines (Fig. 4 a).
Figure 4.
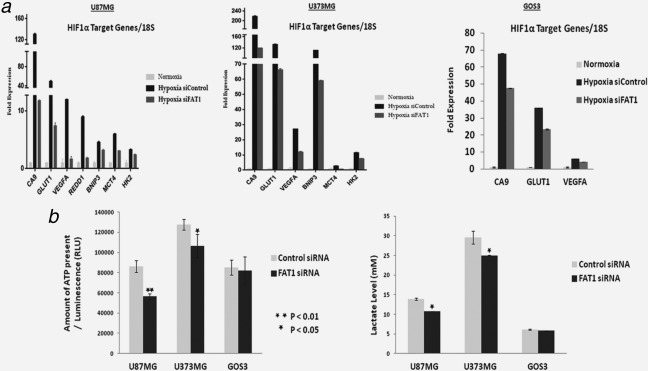
(a) Expression of HIF1α target genes on FAT1 knockdown in glioma cell lines maintained under hypoxia: q‐PCR analysis demonstrated increased expression of HIF1α target genes (CA9, VEGFA, GLUT1, REDD1, BNIP3, MCT4, HK2) in all the cell lines maintained under hypoxic (0.2% O2) condition for 72 hr; maximal in U87MG and U373MG followed by GOS3. On FAT1 knockdown, HIF1α target genes expression was significantly decreased by ∼80% in both U87MG and U373MG cell lines. Whereas, in Grade‐II glioma cell line (GOS3), the decrease in the expression of HIF1α target genes on FAT1 knockdown was only 30%. 18S was used as internal control. Experiment was done in triplicates. Each value is mean ± standard deviation. (b) Cellular ATP and Lactate levels in glioma cells after FAT1 knockdown under hypoxic conditions: Cellular ATP contents and lactate levels in cells after FAT1 knockdown were measured and compared with their respective siControl cells in all the glioma cell lines using ATP Assay Kit and Lactate Assay Kit respectively. Significant decrease in lactate and ATP level [(p ≤ 0.03) and (p ≤ 0.02), respectively] was observed in U87MG and U373MG cells on FAT1 knockdown. In GOS3, with low endogenous FAT1, there was no difference.
As there was significant reduction in the expression of HIF1α target genes in glioma cell lines after FAT1 knockdown under hypoxia, we measured the levels of lactate as well as ATP in these cell lines (U87MG, U373MGand GOS3). Significant decrease in the level of lactate (p ≤ 0.03) and ATP (p ≤ 0.02) after FAT1 knockdown was observed in U87MG and U373MG cells as compared to their respective control cells (Fig. 4 b).The decrease in the level of lactate and ATP molecules corroborated with the decreased expression of HIF1α regulated metabolic genes (CA9, GLUT1, MCT4 and HK2) observed after FAT1 knockdown under hypoxia (Fig. 4 a). In GOS3 cell line, as the basal expression of FAT1 was low as compared to GBM cell lines, the effect of FAT1 on HIF1α and its target genes was found to be minimal with no significant difference in the level of lactate and ATP with or without FAT1 knockdown under hypoxia (Fig. 4 b). These results suggest the importance of overexpressed FAT1 in regulating the expression of HIF1α and its target genes which further regulates the metabolic activity of GBM cells under hypoxia. Thus, the positive correlation between the mRNA expression of FAT1, HIF1α and its target genes observed in primary human GBM samples was further supported by our physiologically relevant models, establishing a positive regulatory effect of FAT1 on HIF1α activity under hypoxia.
FAT1 status control migration and invasion of glioma cells under hypoxia
We next analysed the effect of FAT1 on migration and invasion of glioma cells under hypoxia. We observed significant increase in the migratory (p < 0.01) as well as invasive (p < 0.05) properties of cells under hypoxia, as compared to their normoxic counterparts (Figs. 5 a and 5 b). However, on FAT1 knockdown, significant reduction in both migratory (p < 0.01) and invasive ability (p < 0.02) of glioma cells (U87MG and U373MG) was observed as compared to their respective controls under hypoxia (Figs. 5 a and 5b). In GOS3, with low endogenous FAT1 expression, the effect of FAT1 knockdown on migratory and invasive ability was significant but the fold effect was not as pronounced as was observed in U87MG and U373MG, with high endogenous FAT1 expression (Figs. 5 a and 5 b). This observation points to the important and critical role of FAT1 in cell migration and invasion under severe hypoxia. On analysing the effect of FAT1 knockdown on cell viability in U87MG cell line under severe hypoxia, we observed no difference in cell viability with and without FAT1 knockdown under hypoxia (Fig. 5 c). This finding reflects that transient FAT1 knockdown does not affect the glioma cell viability under hypoxia, similar to our earlier observation under normoxia.22
Figure 5.

(a,b) Effect of FAT1 knockdown on migration and invasion of glioma cells: (a) On FAT1 knockdown, significant reduction in migratory ability of U87MG (72%, p = 0.008), U373MG (70%, p = 0.001) and GOS3 (36%, p = 0.001) cells was found. Migration assay was done using Modified Boyden chamber assay. (b) The invasiveness of glioma cells transfected with FAT1 siRNA was reduced significantly in U87MG (74%, p = 0.016), U373MG (73%, p = 0.013) and GOS3 (55%, p = 0.021) cell lines. Invasion assay was done using Matrigel assay. As compared to GBM cell lines (U87MG and U373MG) the fold migration and invasion was lower in GOS3 cell line. Significant differences were observed in siFAT1 treated cells as compared to siControl cells as determined by Student's t test. (c) Cell viability after FAT1 knockdown: There was no change in cell viability as assessed by MTT after 24 hr, 48 hr and 72 hr of FAT1 knockdown under hypoxia; although minimal decrease observed in cell viability in both siControl and siFAT1 treated hypoxic cells at 72 hr could be due to the hypoxic stress. Each experiment was done in triplicates and repeated twice (d) Proposed FAT1 regulated signalling pathway affecting HIF1α expression under hypoxia in glioma cells: Under hypoxic condition, on FAT1 knockdown there was inhibition of EGFR/Akt/mTOR pathway and stimulation of VHL levels leading to decreased HIF1α level and its activity which in‐turn led to decreased HIF1α target genes expression in glioma cell lines.
Discussion
Several mechanisms regulate the stability and activity of HIF1α protein in both oxygen‐dependent and ‐independent manner. HIF1α is known to be mainly regulated by affecting its proteasomal degradation and translation. The oxygen dependent regulation of the HIF‐α subunit through its ubiquitin‐proteasomal degradation by the pVHL pathway has been well studied.37, 38 In addition, studies have reported oxygen independent degradation of HIF1α by other factors like SSAT2,37 os‐9,39 where these factors help in stabilising interaction of VHL with HIF1α, PHD, elongin C and so forth, thereby promoting HIF1α degradation. HIF1α is also known to be regulated by other mechanisms independent of VHL, involving heat shock protein (Hsp90), receptor of activated protein kinase (RACK1), MDM2 and so forth.40, 41, 42 In addition, numerous reports indicated that activation of EGFR/PI3K/Akt pathway (‐dependent and ‐independent of mTOR) is responsible for increased HIF1α translation under both normoxia and hypoxia.11, 16 Other signaling pathways like raf‐1‐MEK1‐ERK, Insulin‐like growth factors, EGFR and so forth10 and cytokines like IL1β and TNFα43 are also known to upregulate the level of HIF1α protein.
Here, we studied the regulatory role of FAT1 on HIF1α by knocking down FAT1 expression by siRNA in GBM cell lines under severe hypoxia. The indication that FAT1 could be linked to HIF1α regulation came from our analysis on primary GBM specimen were we observed statistically significant positive correlation of FAT1 with HIF1α (p = 0.04) and its target genes: PGK1 (p = 0.05) and VEGFA (p = 0.02) as well as our observation of augmented expression of both FAT1 and HIF1α on exposure of GBM (U87MG and U373MG) cell lines to severe hypoxia. We have also analysed the expression of FAT1 and HIF1α in 18 grade II astrocytoma samples. Similar to GBM, there is statistically significant positive correlation between FAT1 and HIF1α mRNA (Pearson coefficient: R 2 = 0.793, p < 0.001) in grade II astrocytomas, further strengthening the association between the two, irrespective of tumour grades.
Next, we carried out in vitro culture of GBM cell lines (U87MG and U373MG) under severe hypoxia (0.2% O2) where we observed increased expression of both FAT1 and HIF1α. HIF1α induction was observed as early as at 0.5 hr of severe hypoxia exposure at protein level (Supporting Information Fig S3), although this falls by about 6 hr. However, there is another rise in protein levels, at 48 hr which continued till 72 hr (Supporting Information Fig S6). As regards mRNA, while there was a small early rise of 1.24 folds at 0.5 hr, the levels started to decline by about 4 hr (Supporting Information Fig S3). However, there was a second rise (>2 folds) at 48 hr and 72 hr in HIF1α mRNA on long term hypoxia. We have not investigated the mechanisms behind this variable expression of HIF1α.
The mechanism of FAT1 over‐expression has not been studied in here. Negative expression of FAT1 has been correlated to gene deletion and promoter hypermethylation in oral cancer.27 A study in hepatocellular carcinoma by Valletta et al.25 have shown increased FAT1 expression under hypoxia and linked that to increased HGF (hepatocellular growth factor) and hypoxia related altered promoter methylation status.
Further confirmation of this hypothesis was carried out by knocking down FAT1 expression by siRNA in GBM (U87MG and U373MG) and grade‐II glioma (GOS3) cell lines. Knockdown of FAT1, under hypoxia, led to marked decrease in the level of HIF1α protein and HIF1α promoter activity in GBM (U87MG and U373MG) cell lines. Moreover, we also observed decreased expression of HIF1α mRNA on FAT1 knockdown under hypoxia. Although, studies have reported the role of miRNAs and other factors like N‐acetyltransferases (NAT) in regulating HIF1α mRNA expression,44, 45, 46 the mechanism involved in regulating HIF1α mRNA by FAT1 is yet to be elucidated. In addition, there was also marked decrease in expression of HIF1α‐regulated molecules like CA9, VEGFA, GLUT1, MCT4, HK2, BNIP3 and REDD1 on FAT1 knockdown under severe hypoxia. In GOS3, with low endogenous level of FAT1 with minimal effect of hypoxia on its expression, the differences were not as distinct as was observed in the GBM cell lines. However, the converse was not true, as HIF1α knockdown had no effect on FAT1 level.
In addition to HIF1α, HIF2α expression was also observed to be upregulated under hypoxia (Supporting Information Fig S4). To confirm whether HIF2α has any role in regulating FAT1 expression, HIF2α was knocked down in U87MG cell line and checked for the expression of FAT1. We observed no regulatory effect of HIF2α on FAT1 expression (Supporting Information Fig S4). Thus, ruling out the regulatory effect of HIF2α on FAT1 expression.
As, EGFR/PI3K/Akt pathway is known to be a potentially unifying pathway for oxygen independent HIF1α activation,10 we studied the effect of FAT1 knockdown on this pathway. On hypoxia exposure, we observed increased REDD1 mRNA levels and decreased p‐mTOR levels as compared to normoxic counterparts (Fig. 3 b). The reason for low mTOR levels under hypoxia could be due to known negative feedback loop between REDD1 and mTOR.47, 48 However, here, we have not conducted further detailed study in relation to this. On FAT1 knockdown, we observed decreased level of EGFR, p‐Akt and further reduction in p‐mTOR levels in GBM (U87MG and U373MG) cell lines under hypoxia. The reduction of p‐m‐TOR level on FAT1 knockdown (Figs. 3 a and 3 b) could be due to decreased EGFR and p‐Akt levels, leading to decreased HIF1α level on FAT1 knockdown, reflecting the regulatory role of FAT1 on HIF1α via EGFR/AKT/mTOR signalling.
In addition to the effect of FAT1 on synthetic pathway (EGFR/Akt/mTOR) of HIF1α, we also observed FAT1 to negatively regulate VHL level under hypoxia. Normally, VHL level is high under normoxia and is responsible for maintaining HIF1α protein at a low level by enhancing proteosomal degradation. Under hypoxia, VHL level remains low and thereby HIF1α is stable. In our study we observed higher VHL protein on knockdown of FAT1, abrogating the hypoxia induced reduction of VHL, thus resulting in the low HIF1α levels. The effect of FAT1 knockdown on VHL and HIF1α was further substantiated using the proteosomal inhibitor MG132 along with FAT1 knockdown, where we observed accumulation of HIF1α protein in cells treated with both siFAT1 and MG132 as compared to cells treated with siFAT1 alone. Thus, the reduced HIF1α level and activity observed under hypoxia on FAT1 depletion can be attributed to both decreased synthesis as well as increased proteasomal degradation of HIF1α.
In addition, other important hypoxia related cellular properties are also affected by FAT1. The effect of FAT1 in metabolic adaptation is evident from the reduction in ATP and lactate levels following FAT1 knockdown in hypoxia. This is possibly an effect of the modulation of HIF1α target genes GLUT1, HK2, MCT4 and REDD1, which are the known regulators of the metabolic (glucose) activity.36 The FAT1 induced increase in cellular migration and invasion under hypoxia was observed to be reduced on FAT1 knockdown in GBM cell lines.
Taken together, the results indicate that at least in glial tumours with upregulated FAT1, there is a major role of this atypical cadherin in the upregulation of HIF1α during severe hypoxia. This further affects metabolic adaptation and augments the invasive properties of the tumour cells. On the basis of these findings we conclude that FAT1 is a novel regulator of HIF1α under severe hypoxia via both EGFR/Akt/mTOR axis (synthetic) and VHL (proteasomal degradation) in GBM. This is the first report on the important role of FAT1 in modulating HIF1α expression and activity representing a novel pathway, essential for glioma progression and aggressiveness. This study raises the possibility of FAT1 acting as a regulator of the master regulator HIF1α (Fig. 5 d) and forming a link between hypoxia and cancer in glioma. This along with the positive association observed between FAT1 and HIF1α in GBM tumour tissues which initially suggested the regulatory role of FAT1 points to a clinical relevance for this cadherin in those GBMs where it is upregulated. While we have studied this pathway only in glioma, it is possible that this FAT1‐HIF1α axis is relevant in other tumour types as well. Till now, targeting HIF1α or other hypoxia markers/pathways as therapeutic strategies to treat cancers has had a limited success.49 The FAT Atypical Cadherin could possibly be a novel target for therapeutic intervention in gliomas with high FAT1 expression and hypoxic microenvironment.
Supporting information
Supporting Information
Acknowledgements
We would like to acknowledge Dr. Chinmay Mukhopadhyay for providing HIF1α promoter luciferase plasmid. We would like to thank Mr. Yakhlesh Gupta (JRF) and our Lab technician Ms. Jyoti, and Lab attendants Mr. Pappu, Mr. Gopal and Mr. Mukesh for their assistance in routine lab work and cell culture work.
Conflict of Interest: The authors declare no conflict of interest.
Contributor Information
Subrata Sinha, Email: kunzangchosdol@yahoo.com.
Kunzang Chosdol, Email: kchosdol@aiims.ac.in.
References
- 1. Stupp R, Mason WP, van den Bent MJ, et al. Radiotherapy plus concomitant and adjuvant temozolomide for glioblastoma. N Engl J Med 2005; 352:987–96. [DOI] [PubMed] [Google Scholar]
- 2. Teodorczyk M, Martin‐Villalba A. Sensing invasion: cell surface receptors driving spreading of glioblastoma. J Cell Physiol 222:1–10. [DOI] [PubMed] [Google Scholar]
- 3. Brat DJ, Mapstone TB. Malignant glioma physiology: cellular response to hypoxia and its role in tumor progression. Ann Intern Med 2003; 138:659–68. [DOI] [PubMed] [Google Scholar]
- 4. Sutherland RM. Tumor hypoxia and gene expression–implications for malignant progression and therapy. Acta Oncol 1998; 37:567–74. [DOI] [PubMed] [Google Scholar]
- 5. Wang GL, Jiang BH, Rue EA, et al. Hypoxia‐inducible factor 1 is a basic‐helix‐loop‐helix‐PAS heterodimer regulated by cellular O2 tension. Proc Natl Acad Sci USA 1995; 92:5510–4. [DOI] [PMC free article] [PubMed] [Google Scholar]
- 6. Kaur B, Khwaja FW, Severson EA, et al. Hypoxia and the hypoxia‐inducible‐factor pathway in glioma growth and angiogenesis. Neuro Oncol 2005; 7:134–53. [DOI] [PMC free article] [PubMed] [Google Scholar]
- 7. Mendez O, Zavadil J, Esencay M, et al. Knock down of HIF‐1alpha in glioma cells reduces migration in vitro and invasion in vivo and impairs their ability to form tumor spheres. Mol cancer 2010; 9:133. [DOI] [PMC free article] [PubMed] [Google Scholar]
- 8. Bao BB, Ahmad A, Kong D, et al. Hypoxia induced aggressiveness of prostate cancer cells is linked with deregulated expression of VEGF, IL‐6 and miRNAs that are attenuated by CDF. PLoS One 2012; 7:e43726. [DOI] [PMC free article] [PubMed] [Google Scholar]
- 9. Birner P, Schindl M, Obermair A, et al. Overexpression of hypoxia‐inducible factor 1alpha is a marker for an unfavorable prognosis in early‐stage invasive cervical cancer. Cancer Res 2000; 60:4693–6. [PubMed] [Google Scholar]
- 10. Fukuda R, Hirota K, Fan F, et al. Insulin‐like growth factor 1 induces hypoxia‐inducible factor 1‐mediated vascular endothelial growth factor expression, which is dependent on MAP kinase and phosphatidylinositol 3‐kinase signaling in colon cancer cells. J Biol Chem 2002; 277:38205–11. [DOI] [PubMed] [Google Scholar]
- 11. Zhong H, Chiles K, Feldser D, et al. Modulation of hypoxia‐inducible factor 1alpha expression by the epidermal growth factor/phosphatidylinositol 3‐kinase/PTEN/AKT/FRAP pathway in human prostate cancer cells: implications for tumor angiogenesis and therapeutics. Cancer Res 2000; 60:1541–5. [PubMed] [Google Scholar]
- 12. Hellwig‐Burgel T, Stiehl DP, Wagner AE, et al. Review: hypoxia‐inducible factor‐1 (HIF‐1): a novel transcription factor in immune reactions. J Interferon Cytokine Res 2005; 25:297–310. [DOI] [PubMed] [Google Scholar]
- 13. Kasuno K, Takabuchi S, Fukuda K, et al. Nitric oxide induces hypoxia‐inducible factor 1 activation that is dependent on MAPK and phosphatidylinositol 3‐kinase signaling. J Biol Chem 2004; 279:2550–8. [DOI] [PubMed] [Google Scholar]
- 14. Li J, Davidson G, Huang Y, et al. Nickel compounds act through phosphatidylinositol‐3‐kinase/Akt‐dependent, p70(S6k)‐independent pathway to induce hypoxia inducible factor transactivation and Cap43 expression in mouse epidermal Cl41 cells. Cancer Res 2004; 64:94–101. [DOI] [PubMed] [Google Scholar]
- 15. Mazure NM, Chen EY, Laderoute KR, et al. Induction of vascular endothelial growth factor by hypoxia is modulated by a phosphatidylinositol 3‐kinase/Akt signaling pathway in Ha‐ras‐transformed cells through a hypoxia inducible factor‐1 transcriptional element. Blood 1997; 90:3322–31. [PubMed] [Google Scholar]
- 16. Pore N, Jiang Z, Shu HK, et al. Akt1 activation can augment hypoxia‐inducible factor‐1alpha expression by increasing protein translation through a mammalian target of rapamycin‐independent pathway. Mol Cancer Res 2006; 4:471–9. [DOI] [PubMed] [Google Scholar]
- 17. Chakravarti A, Zhai G, Suzuki Y, et al. The prognostic significance of phosphatidylinositol 3‐kinase pathway activation in human gliomas. J Clin Oncol 2004; 22:1926–33. [DOI] [PubMed] [Google Scholar]
- 18. Dunne J, Hanby AM, Poulsom R, et al. Molecular cloning and tissue expression of FAT, the human homologue of the Drosophila fat gene that is located on chromosome 4q34‐q35 and encodes a putative adhesion molecule. Genomics 1995; 30:207–23. [DOI] [PubMed] [Google Scholar]
- 19. Bryant PJ, Huettner B, Held LI, Jr , et al. Mutations at the fat locus interfere with cell proliferation control and epithelial morphogenesis in Drosophila. Dev Biol 1988; 129:541–54. [DOI] [PubMed] [Google Scholar]
- 20. Hou R, Liu L, Anees S, et al. The Fat1 cadherin integrates vascular smooth muscle cell growth and migration signals. J Cell Biol 2006; 173:417–29. [DOI] [PMC free article] [PubMed] [Google Scholar]
- 21. Hou R, Sibinga NE. Atrophin proteins interact with the Fat1 cadherin and regulate migration and orientation in vascular smooth muscle cells. J Biol Chem 2009; 284:6955–65. [DOI] [PMC free article] [PubMed] [Google Scholar]
- 22. Dikshit B, Irshad K, Madan E, et al. FAT1 acts as an upstream regulator of oncogenic and inflammatory pathways, via PDCD4, in glioma cells. Oncogene 32:3798–808. [DOI] [PubMed] [Google Scholar]
- 23. Nishikawa Y, Miyazaki T, Nakashiro K, et al. Human FAT1 cadherin controls cell migration and invasion of oral squamous cell carcinoma through the localization of beta‐catenin. Oncol Rep 26:587–92. [DOI] [PubMed] [Google Scholar]
- 24. de Bock CE, Ardjmand A, Molloy TJ, et al. The Fat1 cadherin is overexpressed and an independent prognostic factor for survival in paired diagnosis‐relapse samples of precursor B‐cell acute lymphoblastic leukemia. Leukemia 2012; 26:918–26. [DOI] [PubMed] [Google Scholar]
- 25. Valletta D, Czech B, Spruss T, et al. Regulation and function of the atypical cadherin FAT1 in hepatocellular carcinoma. Carcinogenesis 35:1407–15. [DOI] [PubMed] [Google Scholar]
- 26. Morris LG, Kaufman AM, Gong Y, et al. Recurrent somatic mutation of FAT1 in multiple human cancers leads to aberrant Wnt activation. Nat Genet 2013; 45:253–61. [DOI] [PMC free article] [PubMed] [Google Scholar]
- 27. Nakaya K, Yamagata HD, Arita N, et al. Identification of homozygous deletions of tumor suppressor gene FAT in oral cancer using CGH‐array. Oncogene 2007; 26:5300–8. [DOI] [PubMed] [Google Scholar]
- 28. Chosdol K, Misra A, Puri S, et al. Frequent loss of heterozygosity and altered expression of the candidate tumor suppressor gene 'FAT' in human astrocytic tumors. BMC Cancer 2009; 9:5 [DOI] [PMC free article] [PubMed] [Google Scholar]
- 29. Bardos JI, Ashcroft M. Hypoxia‐inducible factor‐1 and oncogenic signalling. Bioessays 2004; 26:262–9. [DOI] [PubMed] [Google Scholar]
- 30. Gillespie DL, Whang K, Ragel BT, et al. Silencing of hypoxia inducible factor‐1alpha by RNA interference attenuates human glioma cell growth in vivo. Clin Cancer Res 2007; 13:2441–8. [DOI] [PubMed] [Google Scholar]
- 31. Irshad K, Mohapatra SK, Srivastava C, et al. A combined gene signature of hypoxia and notch pathway in human glioblastoma and its prognostic relevance. PLoS One 2015; 10:e0118201 [DOI] [PMC free article] [PubMed] [Google Scholar]
- 32. Mukhopadhyay CK, Mazumder B, Fox PL. Role of hypoxia‐inducible factor‐1 in transcriptional activation of ceruloplasmin by iron deficiency. J Biol Chem 2000; 275:21048–54. [DOI] [PubMed] [Google Scholar]
- 33. Yang HS, Matthews CP, Clair T, et al. Tumorigenesis suppressor Pdcd4 down‐regulates mitogen‐activated protein kinase kinase kinase kinase 1 expression to suppress colon carcinoma cell invasion. Mol Cell Biol 2006; 26:1297–306. [DOI] [PMC free article] [PubMed] [Google Scholar]
- 34. Huang LE, Gu J, Schau M, et al. Regulation of hypoxia‐inducible factor 1alpha is mediated by an O2‐dependent degradation domain via the ubiquitin‐proteasome pathway. Proc Natl Acad Sci USA 1998; 95:7987–92. [DOI] [PMC free article] [PubMed] [Google Scholar]
- 35. Ivan M, Kondo K, Yang H, et al. HIFalpha targeted for VHL‐mediated destruction by proline hydroxylation: implications for O2 sensing. Science 2001; 292:464–8. [DOI] [PubMed] [Google Scholar]
- 36. Denko NC. Hypoxia, HIF1 and glucose metabolism in the solid tumour. Nat Rev Cancer 2008; 8:705–13. [DOI] [PubMed] [Google Scholar]
- 37. Baek JH, Liu YV, McDonald KR, et al. Spermidine/spermine‐N1‐acetyltransferase 2 is an essential component of the ubiquitin ligase complex that regulates hypoxia‐inducible factor 1alpha. J Biol Chem 2007; 282:23572–80. [DOI] [PubMed] [Google Scholar]
- 38. Jaakkola P, Mole DR, Tian YM, et al. Targeting of HIF‐alpha to the von Hippel‐Lindau ubiquitylation complex by O2‐regulated prolyl hydroxylation. Science 2001; 292:468–72. [DOI] [PubMed] [Google Scholar]
- 39. Baek JH, Mahon PC, Oh J, et al. 9 interacts with hypoxia‐inducible factor 1alpha and prolyl hydroxylases to promote oxygen‐dependent degradation of HIF‐1alpha. Mol Cell 2005; 17:503–12. [DOI] [PubMed] [Google Scholar]
- 40. Flugel D, Gorlach A, Michiels C, et al. Glycogen synthase kinase 3 phosphorylates hypoxia‐inducible factor 1alpha and mediates its destabilization in a VHL‐independent manner. Mol Cell Biol 2007; 27:3253–65. [DOI] [PMC free article] [PubMed] [Google Scholar]
- 41. Joshi S, Singh AR, Durden DL. MDM2 regulates hypoxic hypoxia‐inducible factor 1alpha stability in an E3 ligase, proteasome, and PTEN‐phosphatidylinositol 3‐kinase‐AKT‐dependent manner. J Biol Chem 2014; 289:22785–97. [DOI] [PMC free article] [PubMed] [Google Scholar]
- 42. Liu YV, Baek JH, Zhang H, et al. RACK1 competes with HSP90 for binding to HIF‐1alpha and is required for O(2)‐independent and HSP90 inhibitor‐induced degradation of HIF‐ 1alpha. Mol Cell 2007; 25:207–17. [DOI] [PMC free article] [PubMed] [Google Scholar]
- 43. Jung YJ, Isaacs JS, Lee S, et al. IL‐1beta‐mediated up‐regulation of HIF‐1alpha via an NFkappaB/COX‐2 pathway identifies HIF‐1 as a critical link between inflammation and oncogenesis. Faseb J 2003; 17:2115–7. [DOI] [PubMed] [Google Scholar]
- 44. Janaszak‐Jasiecka A, Bartoszewska S, Kochan K, et al. miR‐429 regulates the transition between Hypoxia‐Inducible Factor (HIF)1A and HIF3A expression in human endothelial cells. Sci Rep 2016; 6:22775. [DOI] [PMC free article] [PubMed] [Google Scholar]
- 45. Mughal AA, Grieg Z, Skjellegrind H, et al. Knockdown of NAT12/NAA30 reduces tumorigenic features of glioblastoma‐initiating cells. Mol Cancer 2015; 14:160 [DOI] [PMC free article] [PubMed] [Google Scholar]
- 46. Zhang H, Zhu S, Zhang C, et al. [miR‐199a‐5p inhibits the proliferation of rat airway smooth muscle cells and the expression of hypoxia inducible factor 1 alpha under hypoxia conditions]. Xi Bao Yu Fen Zi Mian Yi Xue Za Zhi 2015; 31:1183–8. [PubMed] [Google Scholar]
- 47. Brugarolas J, Lei K, Hurley RL, et al. Regulation of mTOR function in response to hypoxia by REDD1 and the TSC1/TSC2 tumor suppressor complex. Genes Dev 2004; 18:2893–904. [DOI] [PMC free article] [PubMed] [Google Scholar]
- 48. Shoshani T, Faerman A, Mett I, et al. Identification of a novel hypoxia‐inducible factor 1‐responsive gene, RTP801, involved in apoptosis. Mol Cell Biol 2002; 22:2283–93. [DOI] [PMC free article] [PubMed] [Google Scholar]
- 49. Ziello JE, Jovin IS, Huang Y. Hypoxia‐Inducible Factor (HIF)‐1 regulatory pathway and its potential for therapeutic intervention in malignancy and ischemia. Yale J Biol Med 2007; 80:51–60. [PMC free article] [PubMed] [Google Scholar]
Associated Data
This section collects any data citations, data availability statements, or supplementary materials included in this article.
Supplementary Materials
Supporting Information