

Abstract
V‐type immunoglobulin domain‐containing suppressor of T‐cell activation (VISTA) is a negative checkpoint regulator (NCR) involved in inhibition of T cell‐mediated immunity. Expression changes of other NCRs (PD‐1, PD‐L1/L2, CTLA‐4) during inflammation of the central nervous system (CNS) were previously demonstrated, but VISTA expression in the CNS has not yet been explored. Here, we report that in the human and mouse CNS, VISTA is most abundantly expressed by microglia, and to lower levels by endothelial cells. Upon TLR stimulation, VISTA expression was reduced in primary neonatal mouse and adult rhesus macaque microglia in vitro. In mice, microglial VISTA expression was reduced after lipopolysaccharide (LPS) injection, during experimental autoimmune encephalomyelitis (EAE), and in the accelerated aging Ercc1 Δ/− mouse model. After LPS injection, decreased VISTA expression in mouse microglia was accompanied by decreased acetylation of lysine residue 27 in histone 3 in both its promoter and enhancer region. ATAC‐sequencing indicated a potential regulation of VISTA expression by Pu.1 and Mafb, two transcription factors crucial for microglia function. Finally, our data suggested that VISTA expression was decreased in microglia in multiple sclerosis lesion tissue, whereas it was increased in Alzheimer's disease patients. This study is the first to demonstrate that in the CNS, VISTA is expressed by microglia, and that VISTA is differentially expressed in CNS pathologies.
Keywords: autoimmunity, cancer, DD1alpha, immune checkpoints, immunotherapy, neurodegeneration, PD‐1H
1. INTRODUCTION
Immune checkpoint regulators are a group of molecules expressed on T cells or antigen‐presenting cells (APCs), which can provide co‐stimulatory and co‐inhibitory signals during T cell activation. This balance between positive and negative signals is essential for mounting antigen specific immune responses, while limiting the risk for autoimmunity. Inhibition of negative checkpoint regulator (NCR) activity has recently entered the clinic as a treatment for cancer, whereas activation of NCRs has potential for the treatment of autoimmunity. Therapeutic inhibition of NCR activity (immunotherapy) in cancer has been associated with the development of central nervous system (CNS) diseases such as encephalitis, myelitis, and exacerbation of multiple sclerosis (MS) (Cuzzubbo et al., 2017; Yshii, Hohlfeld, & Liblau, 2017). Accordingly, several studies have reported that inhibition of NCRs (CTLA4, PD‐1, and PD‐L1) in mouse experimental autoimmune encephalomyelitis (EAE), a model of MS, leads to exacerbation of symptoms (Joller, Peters, Anderson, & Kuchroo, 2012). Furthermore, blockade of PD‐1 in a mouse model of Alzheimer's disease (AD) improves cognitive performance (Baruch et al., 2016), suggesting a broad role of NCRs in CNS pathologies. However, the effectiveness of PD‐1 blockade in AD is still not resolved (Latta‐Mahieu et al., 2018).
V‐domain Ig‐containing suppressor of T cell activation (VISTA) is a recently discovered NCR, which shares 24% sequence similarity with PD‐L1 (Wang et al., 2011). VISTA (aliases: PD‐1H (Flies, Wang, Xu, & Chen, 2011); DD1α (Yoon et al., 2015); Dies1 (Aloia, Parisi, Fusco, Pastore, & Russo, 2010); Gi24 (Sakr et al., 2010)) is expressed on myeloid and T cells, and can act as both receptor and ligand (Lines, Sempere, Broughton, Wang, & Noelle, 2014). VISTA expressed on APC can function as a ligand, suppressing T‐cell activation upon binding to a yet unidentified counter receptor (Wang et al., 2011). In addition, ligation of VISTA expressed on T cells also leads to inhibition of T cell activation (Flies et al., 2014). Receptor functions on myeloid cells include regulation of the cytokine response (Bharaj et al., 2014) and uptake of apoptotic cells (Yoon et al., 2015). Deficiency of VISTA in mice increases susceptibility to developing autoimmunity such as EAE (Wang et al., 2014) and lupus nephritis (Ceeraz et al., 2016).
In the CNS, expression of several NCRs by microglia has been reported, which is induced under inflammatory conditions (Yshii et al., 2017). Microglia are the principal innate immune cell type of the CNS, which acquire diverse functional phenotypes in response to environmental cues (Salter & Beggs, 2014). During CNS pathologies, microglia lose their homeostatic signature and can shift to an immune‐activated state, as evident from transcriptomic studies (Perry & Holmes, 2014; Zrzavy et al., 2017). During immune activation, microglia upregulate inflammatory genes such as genes involved in cytokine production and antigen presentation. It is now appreciated that in conditions such as AD and aging, microglia can acquire a phagocytic phenotype (Galatro et al., 2017a; Krasemann et al., 2017; Varol et al., 2017), thereby facilitating clearance of debris and toxins. In accordance with a more protective phenotype during disease, microglia obtain immunoregulatory characteristics during inflammation. Induction of NCRs (e.g., PD‐L1) in immune‐activated microglia causes inhibition of T cell activation, and suppression of cytokine production (Duncan & Miller, 2011; Magnus, 2005; Schachtele, Hu, Sheng, Mutnal, & Lokensgard, 2014). Hence, microglial activation is highly heterogeneous and plastic, and can therefore be detrimental or beneficial during disease.
Although the expression and regulation of several NCRs in the CNS and by microglia has been studied, expression patterns of VISTA are unknown as noted recently by Yshii et al. (2017). Studies suggest involvement of VISTA in important functions of monocytes and macrophages, such as cytokine responses and phagocytosis, which exhibit functional similarities to microglia. As microglia express many NCRs and are able to acquire immunoregulatory functions during inflammation, analysis of VISTA expression in these cells could help to understand their role in CNS disease. Furthermore, NCR modulation as a treatment for cancer and autoimmunity impacts CNS biology, which is demonstrated by adverse neurological effects during immunotherapy including encephalitis, myelitis, hypophysitis, and transition from radiologically isolated syndrome to MS (Cuzzubbo et al., 2017; Yshii et al., 2017). Hence, investigating expression and expression changes of VISTA in the CNS might facilitate understanding the impact of NCR modulation on the CNS.
Here, we assessed VISTA expression in mouse and rhesus macaque microglia after immune‐activation in vitro and in vivo, and verified our findings using human postmortem tissue. Our results indicate that VISTA is differentially expressed in microglia during inflammation and neurodegeneration. Furthermore, we determined epigenetic changes in the VISTA gene during microglial activation in mice. These findings provide first evidence of a function of VISTA in microglia and during CNS pathology.
2. MATERIALS AND METHODS
2.1. Animals
All animal experiments were approved by the Netherlands Central Committee for Animal Experiments and the University of Groningen. Mice were housed SPF in groups in macrolon cages with ad libitum access to water and food, and a 12 hr light–dark cycle. Eight‐week‐old male C57BL/6 mice (bred in‐house) were injected with 1 mg/kg LPS (E. coli 0111:B4, Sigma‐Aldrich, L4391) intraperitoneally and sacrificed 24 hr later. To generate Ercc1 Δ/− mice, Ercc1 Δ/+ Fvb mice were bred with Ercc1 +/− C57BL/6 mice. Genotype was confirmed using PCR and Ercc1 Δ/− mice were matched with wildtype littermates of the same sex. After 3–4 months of age, Ercc1 Δ/− mice started to develop tremors and aberrant behavior, and were sacrificed. For induction of EAE, 10‐week‐old female C57BL/6 mice (Harlan, The Netherlands) were immunized with MOG35–55 in complete Freund's adjuvant (CFA) (Hooke, EK‐2110) and injected with pertussis toxin on the day of immunization and 24 hr later. Mice were monitored daily for development of EAE and sacrificed at score 1 (limp tail), score 4 (complete hind leg paralysis), and remission (partial regain of movement in hind legs).
2.2. Acute microglia isolation
Microglia were isolated as described previously (Galatro, Vainchtein, Brouwer, Boddeke, & Eggen, 2017b). Briefly, mice were perfused using PBS (Lonza, BE17‐512F) and brain and spinal cord were isolated in HBSS (Gibco, 14170‐088) containing 15 mM HEPES (Lonza, BE17‐737E) and 0.6% glucose (Sigma‐Aldrich, G8769) (=Medium A). Tissue was mechanically disrupted to obtain a single cell suspension and myelin was removed using 24.4% percoll (GE Healthcare, 17‐0891‐01) density gradient centrifugation at 950g. Cells were incubated 15 min in anti‐Cd16/32 blocking buffer (clone 93, eBioscience, 14‐0161‐85) and stained with anti‐Cd11b‐PE‐Cy7 (clone M1/70, eBioscience, 25‐0112‐81), anti‐Cd45‐FITC (clone 30‐F11, eBioscience, 11‐0451‐85), and anti‐Ly6c‐APC (clone HK1.4, Biolegend, 128016) antibodies 30 min on 4°C. Cells were sorted on a MoFlo XDP Cell Sorter (Beckman Coulter) in RNAlater (Qiagen, 76104) in siliconized tubes. Sorted cells were centrifuged at 5,000g (RNAlater) and lysed in RLT+ lysis buffer (Qiagen, 74034).
2.3. Immunohistochemistry
Immunohistochemical staining was performed on formalin‐fixed paraffin‐embedded (FFPE) or paraformaldehyde (PFA)‐fixed frozen tissue as indicated. Briefly, FFPE tissue was deparaffinized in xylene (J.T. Baker, 9490) and rehydrated. For human tissue, sodium citrate (pH 6.0) heat‐induced antigen retrieval was performed in a microwave using a pressure cooker, whereas Tris–EDTA (pH 9.0) was used for mouse tissue. Endogenous peroxidase activity was blocked in 0.3% hydrogen peroxide for 30 min and mouse tissue was additionally blocked in 10% normal serum. Primary antibodies were applied at 4°C overnight (Supporting Information, Table S1). For human tissue, primary antibodies were diluted in Normal Antibody Green Bright Diluent (ImmunoLogic, BD09‐500). Fluorophore‐conjugated (Molecular Probes) or biotinylated (Vector) secondary antibodies were applied for 1 hr at room temperature (RT). For fluorescence staining, tissue was incubated 10 min in Hoechst and human tissue was treated with 0.3% sudan black to quench autofluorescence. Tyramide Superboost streptavidin kit (Invitrogen, B40933) was used for VISTA (clone MH5a) according to manufacturer's instructions. For enzymatic immunostaining, tissue was incubated 30 min in Vectastain Elite ABC‐HRP (Vector, PK‐6100) and immunoreactivity was revealed using 3,3′‐diaminobenzidine.
2.4. Primary mouse neonatal microglia culture
Primary neonatal mouse microglia cultures were prepared as described previously (Schaafsma et al., 2015) with minor deviations. Briefly, cerebrum from postnatal day 0–2 C57BL/6 mice was minced and incubated in trypsin‐containing medium. After trituration and centrifugation of tissue, cells were plated in flasks and medium (DMEM (Gibco, 11500416), supplemented with 1 mM sodium pyruvate (Lonza, BE13‐115E), 1× GlutaMAX (Gibco, 35050038), 1% Pen/strep, and 10% FCS (Gibco, 10500064)) was replaced 24 hr later. Medium was replaced on Day 4, and on Day 7, medium supplemented with 33% L929 cell‐conditioned medium (LCCM) was added. LCCM contains M‐CSF to stimulated microglia proliferation. Three days after LCCM addition, microglia were harvested through shake off and seeded at 30,000 cells/cm2 in 12‐well plates. Twenty‐four hours after seeding, primary neonatal microglia were simulated with 100 ng/ml Pam3CSK4 (Invivogen, #tlrl‐pms), 100 ng/ml LPS (E. coli 0111:B4, Sigma‐Aldrich, L4391), 50 μg/ml PolyI:C (Invivogen, #tlrl‐pic), or 10 μg/ml β‐glucan (Sigma‐Aldrich, G5011).
2.5. Primary adult rhesus macaque microglia culture
Primary adult rhesus macaque (Macaca mulatta) microglia cultures were isolated from post mortem brain tissue and cultured as described previously (Burm et al., 2015). Briefly, male or female rhesus macaque monkeys (4–9 years old) without neurological symptoms were housed in outbred breeding colonies. No monkey was sacrificed exclusively for the generation of the primary cultures. Cubes of 3 g of subcortical white matter brain tissue were mechanically and enzymatically dissociated and centrifuged. A percoll gradient was used to remove myelin; other CNS cells and erythrocytes were removed by exposure to hypotonic solution. Isolated microglia were cultured in DMEM (high glucose)/HAM F10 Nutrient Mixture (supplemented with 10% v/v heat‐inactivated FCS, 0.5 mm glutamax, 50 U/ml penicillin, and 50 μg/ml streptomycin) (Thermo Fisher). After 24 hr, nonadherent cells and cellular debris were removed and fresh medium containing 20 ng/ml macrophage colony‐stimulating factor (M‐CSF) (Peprotech) was added. After 7 days in culture, microglia were treated for 16 hr with 500 ng/ml Pam3CSK4 (Invivogen), 20 μg/ml Poly I:C (Invivogen), 100 ng/ml LPS (E. coli 026:B6, Sigma‐Aldrich, L8274), or 1 μg/ml CL075 (Invivogen, #tlrl‐c75).
2.6. Gene expression analysis
For quantitative PCR analysis, total RNA was isolated using TRIzol (Invitrogen, 15596018) (primary microglia) or the RNeasy Micro Plus Kit (Qiagen, 74034) (acutely isolated microglia) according to the manufacturers protocol. Total RNA was reverse‐transcribed using the RevertAid First Strand cDNA Synthesis kit (Thermo Fisher, K1622). Quantitative PCR was performed using exon–exon spanning primers pairs (Biolegio) (Supporting Information, Table S2), iTag Universal SYBR Green Supermix (Bio‐Rad, 172‐5125), and a QuantStudio 7 Flex (Thermo Fisher).
2.7. Flow cytometry
Primary microglia were harvested using Accutase (Sigma‐Aldrich, A6964) and resuspended in medium (HBSS without phenol red (Gibco, 14175‐053), supplemented with 15 mM HEPES, 0.6% glucose, and 1 mM EDTA (Invitrogen, 15575‐020)) after centrifugation. Cells were incubated 15 min on ice in anti‐Cd16/32 Fc blocking solution and subsequently stained with PE‐conjugated anti‐VISTA (clone MIH63, Biolegend, 150204) 30 min on RT. After washing, cells were analyzed on a MacsQuant (Miltenyi Biotec) flow cytometry analyzer. Dapi was used to distinguish dead cells.
2.8. Transcription factor motif enrichment analysis
To determine potential TF binding motifs in ATAC‐seq peaks, a motif enrichment analysis was performed using the motif discovery software HOMER (version 4.9) (Salk Institute and University of California San Diego) (Heinz et al., 2010). Peaks on the VISTA locus (eight in total) were identified in Integrative Genomics Viewer (Broad Institute and University of California) and sequences were used for HOMER enrichment analysis (findMotifs, homer2). HOMER analysis determines motifs enriched in sequences compared to scrambled sequences.
2.9. Statistical analysis
Statistical analyses were performed using GraphPad Prism 7 (GraphPad Software, Inc.). For multiple comparison after LPS and TLR experiments, a one‐way ANOVA including Dunnett's test for multiple comparison was used. For comparison of gene expression in LPS‐injected mice and Ercc1 Δ/−, a (un)paired Student's t test was performed. All error bars indicate mean ± standard deviation (SD).
3. RESULTS
3.1. VISTA is primarily expressed by microglia in human and mouse CNS
Expression of most NCRs (CTLA4, PD‐1, PD‐L1, and more), but not VISTA, has been reported in the CNS by microglia, endothelial cells, astrocytes, oligodendrocytes, and/or neurons (Yshii et al., 2017). Using a combination of immunohistochemistry and flow cytometry, we assessed VISTA expression in mouse and human brain.
In both mouse and human brain tissue without apparent CNS pathology, VISTA immunoreactivity was evident on ramified microglia‐like cells and on blood vessel structures (Figure 1a,b). Immunofluorescence co‐staining of Iba1 and VISTA (mouse) and CD68 and VISTA (human) revealed a strong co‐expression of these proteins (Figure 1c,d), confirming VISTA expression in microglia.
Figure 1.
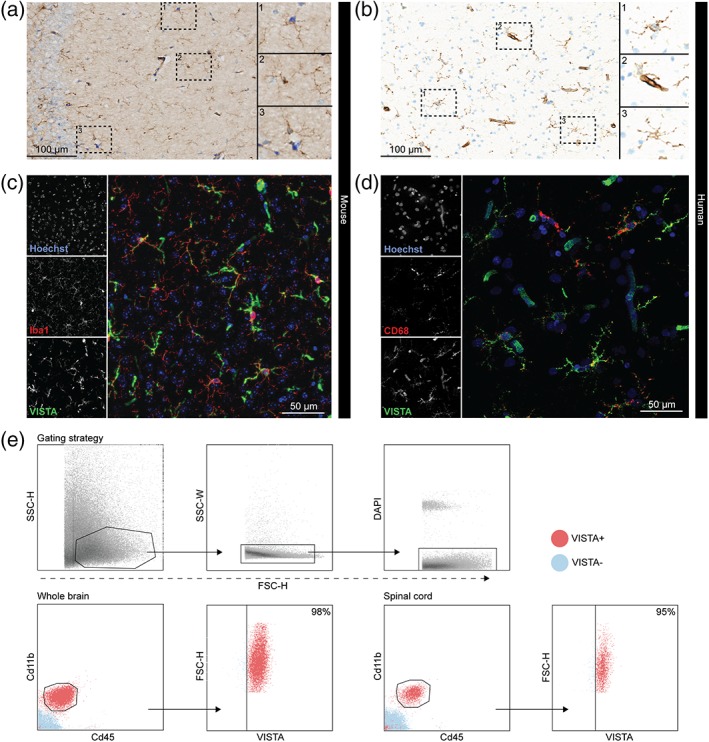
VISTA is expressed by microglia in mouse and human CNS. (a,b) Representative images of VISTA immunoreactivity in mouse (a) (n = 2) and human brain (b) (n = 4). Inserts show a 2× magnification of areas (1–3) as indicated. (c,d) Representative images of co‐expression of Iba1 (red) and VISTA (green) in mouse brain (c) (n = 2) and CD68 (red) and VISTA (green) in human brain (d) (n = 4). (e) Representative flow cytometry results of VISTA cell surface expression in Cd11b+ Cd45int microglia from brain (n = 4) and spinal cord (n = 1) [Color figure can be viewed at wileyonlinelibrary.com]
In accordance with the immunostainings, flow cytometry of whole mouse brain and spinal cord showed that >95% of Cd11b+ Cd45int microglia exhibited surface VISTA expression. Furthermore, the vast majority of Cd11b− Cd45− cells did not express detectable levels of cell surface VISTA (Figure 1e).
These findings demonstrate that VISTA is primarily expressed by microglia, and to a lesser extent in blood vessels in the CNS.
3.2. VISTA expression is abundant in adult microglia and expression levels are similar to microglia signature genes
To confirm our observations of VISTA expression in microglia and blood vessels, we analyzed published RNA‐seq data for VISTA expression in different CNS cell types (Zhang et al., 2014, 2016). In mouse brain, VISTA was abundantly expressed by microglia, weakly expressed by endothelial cells, and was not detected in oligodendrocytes, neurons, and astrocytes (Figure 2a). In human brain, VISTA was expressed by microglia, but also at moderate levels by endothelial cells, and at low levels by astrocytes (Figure 2b). VISTA expression was very low in oligodendrocytes and neurons. Of note, we did not observe any VISTA immunoreactivity in astrocytes (Figure 1a,b). Expression by endothelial cells is in line with our previous findings of VISTA expression in blood vessels.
Figure 2.
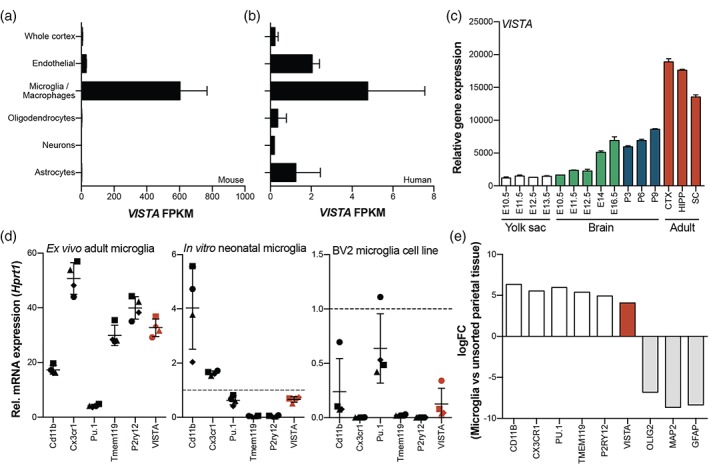
VISTA expression is abundant in adult microglia and levels are similar to microglia signature genes. (a,b) VISTA mRNA levels (FPKM) in different CNS cell types of mouse (a) and human (b), derived from published RNA‐seq data (Zhang et al., 2014, 2016). (c) Relative gene expression levels of VISTA during microglia development in embryonic yolk sac, brain, and during postnatal development until adulthood, derived from published RNA‐seq data (Matcovitch‐Natan et al., 2016). (d) Relative mRNA expression levels of VISTA in sorted adult microglia, cultured primary neonatal microglia, and BV2 cells, measured using RT‐qPCR and normalized to Hprt1. (e) LogFC of VISTA enrichment in sorted human microglia (n = 39) compared to unsorted cortical tissue (n = 16), derived from published RNA‐seq data (Galatro et al., 2017a). Error bars indicate mean ± SD. FPKM = fragments per kilobase per million [Color figure can be viewed at wileyonlinelibrary.com]
Next, we investigated a published RNA‐seq dataset to determine VISTA expression in isolated mouse microglia during embryonic and postnatal development (Matcovitch‐Natan et al., 2016). The analysis revealed that VISTA expression increases during microglia development (Figure 2c) and was most abundant in adult microglia, independent of the CNS region (hippocampus, cortex, and spinal cord) (Figure 2c).
To further quantify VISTA expression in adult microglia, we compared VISTA mRNA levels to the expression of microglia signature genes. In acutely isolated adult microglia from mouse brain, VISTA was abundantly expressed, similar to levels of Tmem119 and P2ry12, and other microglia signature genes (Figure 2d). In cultured neonatal mouse microglia and the BV2 microglial cell line, VISTA expression was moderate, comparable to expression of Pu.1 (neonatal microglia) or Cd11b (BV2) (Figure 2d). For quantification of VISTA in human microglia, we analyzed our published RNA‐seq dataset of microglia isolated from adult nondiseased human postmortem brain (Galatro et al., 2017a). VISTA expression was enriched in microglia compared to unsorted parietal cortex tissue (logFC 4.1), an enrichment comparable to what was observed for microglia signature genes TMEM119, P2RY12, PU.1, and CD11B (Figure 2e).
In summary, these data demonstrate that VISTA is abundantly expressed by adult human and mouse microglia, and that expression is comparable to microglia signature genes.
3.3. TLR stimulation of primary neonatal mouse and adult rhesus macaque microglia in vitro leads to downregulation of VISTA expression
Previous studies have reported an upregulation of several NCRs (PD‐1, PD‐L1, and PD‐L2) in microglia and other CNS cells during inflammatory conditions, suggesting a role for NCRs in CNS inflammation. To investigate the expression changes of VISTA during inflammation, we stimulated neonatal mouse microglia and adult rhesus macaque microglia with various TLR agonists in vitro and determined changes in VISTA mRNA levels.
After stimulation of TLR1/2, 3, 4, and 2/6, VISTA expression was significantly decreased in neonatal mouse microglia by up to 70% (Figure 3a). In contrast, Pdl1 expression was increased as described in literature (Yshii et al., 2017) (Figure 3b). VISTA mRNA decreased as early as 1–2 hr after LPS stimulation and remained reduced up to 12 hr post‐LPS exposure (Figure 3c). Consistently, stimulation of TLR1/2, 3, 4, and 8 in adult rhesus macaque microglia in vitro also decreased VISTA expression (Figure 3d).
Figure 3.
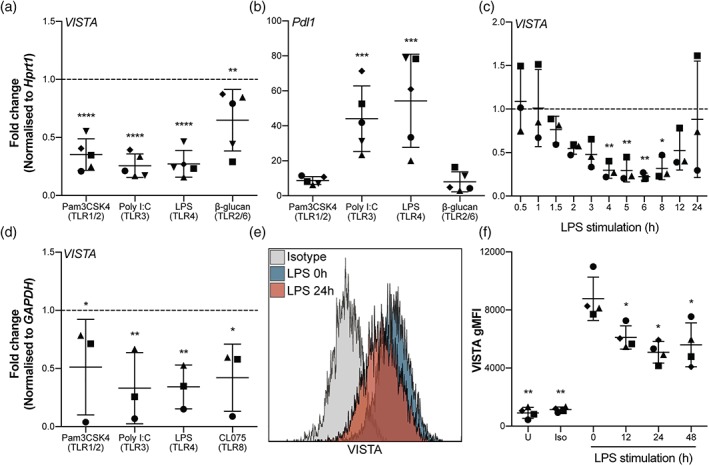
TLR stimulation leads to decreased VISTA expression in primary neonatal mouse and adult macaque microglia in vitro. (a,b) Fold change in VISTA (a) and Pdl1 (b) mRNA in primary neonatal mouse microglia measured using RT‐qPCR after 4 hr stimulation with Pam3CSK4 (TLR1/2), PolyI:C (TLR3), LPS (TLR4), and β‐glucan (TLR2/6) compared to untreated control (n = 5). (c) Fold change in VISTA mRNA in primary neonatal mouse microglia after LPS (TLR4) stimulation over time (0–24 hr) compared to untreated control (n = 3). (d) Fold change in VISTA mRNA in primary adult rhesus macaque microglia after 16 hr stimulation with Pam3CSK4 (TLR1/2), PolyI:C (TLR3), LPS (TLR4), and CL075 (TLR8) compared to untreated control (n = 3). (e) Representative flow cytometry histogram showing VISTA cell surface expression in primary neonatal mouse microglia after 0 and 24 hr LPS stimulation. (f) Geometric mean fluorescence intensity (gMFI) of VISTA in primary neonatal mouse microglia upon (0, 12, 24, and 48 hr) LPS stimulation (n = 4). Statistical analysis conducted was a one‐way ANOVA with Dunnett's test for multiple comparisons. Error bars indicate mean ± SD. *p < .05, **p < .01, ***p < .001, ****p < .0001 [Color figure can be viewed at wileyonlinelibrary.com]
To show that VISTA surface protein is downregulated as well upon TLR stimulation, flow cytometry on in vitro LPS‐stimulated primary neonatal mouse microglia was performed. VISTA expression was significantly reduced 12–48 hr after LPS stimulation (Figure 3e,f). Whereas the number of VISTA positive microglia decreased only mildly (~10% at 24 hr post‐LPS) (Figure 3e), the geometric mean fluorescence intensity (gMFI), which reflects surface VISTA levels per cell, was strongly reduced (~50% at 24 hr post‐LPS) (Figure 3f).
Following all TLR stimulations, Tnfα expression was induced in microglia, demonstrating their immune activation in this experimental setup (Supporting Information, Figure S1).
Our experiments show that VISTA expression is decreased in microglia in response to a range of TLR agonists, which is in contrast to the increased expression of PD‐L1 and other NCRs (Yshii et al., 2017).
3.4. VISTA expression is reduced upon microglial activation in vivo
In view of the reduced VISTA expression after TLR stimulation of microglia in vitro, we next investigated changes in VISTA expression after microglial activation and inflammation in vivo.
To address changes in microglia VISTA expression during CNS inflammation, we isolated microglia from mouse CNS at different stages of EAE (induced by MOG35–55 in CFA), which is a mouse model of MS. During acute stages of EAE (disease score 1 and 4) microglia obtain a weak immune‐activated phenotype (Vainchtein et al., 2014), indicated by increased levels of Il1β (Supporting Information, Figure S2a). In remission, increased Axl and MHC‐II component H2Aa expression suggest a phagocytic and antigen‐presenting phenotype of microglia (Supporting Information, Figure S2a). We observed a significant decrease in VISTA expression in all stages of EAE (score 1, 4, and remission) in spinal cord, hindbrain, and forebrain microglia compared to nonimmunized mice (Figure 4a). In contrast, Pdl1 was upregulated in all conditions (Figure 4b).
Figure 4.
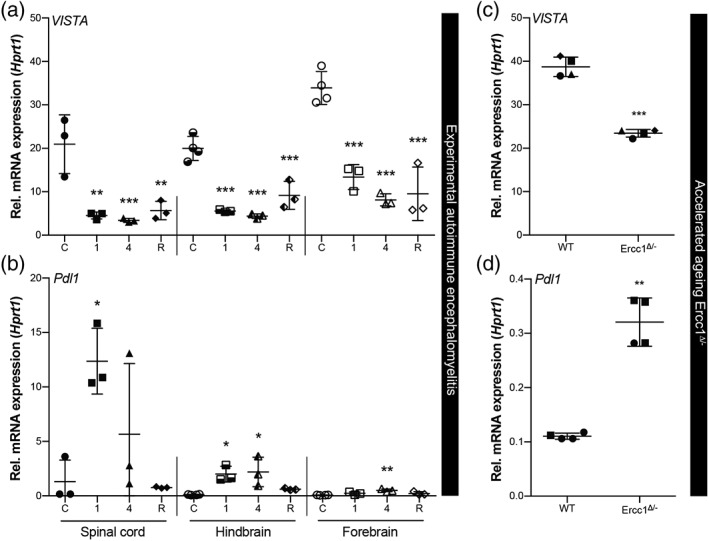
VISTA expression is reduced in adult microglia in mouse models of CNS pathology. VISTA (a + c) and Pdl1 (b + d) mRNA levels in acutely isolated adult microglia from spinal cord, hindbrain and forebrain during EAE disease course (C = control, 1 = disease score 1, 4 = disease score 4, R = remission) (a + b), and from whole brain of accelerated aging Ercc1 Δ/− mice and WT littermates (c + d), measured using RT‐qPCR and normalized to Hprt1. Statistical analysis conducted was a one‐way ANOVA with Dunnett's test for multiple comparisons (a + b) and a paired Student's t test for direct comparisons (c + d). Error bars indicate mean ± SD. WT = wild type, *p < .05, **p < .01, ***p < .001
To further assess VISTA expression changes during microglial activation, we quantified VISTA mRNA in microglia isolated from Ercc1 Δ/− mice. Ercc1 is a protein essential for nucleotide excision DNA repair and mutant mice display an accelerated aging phenotype (Vermeij et al., 2016). Microglia from whole brain of 4‐month‐old Ercc1 Δ/− mice exhibited increased Il1β and Axl expression (Supporting Information, Figure S2b), indicating an immune‐activated and phagocytic phenotype. VISTA expression in these microglia was significantly reduced compared to wild type (WT) littermates (Figure 4c), whereas Pdl1 expression was increased (Figure 4d).
These data demonstrate that VISTA expression is decreased in microglia in different mouse models of CNS inflammation and during microglial activation, which is in line with our in vitro observations.
3.5. Reduced VISTA expression in LPS‐activated microglia is accompanied by chromatin remodeling
To determine if changes in VISTA expression are accompanied by epigenetic alterations, we analyzed a recently generated dataset containing genome‐wide transcriptional changes (RNA‐seq), histone modifications (ChIP‐seq), and chromatin accessibility (ATAC‐seq) in isolated microglia after LPS exposure in mice (Zhang et al., in press).
RNA‐seq data indicated that VISTA expression is reduced in acutely isolated microglia 3 hr after LPS injection (Figure 5a), whereas Pdl1 expression was upregulated (Figure 5b). These results are in line with our previous observations of decreased VISTA expression in microglia during EAE and in Ercc1 Δ/− mice. VISTA is located within an intronic region of CDH23, a gene associated with auditory function (Johnson et al., 2017). Cdh23 was not altered in response to LPS, demonstrating that changes in VISTA expression were independent of the Cdh23 gene (Supporting Information, Figure S3a).
Figure 5.
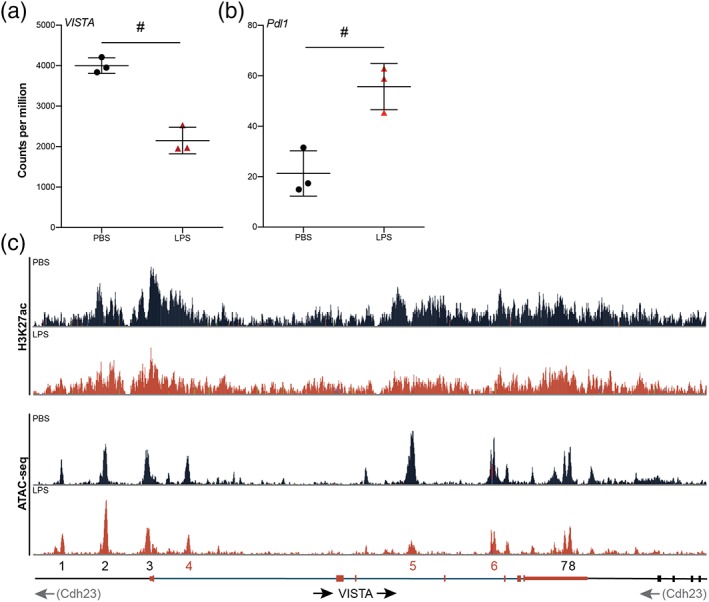
Decreased VISTA expression after LPS injection is associated with chromatin remodeling in microglia. (a,b) RNA‐seq counts per million of VISTA (a) and Pdl1 (b) mRNA expression (n = 3). (c) H3K27ac histone acetylation (top) and ATAC‐seq (bottom) peaks corresponding to the VISTA gene (n = 3). ATAC‐seq peaks were numbered 1–8 and peaks that were decreased after LPS stimulation are indicated in red (4–6). Data are derived from previously generated datasets (Zhang et al., in press). Transcription factor binding motifs enriched in these peaks are listed in Table 1. Error bars indicate mean ± SD. # = differential expression (DE) based on RNA‐seq analysis [Color figure can be viewed at wileyonlinelibrary.com]
To determine if decreased VISTA expression is accompanied by epigenetic changes in the gene locus, we analysed ChIP‐seq and ATAC‐seq datasets. Concomitant with reduced VISTA expression after LPS exposure, we observed decreased H3K27 histone acetylation (H3K27ac) upstream of the VISTA gene (Figure 5c). H3K27ac is enriched on enhancers and associated with active gene transcription.
We next assessed chromatin accessibility using ATAC‐seq data. ATAC‐seq provides information about transposase‐accessibility of chromatin at specific locations on the genome (Buenrostro, Wu, Chang, & Greenleaf, 2015). Transposase‐accessible chromatin is also accessible for transcription factors (TF) and indicated as Peaks (1–8) on the VISTA gene (Figure 5c). Enrichment analysis for putative TF binding motifs revealed that 17 consensus sequences were significantly enriched in the DNA underlying these peaks (Table 1). Consensus binding sites for Pu.1 (Spi1) and Mafb were among the most significantly enriched TF motifs, and both proteins are crucial for microglia function (Matcovitch‐Natan et al., 2016; Smith et al., 2013). In DNA sequences of ATAC peaks that were reduced in microglia after LPS injection, we detected consensus binding sites for Pu.1, Rfx6, Elf5, and Sox15 (Peaks 4–6) (Figure 5c and Table 1). In contrast, Ap4 and Nf1 binding motifs were enriched in DNA sequences of peaks unaltered by LPS stimulation (Peaks 1–3, 7–8) (Figure 5c and Table 1).
Table 1.
Transcription factor motifs enriched in ATAC‐seq peaks on the VISTA gene (ordered from high to low enrichment score) [Color table can be viewed at wileyonlinelibrary.com]
| Motif | Consensus | p value | q value (benjamini) | # Peaks with motif (of 8) |
|---|---|---|---|---|
| Pu.1 | AGAGGAAGTG | 1,00E‐05 | 0.0017 | 5.0 |
| Rfx6 | TGTTKCCTAGCAACM | 1,00E‐04 | 0.0079 | 7.0 |
| Elf5 | ACVAGGAAGT | 1,00E‐03 | 0.0184 | 5.0 |
| Sox15 | RAACAATGGN | 1,00E‐03 | 0.0548 | 4.0 |
| Mafb | WNTGCTGASTCAGCANWTTY | 1,00E‐03 | 0.0675 | 3.0 |
| Zfp281 | CCCCTCCCCCAC | 1,00E‐02 | 0.1110 | 2.0 |
| Nr5a2 | BTCAAGGTCA | 1,00E‐02 | 0.1110 | 2.0 |
| Znf143 | ATTTCCCAGVAKSCY | 1,00E‐02 | 0.1110 | 2.0 |
| Klf10 | GGGGGTGTGTCC | 1,00E‐02 | 0.1247 | 3.0 |
| Ap4 | NAHCAGCTGD | 1,00E‐02 | 0.1657 | 4.0 |
| Scl | AVCAGCTG | 1,00E‐02 | 0.2013 | 8.0 |
| Prdm14 | RGGTCTCTAACY | 1,00E‐02 | 0.2013 | 2.0 |
| Fxr, Ir1 | AGGTCANTGACCTB | 1,00E‐02 | 0.2013 | 2.0 |
| MafK | GCTGASTCAGCA | 1,00E‐02 | 0.2013 | 2.0 |
| Sox4 | YCTTTGTTCC | 1,00E‐02 | 0.2013 | 4.0 |
| Elf3 | ANCAGGAAGT | 1,00E‐02 | 0.2225 | 3.0 |
| Nf1 | YTGCCAAG | 1,00E‐02 | 0.2225 | 6.0 |
Motifs enriched in peaks decreased upon LPS (Peaks 4–6).
Motifs enriched in peaks unchanged upon LPS (Peaks 1–3, 7, and 8).
Motifs enriched in both unchanged peaks and peaks decreased by LPS.
Our findings show that reduced VISTA expression is accompanied by altered histone modification enrichments and changes in chromatin accessibility that are associated with transcriptional repression. Furthermore, the presence of consensus binding sites for Pu.1 and Mafb on chromatin accessible DNA on the VISTA gene suggests that VISTA may be regulated by these microglia‐specific TF, and that reduced accessibility of Pu.1, Elf5, and Sox15 to consensus binding sites in VISTA underlie reduced expression in response to LPS.
3.6. VISTA expression is differentially regulated in the human CNS
In view of the observed reduction in VISTA expression during microglial activation in vitro and in vivo, we next assessed VISTA expression in human brain tissue of young and old individuals, and in septicemia, MS and AD patients (Supporting Information, Table 3). Based on neuropathological evaluations, one representative patient was selected for analysis of each condition.
Using IBA1 immunostaining, microglial activation was assessed based on morphology and staining intensity, and VISTA immunoreactivity was determined in consecutive tissue sections (Figures 6 and 7). In tissue of a young individual (27 years), microglia exhibited a typical resting, ramified morphology, and VISTA expression was detected on microglia and endothelial cells (Figure 6). In both the old individual (70 years) and the septicemia patient, we observed only weakly activated microglia, and VISTA immunoreactivity in microglia was slightly reduced (Figure 6 and Table 2). VISTA staining of endothelium, however, did not seem to be affected. In the AD patient, a strong IBA1 staining intensity suggested microglial activation, which correlated with strong VISTA expression, and was specifically observed in microglia clusters (Figure 6). Co‐staining of IBA1 and β‐amyloid revealed that these microglia clusters were surrounding β‐amyloid plaque (Supporting Information, Figure S4). No difference in endothelial VISTA expression was observed. In MS normal‐appearing white matter (NAWM), microglial activation was low and VISTA was highly expressed on microglia and endothelium (Figure 7 and Table 2). Within and around a chronic lesion in the MS tissue, intermediate to strong IBA1 staining was observed, whereas VISTA staining was almost absent in microglia and endothelial cells.
Figure 6.
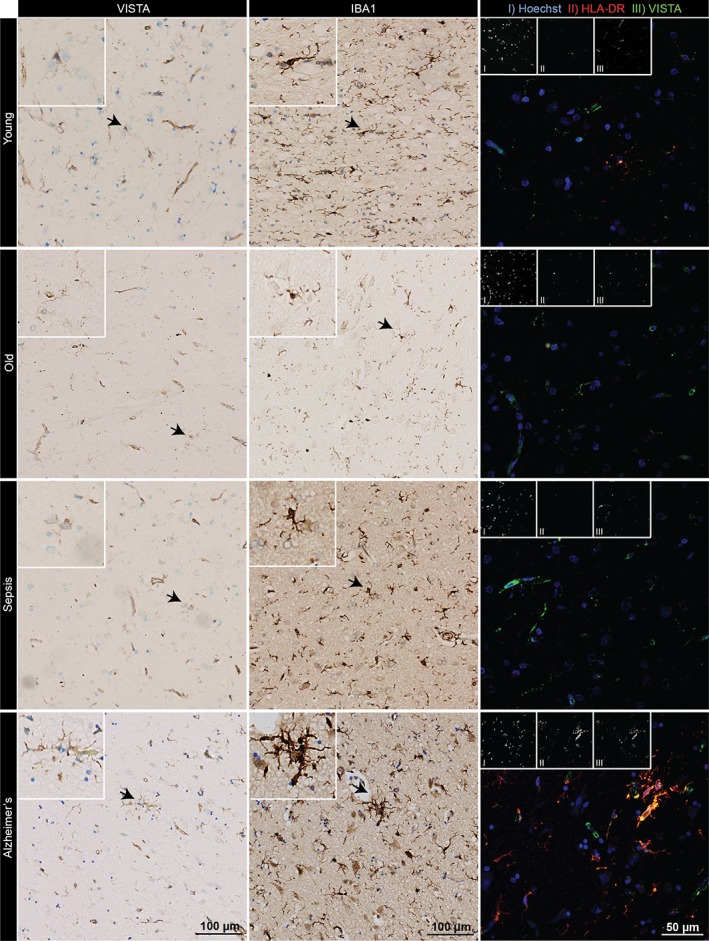
VISTA expression in young and old individuals, and sepsis and Alzheimer's patients. VISTA and IBA1 immunoreactivity, and immunofluorescence of HLA‐DR (red) and VISTA (green) co‐expression in human brain tissue of young, old, sepsis, and AD patients (n = 1) [Color figure can be viewed at wileyonlinelibrary.com]
Figure 7.
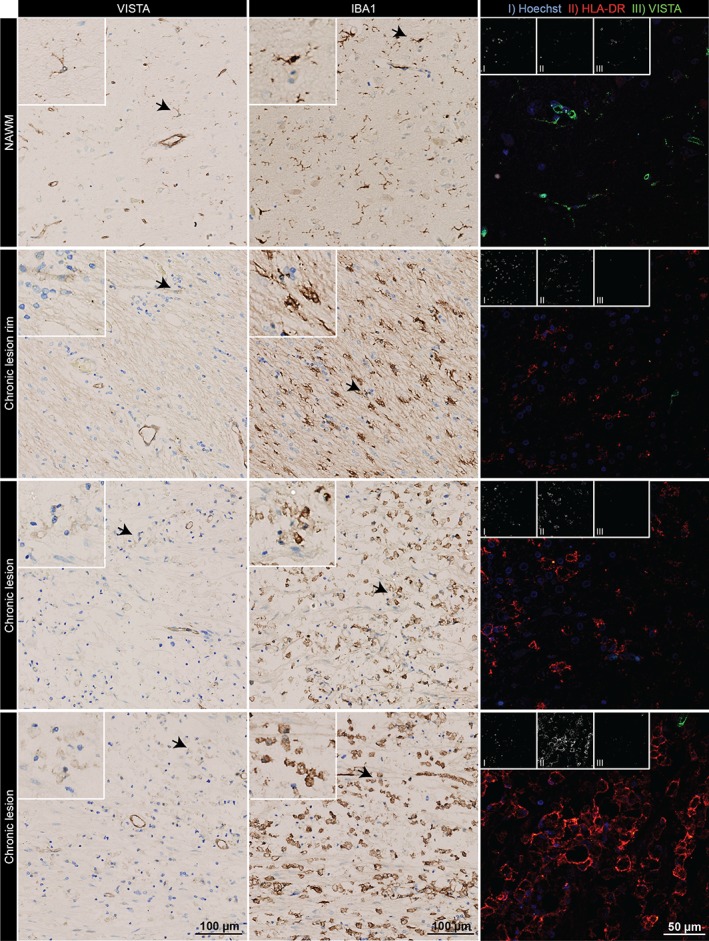
VISTA expression is reduced in and around chronic MS lesions. VISTA and IBA1 immunoreactivity, and immunofluorescence of HLA‐DR (red) and VISTA (green) co‐expression in different lesion regions (Van Der Valk & De Groot, 2000) of an MS patient (n = 1). NAWM = normal appearing white matter [Color figure can be viewed at wileyonlinelibrary.com]
Table 2.
Summary of VISTA immunoreactivity in human CNS pathologies
| Pathology | Immunohistochemistry | Immunofluorescence | |||
|---|---|---|---|---|---|
| Aging, sepsis, AD | Microglial activationa | VISTA microglia | VISTA endothelium | HLA‐DR | VISTA |
| Young | − | + | + | − | + |
| Old | ++ | +/− | + | +/− | + |
| Sepsis | + | +/− | + | +/− | + |
| AD | + | ++ | + | ++ | ++ |
| Multiple sclerosis | |||||
| NAWM | − | ++ | ++ | + | ++ |
| Chronic lesion rim | +/− | − | + | + | + |
| Chronic lesion 1 | ++ | − | +/− | ++ | − |
| Chronic lesion 2 | ++ | +/− | − | ++ | +/− |
Note. NAWM = normal appearing white matter.
++, high expression/activation; +, normal expression/activation; +/−, weak expression/activation; −, no expression/activation (expression and activation scored relative to young individual; i.e., normal VISTA expression and no microglial activation).
Microglia activation based on IBA1 staining and morphology compared to young individual.
To establish a correlation between VISTA expression and CNS inflammation in these tissues, we performed a co‐staining of VISTA with HLA‐DR (Figures 6 and 7). In line with the previous immunostaining, low levels of HLA‐DR in the young individual, and positive VISTA signals in microglia and endothelial cells were observed (Figure 6 and Table 2). In the old and the septicemia donors, HLA‐DR expression was only slightly increased, but VISTA expression remained unchanged. In the AD tissue, HLA‐DR was highly expressed by microglia, which also abundantly expressed VISTA. In MS, co‐staining revealed a negative correlation of HLA‐DR and VISTA expression (Figure 7 and Table 2). VISTA was not detected in microglia/macrophages and endothelial cells at the rim of the lesion; however, a weak VISTA signal was observed in some amoeboid cells expressing high HLA‐DR within the lesion.
Our in situ analyses of human specimens indicate that regulation of VISTA expression during CNS pathology is more variable in human disease. In line with our mouse data (Figure 4a), we observed reduced VISTA expression in MS. Conversely, in AD, VISTA expression positively correlated with microglial activation.
4. DISCUSSION
In this article, we demonstrate that VISTA is expressed by mouse and human microglia and endothelial cells in the CNS, and that expression is differentially regulated during disease. In view of increasing interest for the role of NCRs in the CNS, and the unexpected adverse neurological effects following immunotherapy, we provide first evidence for a possible function of VISTA in microglia and during CNS pathology. Key findings include the following: (a) VISTA is abundantly expressed by human and mouse microglia comparable to microglia signature genes. (b) VISTA expression is downregulated in mouse and rhesus macaque microglia upon TLR ligation in vitro, and in mouse microglia during EAE, accelerated aging, and by LPS stimulation. (c) Our results suggest that VISTA expression is potentially regulated by the two microglia‐specific TF, Pu.1, and Mafb, and that reduced VISTA expression after LPS injection is associated with histone modifications and reduced chromatin accessibility. (d) Finally, our findings indicate that VISTA expression is differentially regulated in human CNS pathologies including MS and AD.
In mouse and human brain, VISTA mRNA and protein were primarily detected in microglia. Surface VISTA was detected on >95% of microglia in mice, and gene expression in mouse and human microglia was similar to levels of microglia signature genes. Hence, VISTA is abundantly expressed by microglia. Regarding VISTA function in T cell inhibition, it is surprising that expression is high in microglia under nonpathological conditions, as T cells are not present in healthy brain parenchyma. However, it is possible that VISTA expression by microglia is necessary to assure T cell suppression during immunosurveillance of the CNS (Korn & Kallies, 2017), or to limit tissue damage in case of T cell infiltration under pathological conditions. In addition, other functions of VISTA have been reported, which could play a role in microglia homeostasis and innate immune response. For example, Yoon et al. (2015) showed that VISTA expression in phagocytic cells is essential for uptake of apoptotic cells. Furthermore, VISTA is involved in the immune response of myeloid cells, as overexpression in human monocytes leads to spontaneous cytokine secretion (Bharaj et al., 2014). Thus, VISTA may be involved in immune surveillance and uptake of apoptotic neurons or other debris by microglia.
Consistent with this argument, our findings indicate that VISTA expression is regulated similarly to known homeostatic microglia genes such as TMEM119 and P2RY12. These signature genes are downregulated upon microglial activation (Grabert et al., 2016). Expression of P2RY12 is lost in active MS lesions (Zrzavy et al., 2017), in which microglia obtain an immune‐activated phenotype. The decrease in VISTA expression during microglial activation in mice and in MS lesions indicates a similar homeostatic function of VISTA. Supporting this notion, we identified consensus binding sites for Pu.1 and Mafb in accessible chromatin on the VISTA gene, which are TFs pivotal for microglia homeostatic function. Knockout of Pu.1 in mice leads to a complete loss of microglia (Smith et al., 2013), and Mafb is involved in homeostasis of adult microglia (Matcovitch‐Natan et al., 2016).
The downregulation of VISTA that we observed in activated microglia stands in marked contrast to published studies on expression of other NCRs (Yshii et al., 2017). In microglia, expression of several NCRs is induced or upregulated upon inflammatory stimuli (Yshii et al., 2017), which we confirmed for PD‐L1 expression in this study. Moreover, VISTA expression is upregulated in TLR‐stimulated monocytes and macrophages (Bharaj et al., 2014; Wang et al., 2011). This discrepancy underscores our previous argument that VISTA has additional functions in microglia that deviate from other NCRs and other myeloid cells. Considering the function of VISTA in apoptotic cell clearance and cytokine response (Bharaj et al., 2014; Yoon et al., 2015), a loss of VISTA in activated microglia may reduce their ability to clear debris or to mount a cytokine response. However, VISTA may also function as an NCR in microglia, and downregulation likely has consequences for CNS pathologies which involve T cell infiltration. Several studies have shown that knockout of NCRs including VISTA in mice promotes the development of EAE (Joller et al., 2012; Wang et al., 2014). Hence, lack of VISTA expression on microglia may promote T cell infiltration and activation in the CNS, which can exacerbate or predispose for diseases such as MS or EAE. The function of VISTA in microglia with regard to CNS pathology should be evaluated in further studies.
Our results also indicate a potential underlying epigenetic mechanism by which VISTA expression is reduced upon LPS stimulation in microglia. We observed decreased H3K27ac enrichment, a histone modification associated with active transcription. Furthermore, Pu.1, Rfx6, Elf5, and Sox15 consensus binding motifs in the VISTA gene exhibited reduced accessibility after LPS stimulation. Together, these epigenetic alterations likely contribute to reduced expression of VISTA in LPS‐activated microglia.
In line with our findings of decreased VISTA expression in activated microglia, we observed a strong reduction of VISTA on microglia/macrophages in chronic MS lesion tissue. Strikingly, VISTA expression was elevated in microglia in NAWM and close to plaques in the AD patient compared to the young and old individual. Therefore, expression regulation of VISTA in human CNS disease could depend on the underlying pathophysiology. In chronic MS lesions, massive infiltration and unregulated activity of macrophages and lymphocytes occur (Van Der Valk & De Groot, 2000). It is possible that the presence of immune cell infiltrates in MS might facilitate the loss of VISTA expression, and VISTA deficiency could again augment infiltration. In contrast, AD is a neurodegenerative disease which features endogenous inflammation with absence of parenchymal immune cell infiltrates (Graeber, Li, & Rodriguez, 2011). In AD, microglia are activated by amyloid‐β (Aβ) and neuronal debris, contributing to clearance, but also causing tissue damage. A recent study suggests that aggregated Aβ sensed by microglia causes inflammasome activation, which contributes to progression and spreading of inflammation and Aβ pathology (Venegas et al., 2017). Furthermore, single‐cell RNA‐sequence data suggest that plaque‐associated microglia in mice obtain a Trem2‐dependent phagocytic phenotype (Keren‐Shaul et al., 2017). Hence, VISTA expression changes in activated microglia may depend on environmental cues in CNS pathologies, such as interactions with peripheral immune infiltrates in MS, or activation by Aβ in AD.
Interestingly, we also observed downregulation of VISTA in endothelial cells in chronic MS lesion. The endothelium is involved in MS pathology by recruitment of immune cells to the CNS (Yun, Minagar, & Alexander, 2017). Endothelial cells are involved in antigen presentation of CNS components to antigen‐specific lymphocytes (Galea et al., 2007; Lopes Pinheiro et al., 2016; Traugott & Raine, 1985). Blocking co‐inhibitory molecules PD‐L1 or PD‐L2 on human endothelial cells facilitates transmigration responses of lymphocytes in vitro (Pittet, Newcombe, Prat, & Arbour, 2011; Rodig et al., 2003). Reduced VISTA expression on endothelium in MS could therefore promote activation and transmigration of lymphocytes into the CNS. Additional studies are needed to assess the effect of VISTA deficiency in endothelial cells regarding antigen presentation and immune cell infiltration.
In conclusion, we present an elaborate multi‐species analysis of VISTA expression in the CNS, including changes during pathology. We demonstrate that VISTA is abundantly expressed by microglia, suggesting a functional role in these cells. Differential expression of VISTA during CNS pathology highlights the importance to further elucidate the function of VISTA in the CNS. Our study is the first to show VISTA expression patterns in the CNS, which serves as a basis for future studies to address the role of VISTA in microglia and during CNS pathology.
CONFLICTS OF INTEREST
Dr Randolph J. Noelle is CSO of ImmuNext Inc., and is involved with the commercial development of VISTA.
Supporting information
Supporting Information, Table 1 Primary antibodies used for immunohistochemical labeling
Supporting Information, Table 2. Primers used for quantitative real‐time PCR
Supporting Information, Table 3. Patient information
Supporting Information, Figure 1. TLR stimulation drives Tnfα expression in primary neonatal mouse microglia in vitro. (a,b) LogFC of Tnfα gene expression measured using RT‐qPCR after stimulation with different TLR agonists (a) (n = 5) and LPS over time (b) compared to untreated control (n = 3). Statistical analysis conducted was a one‐way ANOVA with Dunnett's test for multiple comparisons. Error bars indicate mean ± SD. ***p < .001, ****p < .0001
Supporting Information, Figure 2. Acutely isolated adult microglia from Ercc1Δ/− and EAE mice exhibit an immune‐activated phenotype. (a) Relative gene expression of Il1b, Axl, and H2Aa in acutely isolated adult microglia from spinal cord (Il1b, Axl, H2Aa) and hindbrain (H2Aa) from EAE control, score 1, score 4, and remission (n = 3). (b) Relative gene expression of Il1b and Axl in acutely isolated adult microglia from whole brain of Ercc1 Δ/− mice and WT littermates. Gene expression was measured using RT‐qPCR and data are normalised to Hprt1. Statistical analysis conducted was a one‐way ANOVA with Dunnett's test for multiple comparisons (a) and a paired Student's t test (b). Error bars indicate mean ± SD. *p < .05, **p < .01, ***p < .001
Supporting Information, Figure 3. VISTA H3K4 histone tri‐methylation and Cdh23 and Il1β expression in microglia after LPS injection. (a,b) RNA‐seq counts per million of Cdh23 (a) and Il1β (b) mRNA expression (n = 3). (c) H3K4me3 histone tri‐methylation peaks corresponding to the VISTA gene (n = 3). Data are derived from previously generated datasets (Zhang et al., in preparation). Error bars indicate mean ± SD. # = Differential expression (DE) based on RNA‐sequence analysis
Supporting Information, Figure 4. Microglia cluster around β‐amyloid plaque in Alzheimer's patients. Immunofluorescence staining of β‐amyloid (red) and IBA1 (green) in human brain tissue of an Alzheimer's patient (n = 1)
ACKNOWLEDGMENTS
The authors thank S.M. Kooistra, X. Zhang, and M.L. Dubbelaar for the assistance during RNA‐seq, ChIP‐seq, and ATAC‐seq data analysis. They thank J. Hoeijmakers (Dept. Molecular Genetics, Erasmus MC Rotterdam, The Netherlands) for providing the Ercc1 mouse model. They acknowledge N. Brouwer for support in laboratory work, E.M. Wesseling for mouse breeding, and M. Meijer for confocal microscopy support. The authors also thank W. Abdulahad, G. Mesander, J. Teunis, and T. Bijma from the central flow cytometry unit at the UMCG, and K. Sjollema from the UMCG microscopy & imaging center. This study was funded by the Dutch MS Research Foundation (Stichting MS Research) (13‐833MS).
ETHICAL APPROVAL
All applicable international, national, and/or institutional guidelines for the care and use of animals were followed. All patients and control donors gave formal consent for autopsy and the use of brain tissue for research purposes. No specific ethical approval is required for this type of study.
Borggrewe M, Grit C, Den Dunnen WFA, et al. VISTA expression by microglia decreases during inflammation and is differentially regulated in CNS diseases. Glia. 2018;66:2645–2658. 10.1002/glia.23517
Funding information 13‐833MS, Grant/Award Number: 13‐833MS; Stichting MS Research, Grant/Award Number: 13‐833MS
Present address Saskia M. Burm, Genmab B.V., Uppsalalaan 15, 3584 CT Utrecht, The Netherlands.
REFERENCES
- Aloia, L. , Parisi, S. , Fusco, L. , Pastore, L. , & Russo, T. (2010). Differentiation of embryonic stem cells 1 (Dies1) is a component of bone morphogenetic protein 4 (BMP4) signaling pathway required for proper differentiation of mouse embryonic stem cells. Journal of Biological Chemistry, 285(10), 7776–7783. 10.1074/jbc.M109.077156 [DOI] [PMC free article] [PubMed] [Google Scholar]
- Baruch, K. , Deczkowska, A. , Rosenzweig, N. , Tsitsou‐Kampeli, A. , Sharif, A. M. , Matcovitch‐Natan, O. , Kertser A., David E., Amit I. Schwartz, M. (2016). PD‐1 immune checkpoint blockade reduces pathology and improves memory in mouse models of Alzheimer's disease. Nature Medicine, 22(2), 135–137. 10.1038/nm.4022 [DOI] [PubMed] [Google Scholar]
- Bharaj, P. , Chahar, H. S. , Alozie, O. K. , Rodarte, L. , Bansal, A. , Goepfert, P. A. , Dwivedi A., Manjunath N. Shankar, P. (2014). Characterization of programmed death‐1 homologue‐1 (PD‐1H) expression and function in normal and HIV infected individuals. PLoS One, 9(10), e109103 10.1371/journal.pone.0109103 [DOI] [PMC free article] [PubMed] [Google Scholar]
- Buenrostro, J. D. , Wu, B. , Chang, H. Y. , & Greenleaf, W. J. (2015). ATAC‐seq: A method for assaying chromatin accessibility genome‐wide. Current Protocols in Molecular Biology, 109, 21.29.1–9. 10.1002/0471142727.mb2129s109 [DOI] [PMC free article] [PubMed] [Google Scholar]
- Burm, S. M. , Zuiderwijk‐Sick, E. A. , ‘t Jong, A. E. J. , van der Putten, C. , Veth, J. , Kondova, I. , & Bajramovic, J. J. (2015). Inflammasome‐induced IL‐1β secretion in microglia is characterized by delayed kinetics and is only partially dependent on inflammatory caspases. Journal of Neuroscience, 35(2), 678–687. 10.1523/JNEUROSCI.2510-14.2015 [DOI] [PMC free article] [PubMed] [Google Scholar]
- Ceeraz, S. , Sergent, P. A. , Plummer, S. F. , Schned, A. R. , Pechenick, D. , Burns, C. M. , & Noelle, R. J. (2016). VISTA deficiency accelerates the development of fatal murine lupus nephritis. Arthritis & Rheumatology, 64(4), 814–825. 10.1002/art.40020 [DOI] [PMC free article] [PubMed] [Google Scholar]
- Cuzzubbo, S. , Javeri, F. , Tissier, M. , Roumi, A. , Barlog, C. , Doridam, J. , Lebbe C., Belin C., Ursu R. Carpentier, A. F. (2017). Neurological adverse events associated with immune checkpoint inhibitors: Review of the literature. European Journal of Cancer , 73 , 1 – 8. 10.1016/j.ejca.2016.12.001 [DOI] [PubMed] [Google Scholar]
- Duncan, D. S. , & Miller, S. D. (2011). CNS expression of B7‐H1 regulates pro‐inflammatory cytokine production and alters severity of Theiler's virus‐induced demyelinating disease. PLoS One, 6(4), e18548 10.1371/journal.pone.0018548 [DOI] [PMC free article] [PubMed] [Google Scholar]
- Flies, D. B. , Han, X. , Higuchi, T. , Zheng, L. , Sun, J. , Ye, J. J. , & Chen, L. (2014). Coinhibitory receptor PD‐1H preferentially suppresses CD4+ T cell‐mediated immunity. Journal of Clinical Investigation, 124(5), 1966–1975. 10.1172/JCI74589 [DOI] [PMC free article] [PubMed] [Google Scholar]
- Flies, D. B. , Wang, S. , Xu, H. , & Chen, L. (2011). Cutting edge: A monoclonal antibody specific for the programmed Death‐1 homolog prevents graft‐versus‐host disease in mouse models. The Journal of Immunology, 187(4), 1537–1541. 10.4049/jimmunol.1100660 [DOI] [PMC free article] [PubMed] [Google Scholar]
- Galatro, T. F. , Holtman, I. R. , Lerario, A. M. , Vainchtein, I. D. , Brouwer, N. , Sola, P. R. , Veras M. M., Pereira T. F., Leite R. E. P., Möller T., Wes P. D., Sogayar M. C., Laman J. D., den Dunnen W., Pasqualucci C. A., Oba‐Shinjo S. M., Boddeke E. W. G. M., Marie S. K. N. Eggen, B. J. L. (2017a). Transcriptomic analysis of purified human cortical microglia reveals age‐associated changes. Nature Neuroscience, 20(8), 1162–1171. 10.1038/nn.4597 [DOI] [PubMed] [Google Scholar]
- Galatro, T. F. , Vainchtein, I. D. , Brouwer, N. , Boddeke, E. W. G. M. , & Eggen, B. J. L. (2017b). Isolation of microglia and immune infiltrates from mouse and primate central nervous system. In Methods in Molecular Biology (Vol. 1559, pp. 333–342). 10.1007/978-1-4939-6786-5_23 [DOI] [PubMed] [Google Scholar]
- Galea, I. , Bernardes‐Silva, M. , Forse, P. A. , van Rooijen, N. , Liblau, R. S. , & Perry, V. H. (2007). An antigen‐specific pathway for CD8 T cells across the blood‐brain barrier. The Journal of Experimental Medicine, 204(9), 2023–2030. 10.1084/jem.20070064 [DOI] [PMC free article] [PubMed] [Google Scholar]
- Grabert, K. , Michoel, T. , Karavolos, M. H. , Clohisey, S. , Kenneth Baillie, J. , Stevens, M. P. , … McColl, B. W. (2016). Microglial brain region‐dependent diversity and selective regional sensitivities to aging. Nature Neuroscience, 19(3), 504–516. 10.1038/nn.4222 [DOI] [PMC free article] [PubMed] [Google Scholar]
- Graeber, M. B. , Li, W. , & Rodriguez, M. L. (2011). Role of microglia in CNS inflammation. FEBS Letters, 585(23), 3798–3805. 10.1016/j.febslet.2011.08.033 [DOI] [PubMed] [Google Scholar]
- Heinz, S. , Benner, C. , Spann, N. , Bertolino, E. , Lin, Y. C. , Laslo, P. , Cheng J. X., Murre C., Singh H. Glass, C. K. (2010). Simple combinations of lineage‐determining transcription factors prime cis‐regulatory elements required for macrophage and B cell identities. Molecular Cell, 38(4), 576–589. 10.1016/j.molcel.2010.05.004 [DOI] [PMC free article] [PubMed] [Google Scholar]
- Johnson, K. R. , Tian, C. , Gagnon, L. H. , Jiang, H. , Ding, D. , & Salvi, R. (2017). Effects of Cdh23 single nucleotide substitutions on age‐related hearing loss in C57BL/6 and 129S1/Sv mice and comparisons with congenic strains. Scientific Reports, 7, 44450 10.1038/srep44450 [DOI] [PMC free article] [PubMed] [Google Scholar]
- Joller, N. , Peters, A. , Anderson, A. C. , & Kuchroo, V. K. (2012). Immune checkpoints in central nervous system autoimmunity. Immunological Reviews, 248(1), 122–139. 10.1111/j.1600-065X.2012.01136.x [DOI] [PMC free article] [PubMed] [Google Scholar]
- Keren‐Shaul, H. , Spinrad, A. , Weiner, A. , Matcovitch‐Natan, O. , Dvir‐Szternfeld, R. , Ulland, T. K. , David E., Baruch K., Lara‐Astaiso D., Toth B., Itzkovitz S., Colonna M., Schwartz M. Amit, I. (2017). A unique microglia type associated with restricting development of Alzheimer's disease. Cell, 169(7), 1276–1290.e17. 10.1016/j.cell.2017.05.018 [DOI] [PubMed] [Google Scholar]
- Korn, T. , & Kallies, A. (2017). T cell responses in the central nervous system. Nature Reviews Immunology, 17(3), 179–194. 10.1038/nri.2016.144 [DOI] [PubMed] [Google Scholar]
- Krasemann, S. , Madore, C. , Cialic, R. , Baufeld, C. , Calcagno, N. , El Fatimy, R. , … Butovsky, O. (2017). The TREM2‐APOE pathway drives the transcriptional phenotype of dysfunctional microglia in neurodegenerative diseases. Immunity, 47(3), 566–581.e9. 10.1016/j.immuni.2017.08.008 [DOI] [PMC free article] [PubMed] [Google Scholar]
- Latta‐Mahieu, M. , Elmer, B. , Bretteville, A. , Wang, Y. , Lopez‐Grancha, M. , Goniot, P. , Moindrot N., Ferrari P., Blanc V., Schussler N., Brault E., Roudières V., Blanchard V., Yang Z.Y., Barneoud P., Bertrand P., Roucourt B., Carmans S., Bottelbergs A., Mertens L., Wintmolders C., Larsen P., Hersley C., McGathey T., Racke M. M., Liu L., Lu J., O'Neill M. J., Riddell D. R., Ebneth A., Nabel G. J. Pradier, L. (2018). Systemic immune‐checkpoint blockade with anti‐PD1 antibodies does not alter cerebral amyloid‐β burden in several amyloid transgenic mouse models. Glia, 66(3), 492–504. 10.1002/glia.23260 [DOI] [PubMed] [Google Scholar]
- Lines, J. L. , Sempere, L. F. , Broughton, T. , Wang, L. , & Noelle, R. (2014). VISTA is a novel broad‐Spectrum negative checkpoint regulator for cancer immunotherapy. Cancer Immunology Research, 2(6), 510–517. 10.1158/2326-6066.CIR-14-0072 [DOI] [PMC free article] [PubMed] [Google Scholar]
- Lopes Pinheiro, M. A. , Kamermans, A. , Garcia‐Vallejo, J. J. , Van Het Hof, B. , Wierts, L. , O'Toole, T. , Unger …, W. W. J. (2016). Internalization and presentation of myelin antigens by the brain endothelium guides antigen‐specific T cell migration. eLife, 5(JUN2016), e13149 10.7554/eLife.13149 [DOI] [PMC free article] [PubMed] [Google Scholar]
- Magnus, T. (2005). Microglial expression of the B7 family member B7 homolog 1 confers strong immune inhibition: Implications for immune responses and autoimmunity in the CNS. Journal of Neuroscience, 25(10), 2537–2546. 10.1523/JNEUROSCI.4794-04.2005 [DOI] [PMC free article] [PubMed] [Google Scholar]
- Matcovitch‐Natan, O. , Winter, D. R. , Giladi, A. , Vargas Aguilar, S. , Spinrad, A. , Sarrazin, S. , Ben‐Yehuda H., David E., Zelada Gonzalez F., Perrin P., Keren‐Shaul H., Gury M., Lara‐Astaiso D., Thaiss C. A., Cohen M., Bahar Halpern K., Baruch K., Deczkowska A., Lorenzo‐Vivas E., Itzkovitz S., Elinav E., Sieweke M. H., Schwartz M. Amit, I. (2016). Microglia development follows a stepwise program to regulate brain homeostasis. Science, 353(6301), aad8670 10.1126/science.aad8670 [DOI] [PubMed] [Google Scholar]
- Perry, V. H. , & Holmes, C. (2014). Microglial priming in neurodegenerative disease. Nature Reviews Neurology, 10(4), 217–224. 10.1038/nrneurol.2014.38 [DOI] [PubMed] [Google Scholar]
- Pittet, C. L. , Newcombe, J. , Prat, A. , & Arbour, N. (2011). Human brain endothelial cells endeavor to immunoregulate CD8 T cells via PD‐1 ligand expression in multiple sclerosis. Journal of Neuroinflammation, 8, 155 10.1186/1742-2094-8-155 [DOI] [PMC free article] [PubMed] [Google Scholar]
- Rodig, N. , Ryan, T. , Allen, J. A. , Pang, H. , Grabie, N. , Chernova, T. , … Freeman, G. J. (2003). Endothelial expression of PD‐L1 and PD‐L2 down‐regulates CD8+T cell activation and cytolysis. European Journal of Immunology, 33(11), 3117–3126. 10.1002/eji.200324270 [DOI] [PubMed] [Google Scholar]
- Sakr, M. A. , Takino, T. , Domoto, T. , Nakano, H. , Wong, R. W. , Sasaki, M. , Nakanuma Y. Sato, H. (2010). GI24 enhances tumor invasiveness by regulating cell surface membrane‐type 1 matrix metalloproteinase. Cancer Science, 101(11), 2368–2374. 10.1111/j.1349-7006.2010.01675.x [DOI] [PMC free article] [PubMed] [Google Scholar]
- Salter, M. W. , & Beggs, S. (2014). Sublime microglia: Expanding roles for the guardians of the CNS. Cell. 158, 15–24. 10.1016/j.cell.2014.06.008 [DOI] [PubMed] [Google Scholar]
- Schaafsma, W. , Zhang, X. , van Zomeren, K. C. , Jacobs, S. , Georgieva, P. B. , Wolf, S. A. , Kettenmann H., Janova H., Saiepour N., Hanisch U.K., Meerlo P., van den Elsen P.J., Brouwer N., Boddeke H.W.G.M. Eggen, B. J. L. (2015). Long‐lasting pro‐inflammatory suppression of microglia by LPS‐preconditioning is mediated by RelB‐dependent epigenetic silencing. Brain, Behavior, and Immunity, 48, 205–221. 10.1016/j.bbi.2015.03.013 [DOI] [PubMed] [Google Scholar]
- Schachtele, S. J. , Hu, S. , Sheng, W. S. , Mutnal, M. B. , & Lokensgard, J. R. (2014). Glial cells suppress postencephalitic CD8+ T lymphocytes through PD‐L1. Glia, 62(10), 1582–1594. 10.1002/glia.22701 [DOI] [PMC free article] [PubMed] [Google Scholar]
- Smith, A. M. , Gibbons, H. M. , Oldfield, R. L. , Bergin, P. M. , Mee, E. W. , Faull, R. L. M. , & Dragunow, M. (2013). The transcription factor PU.1 is critical for viability and function of human brain microglia. Glia, 61(6), 929–942. 10.1002/glia.22486 [DOI] [PubMed] [Google Scholar]
- Traugott, U. , & Raine, C. S. (1985). Evidence for antigen presentation in situ by endothelial cells and astrocytes. Journal of the Neurological Sciences, 69(3), 365–370. 10.1016/0022-510X(85)90147-9 [DOI] [PubMed] [Google Scholar]
- Vainchtein, I. D. , Vinet, J. , Brouwer, N. , Brendecke, S. , Biagini, G. , Biber, K. , Boddeke H. W. G. M. Eggen, B. J. L. (2014). In acute experimental autoimmune encephalomyelitis, infiltrating macrophages are immune activated, whereas microglia remain immune suppressed. Glia, 62(10), 1724–1735. 10.1002/glia.22711 [DOI] [PubMed] [Google Scholar]
- Van Der Valk, P. , & De Groot, C. J. A. (2000). Staging of multiple sclerosis (MS) lesions: Pathology of the time frame of MS. Neuropathology and Applied Neurobiology, 26(1), 2–10. 10.1046/j.1365-2990.2000.00217.x [DOI] [PubMed] [Google Scholar]
- Varol, D. , Mildner, A. , Blank, T. , Shemer, A. , Barashi, N. , Yona, S. , David E., Boura‐Halfon S., Segal‐Hayoun Y., Chappell‐Maor L., Keren‐Shaul H., Leshkowitz D., Hornstein E., Fuhrmann M., Amit I., Maggio N., Prinz M. Jung, S. (2017). Dicer deficiency differentially impacts microglia of the developing and adult brain. Immunity, 46(6), 1030–1044.e8. 10.1016/j.immuni.2017.05.003 [DOI] [PubMed] [Google Scholar]
- Venegas, C. , Kumar, S. , Franklin, B. S. , Dierkes, T. , Brinkschulte, R. , Tejera, D. , Vieira‐Saecker A., Schwartz S., Santarelli F., Kummer M. P., Griep A., Gelpi E., Beilharz M., Riedel D., Golenbock D. T., Geyer M., Walter J., Latz E. Heneka, M. T. (2017). Microglia‐derived ASC specks crossseed amyloid‐β in Alzheimer's disease. Nature, 552(7685), 355–361. 10.1038/nature25158 [DOI] [PubMed] [Google Scholar]
- Vermeij, W. P. , Dollé, M. E. T. , Reiling, E. , Jaarsma, D. , Payan‐Gomez, C. , Bombardieri, C. R. , Wu H., Roks A. J. M., Botter S. M., van der Eerden B. C., Youssef S. A., Kuiper R. V., Nagarajah B., van Oostrom C. T., Brandt R. M. C., Barnhoorn S., Imholz S., Pennings J. L. A., de Bruin A., Gyenis Á., Pothof J., Vijg J., van Steeg H. Hoeijmakers, J. H. J. (2016). Restricted diet delays accelerated ageing and genomic stress in DNA‐repair‐deficient mice. Nature, 537(7620), 427–431. 10.1038/nature19329 [DOI] [PMC free article] [PubMed] [Google Scholar]
- Wang, L. , Le Mercier, I. , Putra, J. , Chen, W. , Liu, J. , Schenk, A. D. , … Noelle, R. J. (2014). Disruption of the immune‐checkpoint VISTA gene imparts a proinflammatory phenotype with predisposition to the development of autoimmunity. Proceedings of the National Academy of Sciences, 111(41), 14846–14851. 10.1073/pnas.1407447111 [DOI] [PMC free article] [PubMed] [Google Scholar]
- Wang, L. , Rubinstein, R. , Lines, J. L. , Wasiuk, A. , Ahonen, C. , Guo, Y. , Lu L.F., Gondek D., Wang Y., Fava R. A., Fiser A., Almo S. Noelle, R. J. (2011). VISTA, a novel mouse Ig superfamily ligand that negatively regulates T cell responses. The Journal of Experimental Medicine, 208(3), 577–592. 10.1084/jem.20100619 [DOI] [PMC free article] [PubMed] [Google Scholar]
- Yoon, K. W. , Byun, S. , Kwon, E. , Hwang, S.‐Y. , Chu, K. , Hiraki, M. , Jo S.H., Weins A., Hakroush S., Cebulla A., Sykes D. B., Greka A., Mundel P., Fisher D. E., Mandinova A. Lee, S. W. (2015). Control of signaling‐mediated clearance of apoptotic cells by the tumor suppressor p53. Science, 349(6247), 1261669–1261669. 10.1126/science.1261669 [DOI] [PMC free article] [PubMed] [Google Scholar]
- Yshii, L. M. , Hohlfeld, R. , & Liblau, R. S. (2017). Inflammatory CNS disease caused by immune checkpoint inhibitors: Status and perspectives. Nature Reviews Neurology, 13(12), 755–763. 10.1038/nrneurol.2017.144 [DOI] [PubMed] [Google Scholar]
- Yun, J. W. , Minagar, A. , & Alexander, J. S. (2017). Emerging roles of endothelial cells in multiple sclerosis pathophysiology and therapy In Inflammatory disorders of the nervous system (pp. 1–23). Cham, Switzerland: Springer International Publishing; 10.1007/978-3-319-51220-4_1 [DOI] [Google Scholar]
- Zhang, X. , Kooistra, S. M. , Dubbelaar, M. , Kracht, L. , Lerario, A. M. , Brouwer, N. , … Eggen, B. J. L. . (in press). Epigenetic regulation of innate immune memory in microglia. [DOI] [PMC free article] [PubMed]
- Zhang, Y. , Chen, K. , Sloan, S. A. , Bennett, M. L. , Scholze, A. R. , O'Keeffe, S. , Phatnani H. P., Guarnieri P., Caneda C., Ruderisch N., Deng S., Liddelow S. A., Zhang C., Daneman R., Maniatis T., Barres B. A. Wu, J. Q. (2014). An RNA‐sequencing transcriptome and splicing database of glia, neurons, and vascular cells of the cerebral cortex. Journal of Neuroscience, 34(36), 11929–11947. 10.1523/JNEUROSCI.1860-14.2014 [DOI] [PMC free article] [PubMed] [Google Scholar]
- Zhang, Y. , Sloan, S. A. , Clarke, L. E. , Caneda, C. , Plaza, C. A. , Blumenthal, P. D. , Vogel H., Steinberg G. K., Edwards M. S.B., Li G., Duncan J. A. III, Cheshier S. H., Shuer L. M., Chang E. F., Grant G. A., Gephart M. G. H. Barres, B. A. (2016). Purification and characterization of progenitor and mature human astrocytes reveals transcriptional and functional differences with mouse. Neuron, 89(1), 37–53. 10.1016/j.neuron.2015.11.013 [DOI] [PMC free article] [PubMed] [Google Scholar]
- Zrzavy, T. , Hametner, S. , Wimmer, I. , Butovsky, O. , Weiner, H. L. , & Lassmann, H. (2017). Loss of “homeostatic” microglia and patterns of their activation in active multiple sclerosis. Brain, 140(7), 1900–1913. 10.1093/brain/awx113 [DOI] [PMC free article] [PubMed] [Google Scholar]
Associated Data
This section collects any data citations, data availability statements, or supplementary materials included in this article.
Supplementary Materials
Supporting Information, Table 1 Primary antibodies used for immunohistochemical labeling
Supporting Information, Table 2. Primers used for quantitative real‐time PCR
Supporting Information, Table 3. Patient information
Supporting Information, Figure 1. TLR stimulation drives Tnfα expression in primary neonatal mouse microglia in vitro. (a,b) LogFC of Tnfα gene expression measured using RT‐qPCR after stimulation with different TLR agonists (a) (n = 5) and LPS over time (b) compared to untreated control (n = 3). Statistical analysis conducted was a one‐way ANOVA with Dunnett's test for multiple comparisons. Error bars indicate mean ± SD. ***p < .001, ****p < .0001
Supporting Information, Figure 2. Acutely isolated adult microglia from Ercc1Δ/− and EAE mice exhibit an immune‐activated phenotype. (a) Relative gene expression of Il1b, Axl, and H2Aa in acutely isolated adult microglia from spinal cord (Il1b, Axl, H2Aa) and hindbrain (H2Aa) from EAE control, score 1, score 4, and remission (n = 3). (b) Relative gene expression of Il1b and Axl in acutely isolated adult microglia from whole brain of Ercc1 Δ/− mice and WT littermates. Gene expression was measured using RT‐qPCR and data are normalised to Hprt1. Statistical analysis conducted was a one‐way ANOVA with Dunnett's test for multiple comparisons (a) and a paired Student's t test (b). Error bars indicate mean ± SD. *p < .05, **p < .01, ***p < .001
Supporting Information, Figure 3. VISTA H3K4 histone tri‐methylation and Cdh23 and Il1β expression in microglia after LPS injection. (a,b) RNA‐seq counts per million of Cdh23 (a) and Il1β (b) mRNA expression (n = 3). (c) H3K4me3 histone tri‐methylation peaks corresponding to the VISTA gene (n = 3). Data are derived from previously generated datasets (Zhang et al., in preparation). Error bars indicate mean ± SD. # = Differential expression (DE) based on RNA‐sequence analysis
Supporting Information, Figure 4. Microglia cluster around β‐amyloid plaque in Alzheimer's patients. Immunofluorescence staining of β‐amyloid (red) and IBA1 (green) in human brain tissue of an Alzheimer's patient (n = 1)