

Abstract
Aims
Patients with type 2 diabetes and non‐alcoholic fatty liver disease (NAFLD) exhibit considerable residual risk for cardiovascular disease (CVD). There is, therefore, increasing interest in targeting postprandial lipid metabolism and remnant cholesterol. Treatment with the glucagon‐like peptide 1 (GLP‐1) analogue liraglutide reduces CVD risk by mechanisms that remain unexplained in part. Here we investigated the effects of liraglutide intervention on ectopic fat depots, hepatic lipogenesis and fat oxidation, postprandial lipid metabolism and glycaemia in humans with type 2 diabetes.
Methods
The effect of liraglutide was investigated in 22 patients with adequately controlled type 2 diabetes. Patients were randomly allocated, in a single‐blind fashion, to either liraglutide 1.8 mg or placebo once daily for 16 weeks. Because liraglutide is known to promote weight loss, the study included dietary counselling to achieve similar weight loss in the liraglutide and placebo groups. Cardiometabolic responses to a high‐fat mixed meal were measured before and at the end of the liraglutide intervention.
Results
Weight loss at Week 16 was similar between the groups: −2.4 kg (−2.5%) in the liraglutide group and −2.1 kg (−2.2%) in the placebo group. HBA1c improved by 6.4 mmol/mol (0.6%) in the liraglutide group (P = 0.005). Liver fat decreased in both groups, by 31% in the liraglutide group and by 18% in the placebo group, but there were no significant changes in the rate of hepatic de novo lipogenesis or β‐hydroxybutyrate levels, a marker of fat oxidation. We observed significant postprandial decreases in triglycerides only in plasma, chylomicrons and VLDL, and remnant particle cholesterol after treatment in the liraglutide group. Fasting and postprandial apoCIII concentrations decreased after liraglutide intervention and these changes were closely related to reduced glycaemia. In relative importance analysis, approximately half of the changes in postprandial lipids were explained by reductions in apoCIII concentrations, whereas less than 10% of the variation in postprandial lipids was explained by reductions in weight, glycaemic control, liver fat or postprandial insulin responses.
Conclusions
Intervention with liraglutide for 16 weeks produces multiple improvements in cardiometabolic risk factors that were not seen in the placebo group, despite similar weight loss. Of particular importance was a marked reduction in postprandial atherogenic remnant particles. The underlying mechanism may be improved glycaemic control, which leads to reduced expression of apoCIII, a key regulator of hypertriglyceridaemia in hyperglycaemic patients.
Keywords: apolipoprotein C3, atherogenic dyslipidaemia, de novo lipogenesis, GLP‐1‐agonist, liraglutide, liver fat, postprandial lipids, remnant lipoproteins
1. INTRODUCTION
It is well established that high plasma concentrations of cholesterol‐rich atherogenic lipoproteins are causatively linked to cardiovascular disease (CVD).1 However, despite treatments that significantly lower LDL concentrations, patients with type 2 diabetes and non‐alcoholic fatty‐liver disease (NAFLD) retain a considerable residual risk of CVD.2, 3 There is, therefore, increasing interest in the role of plasma triglycerides, a biomarker of circulating triglyceride‐rich lipoproteins (TRLs), and, in particular, their cholesterol‐rich remnant particles, with accumulating evidence that they are causatively linked to CVD.4, 5 Of note, the residual risk of CVD in patients with type 2 diabetes despite treatment with statins may be explained, in part, by the fact that these agents lower remnant cholesterol by only 4% to 25%, a point that is not normally noted as remnant cholesterol is not quantified by routine lipid measurements.6
Remnant lipoprotein particles are derived from the intestine (ie, chylomicrons) and the liver (ie, VLDL).6 The plasma concentration of these remnants is higher in patients with postprandial hypertriglyceridaemia, and non‐fasting triglyceride levels have allowed prediction of CVD risk more reliably than fasting triglyceride values.7 Although the vast majority of plasma triglycerides after a fat‐rich mixed meal come from the intestine,8 approximately 80% of the increase in particle number is accounted for by remnant particles derived from VLDL metabolism.9 Intestinal‐derived chylomicron remnants and liver‐derived VLDL remnants are cleared from the circulation by common pathways and, therefore, compete for clearance.10 Increased secretion of VLDL from the liver is, therefore, an important predictor of postprandial accumulation of chylomicron remnants.11 We have also demonstrated that apoCIII is an important regulator of TRL remnant metabolism.12
Glucagon‐like peptide‐1 (GLP‐1) receptor agonists are incretin mimetics that safely and efficiently improve glycaemic control.13 Unlike other anti‐diabetic agents, GLP‐1 receptor agonists also promote significant weight reduction.13 Furthermore, these agents have been reported to be cardioprotective,13, 14 an important clinical benefit given that CVD is the underlying cause of death in over 60% of patients with type 2 diabetes. The exact mechanism underlying the vascular benefit of GLP‐1 receptor agonists remains debated. The observed improvements in glycaemic control, weight loss and the minor changes in fasting plasma lipids are not considered sufficient to explain the robust benefits in CVD outcomes.14 However, animal and clinical studies have demonstrated that incretin‐based therapies improve postprandial TRL metabolism.15, 16, 17
Interestingly, impaired incretin effects have been observed in patients with NAFLD, both with and without diabetes.18, 19 Consequently, GLP‐1 receptor agonists are increasingly recognized as potential agents for treating NAFLD in patients with and without diabetes.20, 21, 22 It is not clear, however, whether the actions of GLP‐1 receptor agonists are direct, through activation of GLP‐1 receptors on hepatocytes,23 or are related to their weight‐loss properties.20 It is also unclear whether the beneficial effects of GLP‐1 receptor agonists on liver fat result from decreased hepatic de novo lipogenesis or from increased hepatic fat oxidation.
Here we investigated the effects of intervention with the GLP‐1 analogue liraglutide for 16 weeks on glycaemia, ectopic fat depots, hepatic lipogenesis and fat oxidation, and postprandial lipid metabolism in humans with adequately controlled type 2 diabetes. The study was designed to determine whether the cardiometabolic beneficial effects of liraglutide are mainly weight independent or weight‐loss dependent.
2. METHODS
2.1. Study design
The study was designed as a single‐blinded, double‐armed, single‐centre study at Helsinki University (Clinical Trials NCT02765399). Participants were recruited through newspaper advertisements and websites making the public aware of open clinical studies for individuals with diabetes. The study protocol was approved by the ethics committee of Helsinki University and Helsinki University Hospital (May 19, 2014; decision number 31/13/01/01/2014) and the National Agency of Medicines, Helsinki, Finland (April 8, 2014; EudraCT 2013‐005075‐40). The study participants were enrolled between February 2015 and November 2017. The study was undertaken in accordance with the Declaration of Helsinki and the European Medicines Agency Note for Guidance on Good Clinical Practice. Patients provided written informed consent before study procedures were initiated.
2.2. Inclusion criteria
Obese patients (waist >88 cm in women and >92 cm in men; BMI 27‐40 kg/m2) with type 2 diabetes, under treatment with lifestyle changes or metformin (any dose), who had an HbA1c value of 42 to 75 mmol/mol (6%‐9%) were eligible for the study. Additional inclusion criteria were age of 30 to 75 years, triglycerides at 1.0 to 4.0 mmol/L and LDL‐cholesterol <4.5 mmol/L.
2.3. Exclusion criteria
Exclusion criteria included type 1 diabetes, apoE2/2 phenotype, elevated liver enzymes (alanine transaminase/aspartate transaminase ratio > 3× upper limit of normal), eGFR <60 mL/min, clinically significant thyroid‐stimulating hormone outside normal range, use of lipid‐lowering drugs other than statins within 6 months, treatment with pioglitazone, insulin, sulphonylureas, gliptines, glinides, sodium‐glucose co‐transporter 2 inhibitors or thiazide diuretics (at a dose of >25 mg/day) within 6 months, uncontrolled blood pressure (>160 mm Hg systolic and/or >105 mm Hg diastolic), history of pancreatitis, stomach or other major bleeding, thyroid disorder, any medical condition that increases risk of dehydration, concurrent medical condition that would interfere with interpretation of efficacy and safety data during the study, absence of contraceptives in women of childbearing potential, previous experience of side‐effects from GLP‐1 receptor agonists, and non‐compliance or withdrawn consent form.
2.4. Randomization and study treatment
In total, 54 subjects were assessed for eligibility, of whom 31 were excluded because of failure to meet inclusion criteria (n = 28) or declining to participate (n = 1), or for other reasons (n = 2). All eligible participants used stable daily doses of metformin and statin throughout the study period. At screening, if a participant was not already undergoing metformin and/or statin treatment, those treatments were initiated. After a 4‐week run‐in period, participants were randomly allocated (2:1) by the study physician to either the group receiving liraglutide 1.8 mg or the group receiving placebo in a self‐injecting device for 16 weeks. Liraglutide and placebo were provided by Novo Nordisk A/S. The study was single blinded, with two groups, in order to achieve similar weight‐loss in the liraglutide and placebo arms. The groups were matched for age and BMI. Participants kept a 3‐day food diary before and at the end of the study treatment period. Participants measured their weight at home and were supervised by a study nutritionist (weekly contact) to achieve a weight loss goal of 3 kg. The weight loss target was extrapolated from previous studies in populations with type 2 diabetes, being treated with background metformin, that showed an average weight loss with liraglutide 1.8 mg of 2.8 to 3.4 kg.24, 25, 26 Participants were instructed to avoid alcohol and strenuous exercise within 72 hours of each study visit. Serum amylase and lipase were measured at screening, and at Weeks 8 and 16.
Participants attended the study centre on two separate occasions before the treatment period for the fat‐rich mixed meal tolerance test and for abdominal magnetic resonance imaging. These tests were repeated in participants after 14 to 16 weeks of treatment.
Participants' weight and height were measured in the study centre, barefoot with underwear, after an overnight fast. Waist circumference was taken at the midpoint between the lower rib margin and the iliac crest; three consecutive readings were taken, and the mean was recorded. Body composition was assessed in a fasting state, after voiding, by a single‐frequency bioelectrical impedance analysis (BIA) device (Omron BF‐500; Omron Medizintechnik, Mannheim, Germany).
2.5. Fat‐rich mixed meal test
Participants received a fat‐rich mixed meal in the morning after an overnight fast. The meal consisted of bread, butter, cheese, ham, boiled eggs, fresh red pepper, low‐fat (1%) milk, orange juice and tea or coffee (56 g fat, 63 g carbohydrates and 40 g protein; total 927 kcal) and was consumed within 10 minutes. Blood samples were obtained at fasting and at 0.5, 1, 2, 3, 4, 6 and 8 hours after the meal. During the test, only water was allowed ad libitum and the participants remained physically inactive.
On the evening before the study day, participants received 2 g/kg deuterated water (2H2O; Larodan Fine Chemicals, Solna, Sweden), which was consumed between 6:00 pm and 10:00 pm to assess the contribution of de novo lipogenesis to fatty acids in VLDL. A blood sample was drawn as a background sample during the week before the meal test day. De novo lipogenesis was analysed at 0 hour and was calculated from enrichment of deuterated water ingested during the kinetic study at the specified time points.12
2.6. Proton magnetic resonance spectroscopy
Proton magnetic resonance spectroscopy was performed using a 1.5‐T whole‐body device to determine liver fat content27 and subcutaneous abdominal and intra‐abdominal fat.28 All analyses of imaging results were performed by a single person (A. H.). Participants were advised to fast for 4 hours before imaging.
2.7. Biochemical analysis
Lipoprotein fractions (chylomicrons [Sf > 400]; large VLDL1 particles [Sf 60‐400] and smaller VLDL2 particles [Sf 20‐60]) from blood samples drawn before and during the fat‐rich mixed meal test were separated by density gradient ultracentrifugation.29 Triglyceride and cholesterol concentrations in total plasma and lipoprotein fractions, as well as TRL cholesterol and remnant‐lipoprotein cholesterol, were analysed by automated enzymatic methods, using the Konelab 60i analyzer (Thermo Fisher Scientific, Vantaa, Finland). Fasting and postprandial apolipoprotein (apo) B48 levels in total plasma were measured by ELISA (Shibayagi, Shibukawa, Japan). Concentrations of plasma glucose and insulin were measured using the hexokinase method (Gluco‐quant; Roche Diagnostic, Mannheim, Germany) and electrochemiluminescence (Roche sandwich immunoassay on a Cobas autoanalyser), respectively.
Plasma levels of apoCIII were measured immunoturbidometrically (Kamiya Biomedical Company, Seattle, Washington) and β‐hydroxybutyrate concentrations were measured by an enzymatic method with a β‐hydroxybutyrate FS kit (DiaSys Diagnostic Systems, Holzheim, Germany) on a Konelab 60i analyzer (Thermo Fisher Scientific). Plasma non‐esterified fatty acids (NEFA) were analysed using an automated enzymatic colorimetric method (Wako Chemicals, Neuss, Germany).
2.8. Statistical analysis
Statistical analyses were performed using SPSS (IBM Corporation, New York, New York) and GraphPad Prism version 7 (http://www.graphpad.com/scientific-software/prism/). Data are presented as mean ± SD or mean ± SE. The area under the curve (AUC) was calculated using the trapezoidal rule. For all variables, P values were calculated using the Wilcoxon signed‐rank test or the Mann–Whitney U‐test. Nonparametric tests were used, as many clinical variables could not be assumed to be normally distributed. Correlation coefficients and their corresponding P values were calculated using Spearman's rank test. Significance was set at P < 0.05.
Matsuda Index and HOMA2‐IR were calculated for time points 0, 30, 60 and 120 minutes after the fat‐rich mixed meal test (for 63 g carbohydrates), using online‐calculators (http://mmatsuda.diabetes-smc.jp/4pointssi.html and http://www.dtu.ox.ac.uk/homacalculator/).
Relative importance analysis, similar to partial R‐squared analysis, was undertaken to estimate how each of the measured variables contributed to explaining the variance in the parameter of interest. If all variables were uncorrelated, this quantification would be equivalent to the variable's individual R‐squared value. However, because this was not the case, we calculated each variable's relative contribution using four methods: lmg, 30 pratt, 31 last 32 and first.32 The mean of these four methods is presented as results. The analysis was performed using the R package “relaimpo” (https://cran.r-project.org/web/packages/relaimpo/relaimpo.pdf).32 Repeated measures ANOVA was used to test for within‐group differences before, compared to after, the 16‐week intervention for variables measured at several time points after the oral fat tolerance test.
3. RESULTS
3.1. Demographics, body weight and glycaemia
We recruited 23 participants (17 men, 6 women) to the study. In total, 22 participants completed the study. One participant in the liraglutide arm discontinued the study at Week 7 because of nausea. None of the other participants reported adverse effects during the study, with the exception of mild nausea. Table 1 presents the characteristics of study participants.
Table 1.
Characteristics of study subjects (n = 22) at baseline and at Week 16
| Liraglutide group | Placebo group | |
|---|---|---|
| Sex, men/women | 13 / 2 | 3 / 4 |
| Age, years | 62 ± 2 | 63 ± 2 |
| Duration of diabetes, years | 7.8 ± 4.7 | 5.9 ± 6.5 |
| Before | After | Change | P | Before | After | Change | P | |
|---|---|---|---|---|---|---|---|---|
| Weight, kg | 98.6 ± 11.0 | 96.1 ± 11.2 | −2.4 ± 2.5 (−2.5%) | 0.002 | 92.0 ± 7.4 | 89.8 ± 6.3 | −2.1 ± 3.0 (−2.2%) | 0.128 |
| BMI, kg/m2 | 31.8 ± 3.4 | 31.0 ± 3.7 | −0.8 ± 0.8 (−2.5%) | 0.003 | 33.0 ± 4.1 | 32.3 ± 4.1 | −0.7 ± 1.2 (−2.2%) | 0.128 |
| Waist, cm | 114.4 ± 6.7 | 111.8 ± 8.0 | −2.6 ± 3.6 (−2.3%) | 0.017 | 115.0 ± 5.5 | 112.4 ± 6.2 | −2.6 ± 4.4 (−2.2%) | 0.352 |
| Syst. RR, mm Hg | 135 ± 14 | 139 ± 11 | 4 ± 13 (3.5%) | 0.173 | 145 ± 10 | 137 ± 11 | −8 ± 6 (−5.2%) | 0.018 |
| Diast. RR, mm Hg | 81 ± 7 | 86 ± 5 | 5 ± 6 (6.7%) | 0.012 | 86 ± 6 | 85 ± 8 | −1 ± 6 (−1.0%) | 0.397 |
| Heart rate, beats/min | 66 ± 11 | 72 ± 12 | 6 ± 9 (10.4%) | 0.014 | 63 ± 13 | 65 ± 9 | 2 ± 12 (6.8%) | 0.933 |
| fP‐Glucose, mmol/L | 8.3 ± 2.4 | 6.4 ± 1.2 | −1.9 ± 1.4 (−20.9%) | 0.001 | 6.5 ± 0.8 | 6.4 ± 0.9 | −0.0 ± 0.3 (−0.8%) | 0.865 |
| HbA1c, mmol/mol | 53.4 ± 11.4 | 47.0 ± 8.1 | −6.4 ± 7.4 (−10.9%) | 0.005 | 45.0 ± 3.8 | 46.0 ± 5.6 | 1.0 ± 3.1 (2.1%) | 0.343 |
| HbA1c, % | 7.0 ± 1.0 | 6.4 ± 0.7 | −0.6 ± 0.7 (−7.8%) | 0.005 | 6.3 ± 0.3 | 6.4 ± 0.5 | 0.1 ± 0.3 (1.5%) | 0.343 |
| Insulin, μU/mL | 13.9 ± 4.8 | 14.5 ± 4.9 | 0.6 ± 3.9 (8.3%) | 0.532 | 13.8 ± 6.9 | 14.1 ± 5.5 | 0.2 ± 4.2 (19.6%) | 0.735 |
| Matsuda index | 2.5 ± 1.0 | 3.5 ± 1.8 | 1.0 ± 1.5 (45%) | 0.017 | 3.1 ± 1.7 | 3.1 ± 1.3 | 0.01 ± 0.9 (6.7%) | 0.753 |
| HOMA2‐IR | 2.0 ± 0.7 | 2.0 ± 0.6 | 0.0 ± 0.5 (2.1%) | 1 | 1.9 ± 0.9 | 1.9 ± 0.7 | 0.0 ± 0.5 (19%) | 0.81 |
| Cholesterol, mmol/L | 4.0 ± 0.7 | 3.8 ± 0.7 | −0.2 ± 0.4 (−4.5%) | 0.064 | 4.4 ± 0.9 | 4.4 ± 1.1 | 0.0 ± 0.5 (−0.8%) | 0.933 |
| HDL‐C, mmol/L | 1.3 ± 0.4 | 1.3 ± 0.4 | 0.0 ± 0.2 (2.8%) | 0.950 | 1.5 ± 0.3 | 1.5 ± 0.3 | 0.0 ± 0.1 (0.9%) | 0.799 |
| Triglycerides, mmol/L | 1.7 ± 0.7 | 1.5 ± 0.6 | −0.2 ± 0.6 (−10.8%) | 0.064 | 1.4 ± 0.6 | 1.3 ± 0.4 | −0.1 ± 0.4 (−4.3%) | 0.469 |
| LDL‐C, mmol/L | 2.1 ± 0.7 | 1.8 ± 0.6 | −0.2 ± 0.3 (−10.2%) | 0.008 | 2.5 ± 0.9 | 2.3 ± 0.8 | −0.2 ± 0.3 (−5.2%) | 0.237 |
| apoCIII, mg/dL | 12.0 ± 4.4 | 9.9 ± 3.7 | −2.1 ± 3.4 (−10.7%) | 0.018 | 9.7 ± 2.8 | 8.6 ± 1.8 | −1.1 ± 2.6 (−7.2%) | 0.578 |
| DNL, μmol/L | 15.4 ± 7.4 | 19.1 ± 13.1 | 4.4 ± 10.1 (35%) | 0.152 | 12.6 ± 7.5 | 13.8 ± 11.2 | 1.2 ± 6.6 (13.7%) | 0.866 |
| NEFA, μmol/L | 541 ± 134 | 504 ± 179 | −0.7 ± 209 (−4.2%) | 0.426 | 649 ± 230 | 580 ± 188 | −69 ± 262 (−4.5%) | 0.688 |
| β‐OH, mg/dL | 1.0 ± 0.7 | 0.8 ± 0.5 | −0.2 ± 0.5 (−13%) | 0.188 | 1.6 ± 1.2 | 1.0 ± 0.8 | −0.5 ± 1.0 (−22%) | 0.219 |
| Liver fat, % | 14.8 ± 7.4 | 10.7 ± 6.3 | −4.1 ± 2.9 (−31.0%) | 0.001 | 16.1 ± 9.3 | 13.9 ± 9.7 | −2.2 ± 1.9 (−17.9%) | 0.028 |
| VAT, cm3 | 3403 ± 941 | 3185 ± 1014 | −217 ± 393 (−6.8%) | 0.047 | 2710 ± 836 | 2600 ± 825 | −110 ± 249 (−4.2%) | 0.499 |
| SAT, cm3 | 4043 ± 1129 | 3792 ± 1185 | −251 ± 239 (−7.1%) | 0.004 | 5400 ± 1598 | 5161 ± 1653 | −239 ± 345 (−4.9%) | 0.128 |
Abbreviations: β‐OH, β‐hydroxybutyrate; DNL, de novo lipogenesis; SAT, subcutaneous adipose tissue; VAT, visceral adipose tissue.
Data are given as mean ± SD. Mean changes from baseline to Week 16 are shown with ±SD and percentages. Within‐group P values were calculated using the Wilcoxon signed‐rank test; P values < 0.05 are indicated in bold.
Mean weight loss was similar in both groups at Week 16: −2.4 kg (−2.5%) in the liraglutide group and −2.1 kg (−2.2%) in the placebo group (Table 1). Regression analysis of weekly body weight measurements showed significant time effects for the liraglutide group (P = 1.2e‐15) and the placebo group (P = 7.7e‐6), but no significant group effect (P = 0.10), indicating that participants in both groups lost weight at a similar rate. Individual weight curves during the study are available online (Figure S1, Supporting Information).
As expected, liraglutide treatment resulted in a significant lowering of fasting glucose concentration and HbA1c, but no improvements in glycaemic control were observed in the placebo group (Table 1). Following a fat‐rich mixed meal, the postprandial responses of glucose and insulin were attenuated in the liraglutide group (P < 0.05; one‐way repeated measures ANOVA for AUC) but not in the placebo group (Figure 1 and Table S1, Supporting Information). Multiple regression analysis showed a significant difference between the groups with regard to reductions in HbA1c (P = 0.022), fasting glucose (P = 0.0030) and glucose AUC (P = 0.0023) when controlling for weight loss.
Figure 1.
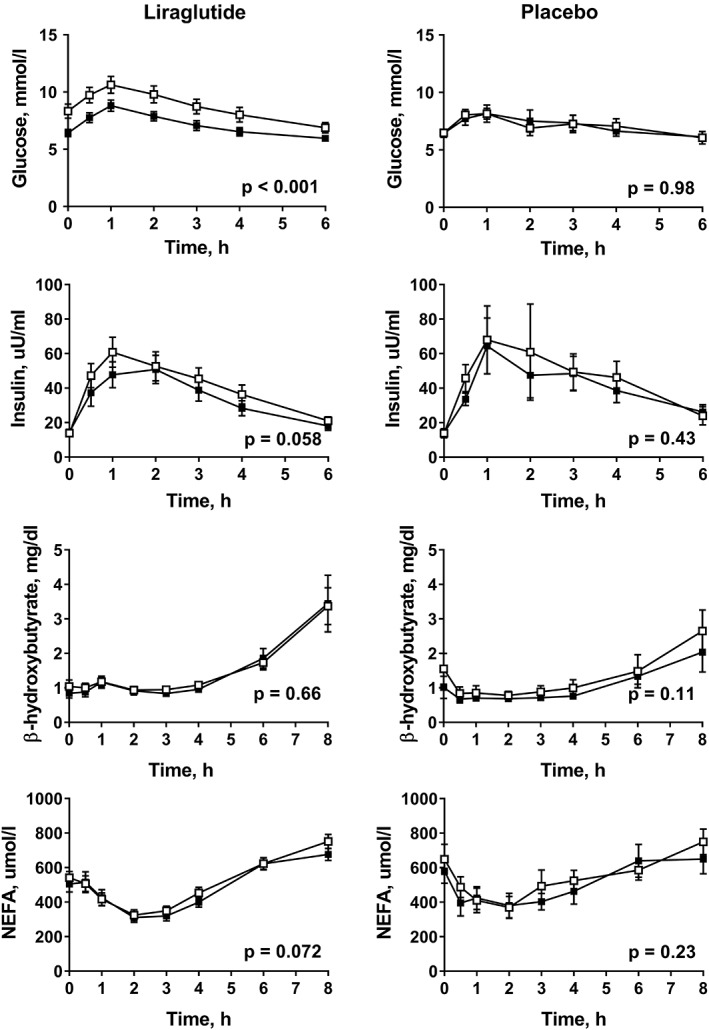
Responses of plasma glucose, insulin, β‐hydroxybutyrate and NEFA after a fat‐rich mixed meal before treatment (open squares) and at week 16 (filled squares) in patients with type 2 diabetes being treated with liraglutide (n = 15) or receiving placebo (n = 7). P values were calculated using the ANOVA repeated measures test for within‐group differences
3.2. Fat depots, de novo lipogenesis and hepatic fat oxidation
Liver fat decreased significantly in both groups, by 31% and 18% in the liraglutide and placebo groups, respectively, after 16 weeks of treatment (Table 1). Both visceral adipose tissue and subcutaneous adipose tissue decreased significantly in the liraglutide group but not in the placebo group (Table 1). We also estimated adipose tissue content using the bioimpedance analysis (BIA) method, and found it to be in line with MRI results, with no variation or difference in loss of fat‐free mass (muscle) or in fat mass between the groups. Estimates of loss of visceral fat mass showed a trend towards greater loss in the LIRA group, but the difference was not significant (P = 0.069).
However, decreases in liver fat, visceral adipose tissue or subcutaneous adipose tissue did not differ significantly between the two groups in a multiple regression analysis with weight change and group included in the model as independent variables (data not shown).
We did not observe any significant changes in hepatic de novo lipogenesis (Table 1), in fasting levels or postprandial β‐hydroxybutyrate, a marker of hepatic fat oxidation, or in NEFA responses in either group (Table 1, Figure 1 and Table S1).
3.3. Fasting and postprandial lipids
Liraglutide treatment resulted in a trend towards reduction in fasting triglycerides (P = 0.064) and significant reductions in fasting LDL‐cholesterol but did not induce any change in HDL‐cholesterol (Table 1). No changes in fasting lipids occurred in the placebo group (Table 1). Despite similar weight loss in both groups, postprandial triglyceride, chylomicron‐triglyceride, VLDL1‐triglyceride and apoB48 responses were attenuated only in the liraglutide group (P < 0.05; one‐way repeated measures ANOVA) (Figure 2 and Table S1, Supporting Information). Furthermore, postprandial remnant‐like particle cholesterol (RLP)‐cholesterol and TRL‐cholesterol responses were significantly decreased in the liraglutide group, but not in the placebo group (P < 0.05; one‐way repeated measures ANOVA) (Figure 3 and Table S1, Supporting Information). Multiple regression analysis showed a significant difference between the groups in changes in postprandial AUC for triglycerides (P = 0.03) and chylomicron‐triglycerides (P = 0.0065), but not in changes in postprandial AUC for VLDL1‐triglycerides, apoB48, TRL‐cholesterol or RLP‐cholesterol when controlling for weight loss.
Figure 2.
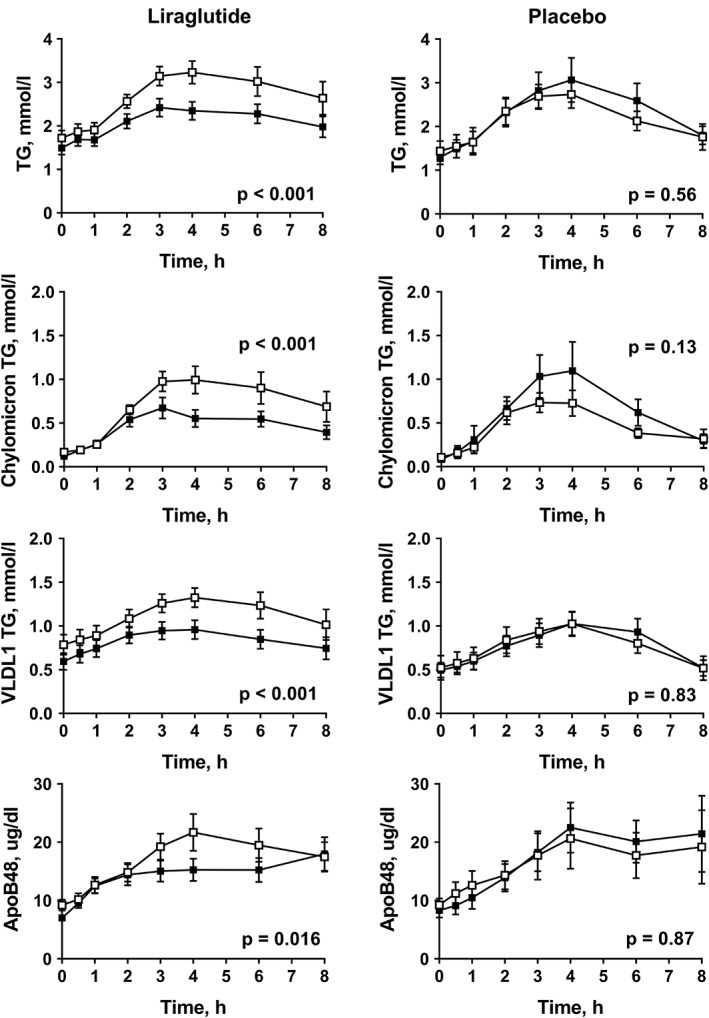
Responses of plasma triglycerides (TG), chylomicron TG, VLDL1 TG and plasma apoB48 after a fat‐rich mixed meal before treatment (open squares) and at week 16 (filled squares) in subjects with type 2 diabetes treated with liraglutide (n = 15) or placebo (n = 7). P values were calculated using the ANOVA repeated measures test for within‐group differences
Figure 3.

Responses of plasma apoCIII, remnant‐like particle cholesterol (RLP‐C) and triglyceride‐rich lipoprotein cholesterol (TRL‐C) after a fat‐rich mixed meal before treatment (open squares) and at week 16 (filled squares) in subjects with type 2 diabetes treated with liraglutide (n = 15) or placebo (n = 7). P values were calculated using the ANOVA repeated measures test for within‐group differences
We also studied the impact of liraglutide on apoCIII, a critical regulator of postprandial triglyceride metabolism33. Fasting apoCIII concentrations decreased markedly, by 10.7%, in the liraglutide group (P = 0.018), but not in the placebo group (P = 0.578). Postprandial apoCIII responses were also attenuated in the liraglutide group (P < 0.001), but not in the placebo group (P = 0.25) (Figures 3 and S1, Supporting Information).
3.4. Determinants of metabolic improvements
Despite similar weight loss in both groups, the only significant changes observed in the placebo group were reductions in liver fat and systolic blood pressure (Table 1), whereas multiple metabolic improvements were observed in the liraglutide group (see above). To determine the factors that are driving the decrease in postprandial TRL‐cholesterol, RLP‐cholesterol and apoCIII, we performed a correlation analysis of changes in metabolic parameters during the treatment period in the liraglutide group. We found that decreases in apoCIII were significantly related to decreases in glucose (r = 0.65; P = 0.009) and HbA1c (r = 0.64; P = 0.01), but were not related to changes in weight, liver fat, visceral adipose tissue or subcutaneous adipose tissue (Figure S2, Supporting Information). Changes in apoCIII also correlated significantly with decreases in postprandial AUC values for plasma triglycerides, RLP‐cholesterol and TRL‐cholesterol (Figure S2, Supporting Information). Thus, these results highlight the importance of apoCIII as a link between glycaemic control and hypertriglyceridaemia and the importance of its role as a modulator of postprandial TRL remnant metabolism.
We performed a relative importance analysis to determine the impact of improvements in weight, liver fat, visceral fat and glycaemia on postprandial triglyceride, TRL‐cholesterol, RLP‐cholesterol and apoCIII responses. Approximately half of the variation in postprandial triglyceride, TRL‐cholesterol and RLP‐cholesterol responses (48%, 56% and 59%, respectively) were explained by reductions in postprandial apoCIII AUC alone (Figure 4A‐C). In contrast, reductions in weight, glycaemic control, postprandial insulin AUC or liver fat individually explained less than 10% of the changes in these lipid‐related variables (Figure 4A‐C). We also examined which variables would explain the reduction in postprandial apoCIII AUC. Approximately 43% of the variation in the reduction in postprandial apoCIII AUC was explained by a reduction in HbA1c alone, with other factors explaining less than 7% individually (Figure 4D). We also used a regression model, in which change in HbA1c was excluded in favour of change in fasting glucose. In this model, reductions in fasting glucose explained 32% of the variation in reduction in postprandial apoCIII AUC.
Figure 4.
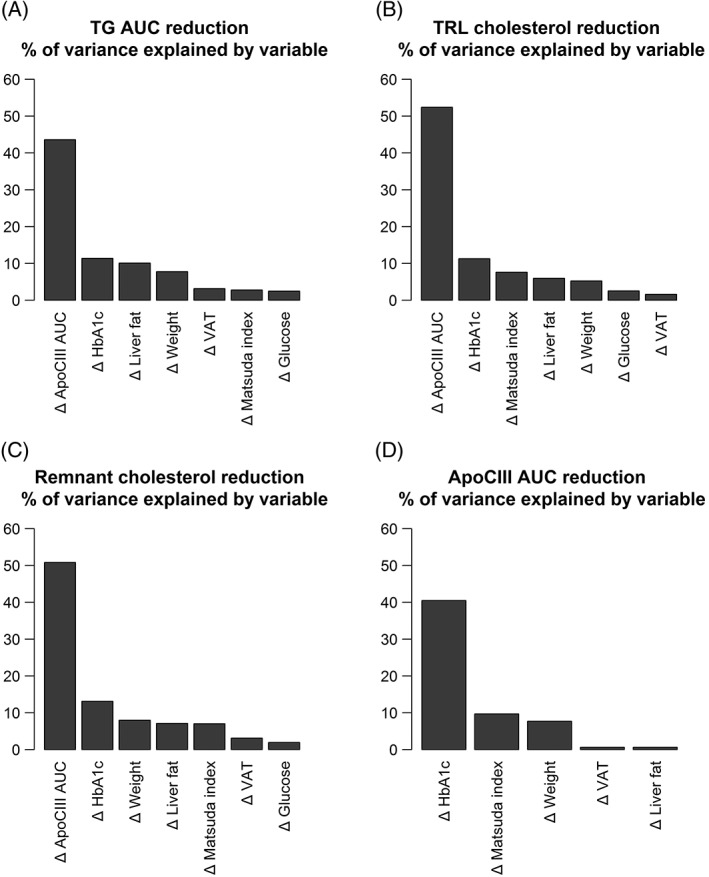
Relative importance analysis demonstrating the percentage contribution of changes in various metabolic parameters to reduction (delta, Δ) in A, plasma TG area under the curve (AUC); B, plasma remnant‐like particle cholesterol (RLP‐C) AUC; C, triglyceride‐rich lipoprotein cholesterol (TRL‐C); and D, plasma apoCIII AUC. Height of bar shows the absolute percentage contribution, calculated using an average of four different methods (see the Material and Methods section). Variables to be included in the regression model were chosen based on hypothesized physiological relevance to the trait of interest. Exclusion of Matsuda index in favour of HOMA2‐IR did not significantly affect the results
4. DISCUSSION
In the present study, we investigated how a 16‐week treatment period with the long‐acting GLP‐1 analogue liraglutide affected body composition, ectopic fat depots, liver lipid handling and postprandial TRL metabolism in patients with adequately controlled type 2 diabetes who were undergoing statin and metformin treatment. Because liraglutide is known to promote weight loss, we compared liraglutide and placebo in a study designed to achieve similar weight loss in both groups. Weight reduction was similar in both groups and, as expected, treatment with liraglutide improved glycaemia. We also observed that treatment with liraglutide resulted in multiple improvements in cardiometabolic risk factors that were not seen in the placebo group. These improvements appeared to be affected, in part, by weight‐dependent mechanisms and, in part, by liraglutide‐specific effects.
We observed that concentrations of serum triglycerides, chylomicrons and large VLDL1 particles after a high‐fat mixed meal were significantly lower at the end of the treatment period in the liraglutide group, but not in the placebo group. These data indicate that liraglutide treatment promoted more consistent reductions in postprandial lipaemia than did placebo and suggest that the effect of liraglutide on the postprandial chylomicron response may be, in part, independent of weight loss. These results are in line with proposed class effects of incretin‐based therapies on postprandial TRL metabolism.34
Another novel finding was the marked reduction in postprandial atherogenic remnant particles in the liraglutide group. Studies with the dipeptidyl peptidase‐IV inhibitors alogliptin35 or vildagliptin,36 or with a single injection of the GLP‐1 receptor agonist exenatide,37 have shown beneficial effects on remnant cholesterol, but we are not aware of previous results concerning RLPs after long‐term treatment with GLP‐1 receptor agonists. We have reported previously a strong correlation between RLP‐cholesterol and increased VLDL1‐triglycerides in type 2 diabetes.6 Remnant cholesterol is directly linked to the formation of atherosclerotic plaques, as the size and charge of RLPs allow them to penetrate into and to be retained in the vascular intima.38, 39, 40 Increased postprandial RLPs may be important, therefore, for the accelerated atherogenesis in type 2 diabetes. Indeed, RLP‐cholesterol has been shown to independently predict prevalent coronary artery disease.4, 5, 41 It can thus be hypothesized that the improved metabolism of remnant particles induced by liraglutide may lead to decreased intimal cholesterol deposition and CVD. However, this remains to be tested in clinical outcome studies.
Postprandial concentrations of TRLs are regulated mainly by the balance between production and clearance of these particles. The amount of liver fat plays a critical role in this process and hepatic lipid accumulation associates with the overproduction of large VLDL1 particles.42 The direct effect of liraglutide on liver fat has been studied both in patients with type 2 diabetes and in non‐diabetic control participants.20 We observed significant decreases in liver fat in both the liraglutide group (31%) and the placebo group (18%), but the difference between the groups was not significant, possibly because of the small number of participants included in the placebo group. Genetic variation can also affect the susceptibility for liver fat accumulation, but there was no difference in the incidence of genetic variants, PNPLA3, TM6SF2 or MBOAT7, linked to increased hepatic steatosis between the groups (data not shown). Notably, we did not observe any effects of liraglutide on hepatic β‐oxidation, de novo lipogenesis or postprandial NEFA concentrations. Thus, findings from earlier in vitro studies, indicating that GLP‐1 suppresses hepatic lipogenesis43 and activates hepatic fatty acid β‐oxidation,44 could not be confirmed in this clinical study.
A recent study in seven patients with non‐alcoholic steatohepatitis (NASH) reported that treatment with liraglutide (1.8 mg daily) induced minor reductions in hepatic de novo lipogenesis and NEFA flux to the liver.45 However, participants in the liraglutide group lost 6 kg of body weight so the effects reported might be weight dependent. Furthermore, the authors did not report whether any changes in liver fat were noted for NASH patients. Notably, several studies have failed to confirm the expression of GLP‐1 receptors in hepatocytes,46 possible indicating that the primary sites of action of GLP‐1 are non‐hepatic.
Which factors could explain the improvement in postprandial TRL metabolism in response to liraglutide therapy? Previous studies have shown that apoCIII concentrations closely correlate with plasma triglyceride levels,40, 47, 48 and here we observed marked reductions in fasting and postprandial apoCIII concentrations in the liraglutide group. Furthermore, these reductions correlated closely with improvements in glucose and HbA1c. Hepatic apoCIII expression is increased by glucose through activation of the carbohydrate‐responsive element‐binding protein (ChREBP)49. Therefore, apoCIII has been identified as an important link between hyperglycaemia and hypertriglyceridaemia.33 We recently demonstrated that both apoCIII and plasma triglycerides were markedly reduced by a carbohydrate‐restricted diet in obese patients with NAFLD.50 Consistently, the decrease in postprandial apoCIII responses during liraglutide therapy explained at least 50% of the reductions in postprandial triglycerides, RLP‐cholesterol and TRL‐cholesterol. Interestingly, liver fat loss or improvement in insulin sensitivity by Matsuda Index or HOMA2‐IR explained less than 10% of these parameters in the model. These results are in line with earlier turn‐over studies using stable isotopes that have revealed that increased secretion of VLDL1‐triglycerides explains only a minor part of the increased serum triglycerides in obese patients with NAFLD, and that the main determinant of plasma triglycerides in these patients is impaired clearance of VLDL1‐triglycerides.49 Importantly, this defect was closely associated with increased concentrations of apoCIII.40 Furthermore, our previous data suggest that the capacity of the lipolytic pathway is a determinant of both fasting and non‐fasting triglyceride levels.11 In light of these findings, taken together, improved glycaemia during liraglutide treatment may play a key role in improving postprandial TRL remnant metabolism.
Our study has several strengths. It is the first report to investigate how liraglutide affects ectopic fat depots, hepatic lipogenesis and fat oxidation, and postprandial lipid metabolism in addition to glycaemia. Second, the study was designed to test whether the cardiometabolic beneficial effects of liraglutide are mainly weight independent or weight‐loss dependent. Third, the study clarifies for the first time results concerning remnant lipoprotein metabolism after long‐term treatment with GLP‐1 receptor agonists. Our study also has several weaknesses. An important limitation is the small number of participants in the placebo group because of the 2:1 allocation design, which results in lack of statistical power. Another limitation is the trend towards baseline differences between the groups. In addition, the study requires validation and it is too early to translate the beneficial data concerning cardiometabolic risk factors into clinical practice. However, our results lay the groundwork for future studies focused on the cardiometabolic benefits of GLP‐1 analogues. These studies must better define the patient group that will gain most from the reduction in cardiometabolic risk factors.
In summary, the results show that liraglutide intervention was associated with multiple improvements in cardiometabolic risk factors that were not seen in the placebo group. These improvements appeared to be impacted, in part, by weight‐dependent mechanisms, and in part by liraglutide‐specific effects. Of particular importance was a marked reduction in postprandial atherogenic remnant particles in the liraglutide group. The underlying mechanism may be improved glycaemic control, which leads to reduced expression of apoCIII, a key regulator of hypertriglyceridaemia in hyperglycaemic patients.
Supporting information
Table S1. Postprandial area under curve (AUC) responses for lipids, lipoproteins, glucose, insulin, β‐hydroxybutyrate and NEFA after a fat‐rich mixed meal at baseline and week 16 are shown as mean ± SD. The change from baseline to week 16 is shown as mean ± SD and percentages ± SD. The AUC values were calculated from 0 to 6 hours for plasma glucose and insulin concentrations and from 0 to 8 hours for other parameters shown in the table. Figures 1, 2 and 3 in the main article indicate if the postprandial curves increased or decreased during the postprandial period. The within‐group p values have been calculated using the Wilcoxon signed‐rank test. β‐OH, β‐hydroxybutyrate; RLP‐C, remnant‐like particle cholesterol; TRL‐C, triglyceride‐rich lipoprotein cholesterol. P values <0.05 are bold.
Figure S1. Changes in weight during the 16‐week study period (liraglutide group red lines, placebo group blue lines). A, Individual curves and B, mean ± SD for each group. The weights at baseline and week 16 were measured at research institute during on the fat‐rich mixed meal test visit with a calibrated scale. Other measurements were recorded weekly with a home scale and reported to the study dietician or nurse by the subjects.
Figure S2. A correlation matrix between changes in metabolic variables. Subjects in the liraglutide group only are included in the matrix. Colour (A) or number (B) indicates value of spearman correlation coefficient. Absence of coloured circle in a cell indicates p‐value of correlation > than 0.05.
ACKNOWLEDGMENTS
We wish to acknowledge the skillful clinical nurse Elisa Koivisto and the laboratory nurses Helinä Perttunen‐Nio, Hannele Hildén, Virve Naatti and Johanna Backström. We also thank Dr. Rosie Perkins for excellent scientific editing and discussions.
Conflict of interest
The authors report no duality of interest.
Author contributions
The authors contributed to the present work as follows: M. R. T., N. M., S. S., K. P. and J. B. contributed to conception and design; N. M., S. S., K. P., A. H. and N. L. to the acquisition of data or analysis: and N. M., S. S., E. B., M. R. T. and J. B. to the interpretation of data. N. M., S. S., E. B., M. R. T. and J. B. drafted the original and revised manuscripts and all authors approved the final version to be published.
Matikainen N, Söderlund S, Björnson E, et al. Liraglutide treatment improves postprandial lipid metabolism and cardiometabolic risk factors in humans with adequately controlled type 2 diabetes: A single‐centre randomized controlled study. Diabetes Obes Metab. 2019;21:84–94. 10.1111/dom.13487
Niina Matikainen and Sanni Söderlund shared first authorship.
Marja‐Riitta Taskinen and Jan Borén ‐ equal senior authorship.
Funding information This project was supported by an investigator‐initiated research proposal funded by Novo Nordisk, and by grants from Swedish Heart‐Lung Foundation, Swedish Research Council and Sahlgrenska University Hospital, Sigrid Juselius Foundation, and EU 7th Framework Program RESOLVE (305707).
REFERENCES
- 1. Cholesterol Treatment Trialists' (CTT) Collaborators , Mihaylova B, Emberson J, et al. The effects of lowering LDL cholesterol with statin therapy in people at low risk of vascular disease: meta‐analysis of individual data from 27 randomised trials. Lancet. 2012;380:581‐590. [DOI] [PMC free article] [PubMed] [Google Scholar]
- 2. Gaede P, Oellgaard J, Carstensen B, et al. Years of life gained by multifactorial intervention in patients with type 2 diabetes mellitus and microalbuminuria: 21 years follow‐up on the Steno‐2 randomised trial. Diabetologia. 2016;59:2298‐2307. [DOI] [PMC free article] [PubMed] [Google Scholar]
- 3. Wild SH, Walker JJ, Morling JR, et al. Cardiovascular disease, cancer, and mortality among people with type 2 diabetes and alcoholic or nonalcoholic fatty liver disease hospital admission. Diabetes Care. 2018;41:341‐347. [DOI] [PubMed] [Google Scholar]
- 4. Varbo A, Freiberg JJ, Nordestgaard BG. Remnant cholesterol and myocardial infarction in normal weight, overweight, and obese individuals from the Copenhagen General Population Study. Clin Chem. 2018;64:219‐230. [DOI] [PubMed] [Google Scholar]
- 5. Varbo A, Benn M, Nordestgaard BG. Remnant cholesterol as a cause of ischemic heart disease: evidence, definition, measurement, atherogenicity, high risk patients, and present and future treatment. Pharmacol Ther. 2014;141:358‐367. [DOI] [PubMed] [Google Scholar]
- 6. Taskinen MR, Boren J. New insights into the pathophysiology of dyslipidemia in type 2 diabetes. Atherosclerosis. 2015;239:483‐495. [DOI] [PubMed] [Google Scholar]
- 7. Nordestgaard BG, Langsted A, Mora S, et al. Fasting is not routinely required for determination of a lipid profile: clinical and laboratory implications including flagging at desirable concentration cut‐points‐a joint consensus statement from the European Atherosclerosis Society and European Federation of Clinical Chemistry and Laboratory Medicine. Eur Heart J. 2015;37:1944‐1958. [DOI] [PMC free article] [PubMed] [Google Scholar]
- 8. Cohn JS, Johnson EJ, Millar JS, et al. Contribution of apoB‐48 and apoB‐100 triglyceride‐rich lipoproteins (TRL) to postprandial increases in the plasma concentration of TRL triglycerides and retinyl esters. J Lipid Res. 1993;34:2033‐2040. [PubMed] [Google Scholar]
- 9. Boren J, Matikainen N, Adiels M, Taskinen MR. Postprandial hypertriglyceridemia as a coronary risk factor. Clin Chim Acta. 2014;431:131‐142. [DOI] [PubMed] [Google Scholar]
- 10. Brunzell JD, Hazzard WR, Porte D Jr, Bierman EL. Evidence for a common, saturable, triglyceride removal mechanism for chylomicrons and very low density lipoproteins in man. J Clin Invest. 1973;52:1578‐1585. [DOI] [PMC free article] [PubMed] [Google Scholar]
- 11. Adiels M, Matikainen N, Westerbacka J, et al. Postprandial accumulation of chylomicrons and chylomicron remnants is determined by the clearance capacity. Atherosclerosis. 2012;222:222‐228. [DOI] [PubMed] [Google Scholar]
- 12. Matikainen N, Adiels M, Soderlund S, et al. Hepatic lipogenesis and a marker of hepatic lipid oxidation, predict postprandial responses of triglyceride‐rich lipoproteins. Obesity (Silver Spring). 2014;22:1854‐1859. [DOI] [PubMed] [Google Scholar]
- 13. Prasad‐Reddy L, Isaacs D. A clinical review of GLP‐1 receptor agonists: efficacy and safety in diabetes and beyond. Drugs Context. 2015;4:212283. [DOI] [PMC free article] [PubMed] [Google Scholar]
- 14. Marso SP, Daniels GH, Brown‐Frandsen K, et al. Liraglutide and cardiovascular outcomes in type 2 diabetes. N Engl J Med. 2016;375:311‐322. [DOI] [PMC free article] [PubMed] [Google Scholar]
- 15. Hermansen K, Baekdal TA, During M, et al. Liraglutide suppresses postprandial triglyceride and apolipoprotein B48 elevations after a fat‐rich meal in patients with type 2 diabetes: a randomized, double‐blind, placebo‐controlled, cross‐over trial. Diabetes Obes Metab. 2013;15:1040‐1048. [DOI] [PubMed] [Google Scholar]
- 16. Bunck MC, Corner A, Eliasson B, et al. One‐year treatment with exenatide vs. insulin glargine: effects on postprandial glycemia, lipid profiles, and oxidative stress. Atherosclerosis. 2010;212:223‐229. [DOI] [PubMed] [Google Scholar]
- 17. Zhong J, Maiseyeu A, Rajagopalan S. Lipoprotein effects of incretin analogs and dipeptidyl peptidase 4 inhibitors. Clin Lipidol. 2015;10:103‐112. [DOI] [PMC free article] [PubMed] [Google Scholar]
- 18. Junker AE, Gluud L, Holst JJ, Knop FK, Vilsboll T. Diabetic and nondiabetic patients with nonalcoholic fatty liver disease have an impaired incretin effect and fasting hyperglucagonaemia. J Intern Med. 2016;279:485‐493. [DOI] [PubMed] [Google Scholar]
- 19. Matikainen N, Bogl LH, Hakkarainen A, et al. GLP‐1 responses are heritable and blunted in acquired obesity with high liver fat and insulin resistance. Diabetes Care. 2014;37:242‐251. [DOI] [PubMed] [Google Scholar]
- 20. Petit JM, Verges B. GLP‐1 receptor agonists in NAFLD. Diabetes Metab. 2017;43(suppl 1):2S28‐2S33. [DOI] [PubMed] [Google Scholar]
- 21. Armstrong MJ, Gaunt P, Aithal GP, et al. Liraglutide safety and efficacy in patients with non‐alcoholic steatohepatitis (LEAN): a multicentre, double‐blind, randomised, placebo‐controlled phase 2 study. Lancet. 2016;387:679‐690. [DOI] [PubMed] [Google Scholar]
- 22. Kenny PR, Brady DE, Torres DM, Ragozzino L, Chalasani N, Harrison SA. Exenatide in the treatment of diabetic patients with non‐alcoholic steatohepatitis: a case series. Am J Gastroenterol. 2010;105:2707‐2709. [DOI] [PubMed] [Google Scholar]
- 23. Drucker DJ, Habener JF, Holst JJ. Discovery, characterization, and clinical development of the glucagon‐like peptides. J Clin Invest. 2017;127:4217‐4227. [DOI] [PMC free article] [PubMed] [Google Scholar]
- 24. Jendle J, Nauck MA, Matthews DR, et al. Weight loss with liraglutide, a once‐daily human glucagon‐like peptide‐1 analogue for type 2 diabetes treatment as monotherapy or added to metformin, is primarily as a result of a reduction in fat tissue. Diabetes Obes Metab. 2009;11:1163‐1172. [DOI] [PubMed] [Google Scholar]
- 25. Nauck M, Frid A, Hermansen K, et al. Long‐term efficacy and safety comparison of liraglutide, glimepiride and placebo, all in combination with metformin in type 2 diabetes: 2‐year results from the LEAD‐2 study. Diabetes Obes Metab. 2013;15:204‐212. [DOI] [PubMed] [Google Scholar]
- 26. Nauck M, Frid A, Hermansen K, et al. Efficacy and safety comparison of liraglutide, glimepiride, and placebo, all in combination with metformin, in type 2 diabetes: the LEAD (liraglutide effect and action in diabetes)‐2 study. Diabetes Care. 2009;32:84‐90. [DOI] [PMC free article] [PubMed] [Google Scholar]
- 27. Taskinen MR, Adiels M, Westerbacka J, et al. Dual metabolic defects are required to produce hypertriglyceridemia in obese subjects. Arterioscler Thromb Vasc Biol. 2011;31:2144‐2150. [DOI] [PubMed] [Google Scholar]
- 28. Ryysy L, Hakkinen AM, Goto T, et al. Hepatic fat content and insulin action on free fatty acids and glucose metabolism rather than insulin absorption are associated with insulin requirements during insulin therapy in type 2 diabetic patients. Diabetes. 2000;49:749‐758. [DOI] [PubMed] [Google Scholar]
- 29. Matikainen N, Manttari S, Schweizer A, et al. Vildagliptin therapy reduces postprandial intestinal triglyceride‐rich lipoprotein particles in patients with type 2 diabetes. Diabetologia. 2006;49:2049‐2057. [DOI] [PubMed] [Google Scholar]
- 30. Lindeman R, Merenda P. Gold R Introduction to Bivariate and Multidimensional Analysis. Glenview, IL: Scott Foresman; 1980. [Google Scholar]
- 31. Pratt JW. Dividing the indivisible: using simple symmetry to partition variance explained Proceedings of the Second International Tampere Conference in Statistics. Tampere, Finland: Department of Mathematical Sciences, University of Tampere; 1987:245‐260. [Google Scholar]
- 32. Grömping U. Relative importance for linear regression in R: the package relaimpo. J Stat Softw. 2006;17:1‐27. [Google Scholar]
- 33. Taskinen MR, Boren J. Why is apolipoprotein CIII emerging as a novel therapeutic target to reduce the burden of cardiovascular disease? Curr Atheroscler Rep. 2016;18:59. [DOI] [PMC free article] [PubMed] [Google Scholar]
- 34. Nauck MA, Meier JJ, Cavender MA, Abd El Aziz M, Drucker DJ. Cardiovascular actions and clinical outcomes with glucagon‐like peptide‐1 receptor agonists and dipeptidyl peptidase‐4 inhibitors. Circulation. 2017;136:849‐870. [DOI] [PubMed] [Google Scholar]
- 35. Eliasson B, Moller‐Goede D, Eeg‐Olofsson K, et al. Lowering of postprandial lipids in individuals with type 2 diabetes treated with alogliptin and/or pioglitazone: a randomised double‐blind placebo‐controlled study. Diabetologia. 2012;55:915‐925. [DOI] [PubMed] [Google Scholar]
- 36. Matikainen N, Taskinen MR. The effect of vildagliptin therapy on atherogenic postprandial remnant particles and LDL particle size in subjects with type 2 diabetes. Diabet Med. 2013;30:756‐757. [DOI] [PubMed] [Google Scholar]
- 37. Schwartz EA, Koska J, Mullin MP, Syoufi I, Schwenke DC, Reaven PD. Exenatide suppresses postprandial elevations in lipids and lipoproteins in individuals with impaired glucose tolerance and recent onset type 2 diabetes mellitus. Atherosclerosis. 2010;212:217‐222. [DOI] [PubMed] [Google Scholar]
- 38. Tabas I, Williams KJ, Boren J. Subendothelial lipoprotein retention as the initiating process in atherosclerosis: update and therapeutic implications. Circulation. 2007;116:1832‐1844. [DOI] [PubMed] [Google Scholar]
- 39. Boren J, Williams KJ. The central role of arterial retention of cholesterol‐rich apolipoprotein‐B‐containing lipoproteins in the pathogenesis of atherosclerosis: a triumph of simplicity. Curr Opin Lipidol. 2016;27:473‐483. [DOI] [PubMed] [Google Scholar]
- 40. Boren J, Watts GF, Adiels M, et al. Kinetic and related determinants of plasma triglyceride concentration in abdominal obesity: multicenter tracer kinetic study. Arterioscler Thromb Vasc Biol. 2015;35:2218‐2224. [DOI] [PubMed] [Google Scholar]
- 41. Jorgensen AB, Frikke‐Schmidt R, West AS, Grande P, Nordestgaard BG, Tybjaerg‐Hansen A. Genetically elevated non‐fasting triglycerides and calculated remnant cholesterol as causal risk factors for myocardial infarction. Eur Heart J. 2013;34:1826‐1833. [DOI] [PubMed] [Google Scholar]
- 42. Adiels M, Taskinen MR, Packard C, et al. Overproduction of large VLDL particles is driven by increased liver fat content in man. Diabetologia. 2006;49:755‐765. [DOI] [PubMed] [Google Scholar]
- 43. Ben‐Shlomo S, Zvibel I, Shnell M, et al. Glucagon‐like peptide‐1 reduces hepatic lipogenesis via activation of AMP‐activated protein kinase. J Hepatol. 2011;54:1214‐1223. [DOI] [PubMed] [Google Scholar]
- 44. Svegliati‐Baroni G, Saccomanno S, Rychlicki C, et al. Glucagon‐like peptide‐1 receptor activation stimulates hepatic lipid oxidation and restores hepatic signalling alteration induced by a high‐fat diet in nonalcoholic steatohepatitis. Liver Int. 2011;31:1285‐1297. [DOI] [PubMed] [Google Scholar]
- 45. Armstrong MJ, Hull D, Guo K, et al. Glucagon‐like peptide 1 decreases lipotoxicity in non‐alcoholic steatohepatitis. J Hepatol. 2016;64:399‐408. [DOI] [PMC free article] [PubMed] [Google Scholar]
- 46. Pyke C, Heller RS, Kirk RK, et al. GLP‐1 receptor localization in monkey and human tissue: novel distribution revealed with extensively validated monoclonal antibody. Endocrinology. 2014;155:1280‐1290. [DOI] [PubMed] [Google Scholar]
- 47. Hiukka A, Fruchart‐Najib J, Leinonen E, Hilden H, Fruchart JC, Taskinen MR. Alterations of lipids and apolipoprotein CIII in very low density lipoprotein subspecies in type 2 diabetes. Diabetologia. 2005;48:1207‐1215. [DOI] [PubMed] [Google Scholar]
- 48. Hiukka A, Stahlman M, Pettersson C, et al. ApoCIII‐enriched LDL in type 2 diabetes displays altered lipid composition, increased susceptibility for sphingomyelinase, and increased binding to biglycan. Diabetes. 2009;58:2018‐2026. [DOI] [PMC free article] [PubMed] [Google Scholar]
- 49. Caron S, Verrijken A, Mertens I, et al. Transcriptional activation of apolipoprotein CIII expression by glucose may contribute to diabetic dyslipidemia. Arterioscler Thromb Vasc Biol. 2011;31:513‐519. [DOI] [PubMed] [Google Scholar]
- 50. Mardinoglu A, Wu H, Bjornson E, et al. An integrated understanding of the rapid metabolic benefits of a carbohydrate‐restricted diet on hepatic steatosis in humans. Cell Metab. 2018;27:559‐571. [DOI] [PMC free article] [PubMed] [Google Scholar]
Associated Data
This section collects any data citations, data availability statements, or supplementary materials included in this article.
Supplementary Materials
Table S1. Postprandial area under curve (AUC) responses for lipids, lipoproteins, glucose, insulin, β‐hydroxybutyrate and NEFA after a fat‐rich mixed meal at baseline and week 16 are shown as mean ± SD. The change from baseline to week 16 is shown as mean ± SD and percentages ± SD. The AUC values were calculated from 0 to 6 hours for plasma glucose and insulin concentrations and from 0 to 8 hours for other parameters shown in the table. Figures 1, 2 and 3 in the main article indicate if the postprandial curves increased or decreased during the postprandial period. The within‐group p values have been calculated using the Wilcoxon signed‐rank test. β‐OH, β‐hydroxybutyrate; RLP‐C, remnant‐like particle cholesterol; TRL‐C, triglyceride‐rich lipoprotein cholesterol. P values <0.05 are bold.
Figure S1. Changes in weight during the 16‐week study period (liraglutide group red lines, placebo group blue lines). A, Individual curves and B, mean ± SD for each group. The weights at baseline and week 16 were measured at research institute during on the fat‐rich mixed meal test visit with a calibrated scale. Other measurements were recorded weekly with a home scale and reported to the study dietician or nurse by the subjects.
Figure S2. A correlation matrix between changes in metabolic variables. Subjects in the liraglutide group only are included in the matrix. Colour (A) or number (B) indicates value of spearman correlation coefficient. Absence of coloured circle in a cell indicates p‐value of correlation > than 0.05.