

Abstract
Glucagon is a vital peptide hormone involved in the regulation of blood sugar under fasting conditions. While the processes underlying glucagon production and secretion are well understood, far less is known about its degradation, which could conceivably be manipulated pharmacologically for therapeutic benefit. We describe here the development of novel assays for glucagon degradation, based on a modified glucagon peptide (FBG) labeled with fluorescein and biotin at the N- and C-termini, respectively. Proteolysis at any peptide bond within FBG separates the fluorescent label from the biotin tag, which can be quantified in multiple ways. In one method requiring no specialized equipment, intact FBG is separated from the cleaved fluoresceinated fragments using neutravidin-agarose beads, and hydrolysis is quantified by fluorescence. In an alternative, high-throughput-compatible method, the degree of hydrolysis is quantified using fluorescence polarization after addition of unmodified avidin. Using a known glucagon protease, we confirm that FBG is cleaved at similar sites as unmodified glucagon and utilize both methods to quantify the kinetic parameters of FBG degradation. We show further that the fluorescence polarization-based assay performs exceptionally well (Z’-factor values >0.80) in high-throughput, mix-and-measure format.
Keywords: enzyme assays, enzyme kinetics, fluorescence methods, metabolic diseases, protease, ultra-high throughput screening
INTRODUCTION
Glucagon is a 29-amino acid peptide hormone produced by alpha cells of the islet of Langerhans within the pancreas. Regarded as the principal catabolic hormone within the body, glucagon signals the liver to release glucose into the blood under fasting conditions by promoting glycogenolysis and gluconeogenesis, inhibiting glycogenesis, and other effects. Injected glucagon is also used therapeutically to treat a variety of conditions, including low blood sugar, anaphylaxis, and overdose by ß-adrenergic receptor antagonists. Other therapeutic uses pertaining to the management of diabetes mellitus have been proposed1.
While the mechanisms underlying the production and secretion of glucagon are well understood, considerably less is known about the catabolic fate of glucagon after its release from the pancreas. Glucagon is known to be hydrolyzed by a number of proteases, including dipeptidyl peptidase IV2, neprilysin3, and insulin-degrading enzyme (IDE)4, with a recent study demonstrating that IDE regulates glucagon levels in vivo5. The identification of pharmacological inhibitors of glucagon degradation will help elucidate the physiological and pathophysiological roles of this important hormone and its proteases, and may also hold value as therapeutic agents1.
Although numerous assays for glucagon quantification exist, current assays are expensive, difficult to implement and/or less than ideal for high-throughput compound screening. Several ELISAs for glucagon are available, but these are costly, labor intensive to execute, and are normally provided only in 96-well format. Assays based on homogeneous time-resolved fluorescence are also available (e.g., ref. 6), but not all laboratories have the specialized equipment required for this assay format. Moreover, in our hands, these assays performed poorly for compound screening, with Z’-factor values rarely exceeding 0.3. There is, therefore, a need to develop assays for glucagon degradation more suitable for high-througput screening (HTS).
We report here on the development and characterization of versatile assays for glucagon degradation based on fluoresceinated and biotinylated glucagon (FBG). We describe assays based on two complementary formats, one that is readily implemented with no specialized equipment, and a second, mix-and-measure, HTS-compatible format based on fluorescence polarization (FP). Using IDE as a prototype glucagon protease, we show that FBG is cleaved at the same sites as unmodified glucagon and hydrolyzed with similar kinetics. Both assays are quantitative, highly sensitive, and usable across a wide range of substrate concentrations. The FP-based assay performs exceptionally well in high-throughput format, yielding Z’-factor values consistently >0.80. These assays will facilitate the discovery of chemical modulators of glucagon degradation and proteolytic processing, which may in turn lead to the development of novel therapeutics for controlling glucagon activity.
MATERIALS AND METHODS
Materials.
FBG ([5FAM]HSQGTFTSDYSKYLDSRRAQDFVQWLMNT[Lys(Ahx-biotin)]-amide) was synthesized via solid-phase peptide synthesis by Thermo Fisher Scientific, Inc. (Whatham, MA, USA) and provided at 95% purity (Supplemental Fig. S1). Underivatized human glucagon and neutravidin-agarose beads were purchased from Thermo Fisher Scientific Inc. (Whatham, MA, USA). Recombinant human IDE was generated as described7. Unless otherwise noted, all other reagents and supplies were purchased from Sigma-Aldrich (St. Louis, MO, USA).
Mass spectrometry.
To establish the cleavage sites within FBG and human glucagon, peptides (20 µM) were hydrolyzed by IDE in PBS for varying lengths of time, and the reactions were terminated by addition of 1% formic acid. Excess salts were removed using Millipore® C18 Ziptips (Sigma-Aldrich, St. Louis, MO, USA) according to manufacturer’s recommendations. The intact and digested peptides were eluted in a 1:3 mixture of water:acetonitrile supplemented with 0.1% trifluoroacetic acid, spotted 1:1 with 2,5-dihydroxybenzoic acid or alpha-cyano-4-hydroxycinnamic acid onto a steel sample plate, and subjected to matrix-assisted laser desorption/ionization-time-of-flight (MALDI-TOF) mass spectroscopy using positive reflection mode on an AB SCIEX TOF/TOF™ 5800 System (AB Sciex Pte. Ltd., Framingham, MA, USA). Observed masses were compared to monoisotopic [M+H]+ masses predicted using PEPTIDEMASS8.
Degradation assays.
Except where otherwise noted, reactions were performed in Assay Buffer (PBS supplemented with 0.05% biotin-free BSA) with a final FBG concentration of 1 µM. For AP experiments, reactions were performed in 1.5-mL microfuge tubes and terminated by addition of 1,10-phenanthroline (2 mM). Biotinylated species were removed by addition of excess neutravidin-agarose beads (≥4 eq. biotin binding sites), followed by gentle rocking for 30 min and centrifugation at 14,000 X g for 10 min. The supernatant solution was carefully transferred to 384-well plates (30 µL/well), and fluorescence (λex = 485 nm, λem = 515 nm) was quantified using a multilabel plate reader (SpectraMAX Gemini EM, Molecular Devices Corp., San Jose, CA, USA). For FP-based experiments, medium-throughput reactions were typically performed in 96-well, polypropylene plates and terminated by transfer to 384-well plates containing FP Stop Buffer (2 mM 1,10-phenanthroline; 4 eq. of avidin in Assay Buffer). Fluorescence polarization (λex = 485 nm, λem = 515 nm) was quantified on a multilabel plate reader (SpectraMAX M5e; Molecular Devices Corp., San Jose, CA, USA).
High-throughput screening.
High-throughput FP-based assays were performed by successive addition of protease, FBG and, after a fixed incubation time, FP Stop Buffer in low-volume (30 µL/well) 384-well plates. To demonstrate the feasibility of using the assay for HTS, we screened a collection of 753 samples dissolved in DMSO, including known peptidic and nonpeptidic IDE inhibitors and a library of metal-binding pharmacophores9–11, in duplicate at two different concentrations. The same compounds were also tested in parallel using an amyloid ß-protein (Aß) degradation assay12 and a fluorescence dequenching assay based on Substrate V (Sub V; Mca-RPPGSFAFK(Dnp)-OH), performed as described4. FP was quantified as described above.
Data Analysis.
Curve fitting was conducted using Prism 5 for Mac OS X (v. 5b). Percentage changes in mP values were converted to percent hydrolysis using the formula:
| (Eq. 1) |
where Y = percent hydrolysis and X = percent change in mP. Z’-factor values were calculated according to Zhang and colleagues13 using the following formula:
| (Eq. 2) |
where σHI and σLO refer to the standard deviations and µHI and µLO the means for the high and low data, respectively.
RESULTS
We used a derivatized form of human glucagon, fluoresceinated at the N-terminus and biotinylated at the C-terminus (FBG), and a known glucagon protease, IDE, to develop novel glucagon degradation assays. We explored two formats, each with distinct advantages. In the first format, dubbed avidin-agarose precipitation (AP), the degree of hydrolysis is assessed by removing the intact, biotinylated and fluoresceinated species using neutravidin-agarose beads, then quantifying the amount of cleaved, fluoresceinated fragments remaining in the supernatant by fluorescence. This method has the advantage of requiring no specialized equipment other than a fluorescence plate reader; however, it entails comparatively complex manipulations, including centrifugation and transfer steps (Fig. 1A) and thus is not readily adaptable to robotic automation. As expected, the AP method was a very effective means for detecting hydrolysis: intact FBG was nearly entirely removed by precipitation with neutravidin-agarose, while completely hydrolyzed FBG yielded a fluorescent signal >33-fold higher (Fig. 1B). As controls, we also quantified the fluorescence of intact and fully cleaved FBG in the absence of neutravidin-agarose. Hydrolyzed FBG unexpectedly fluoresced more strongly than the intact substrate even in the absence of neutravidin-agarose, albeit resulting in a significantly reduced relative signal change (~2.3-fold) as compared to the AP method. Using the AP method to monitor fluorescence as a function of time resulted in progress curves fitted well by hyperbolic curves (Fig. 1C).
Figure 1. Overview of FBG-based glucagon degradation assays.
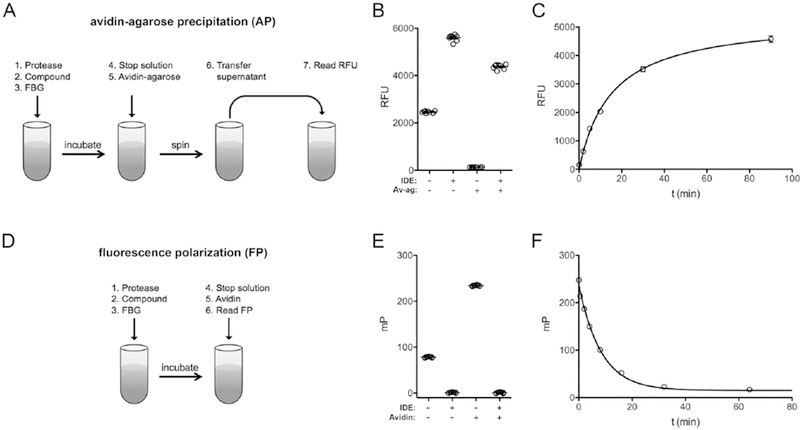
Comparison of the experimental protocols and overall performance of the avidin-agarose precipitation (AP)-based method (A–C) and the fluorescence polarization (FP)-based method (D–F). A, Cartoon showing the basic steps involved in carrying out the AP-based glucagon degradation assay. Note that both centrifugation and transfer steps are required. B, Assessment of the minimal and maximal signal changes observed with uncleaved and fully hydrolyzed FBG (1 µM), respectively, before and after avidin-agarose (Av-ag) precipitation. Note that a >33-fold increase in signal is observed following AP, while a more modest signal change is seen even prior to this step. C, Typical progress curve observed with the AP-based assay using 2 µM FBG. D, Cartoon illustrating the steps involved in carrying out the FP-based method, which is a true mix-and-measure procedure. E, Changes in FP (expressed in millipolarization units; mP) obtained with intact versus fully hydrolyzed FBG (1 µM) in the absence or presence of avidin (4 µM). Note the large shift in depolarization by intact FBP effected by avidin, and the absence of change in fully cleaved FBG. F, Typical progress curve observed with the FP-based assay using 2 µM FBG.
The second method we explored is based on the use of fluorescence polarization (FP) to monitor hydrolysis14. Although specialized equipment is required, this approach has the advantage of being a simple mix-and-measure method requiring no centrifugation or transfer steps, making it much more amenable to automation vis-à-vis the AP method (Fig. 1D). FP has the further advantage of being a ratiometric rather than an absolute measure and thus less sensitive to changes in volume or interference by experimental compounds14. The FP method exploits the fact that fluorescent species in solution tumble at a rate inversely proportional to their size. Cleaved fragments tumble quickly and hence depolarize polarized light strongly (Fig. 1E). Intact FBG, being larger, tumbles more slowly and, by virtue of the C-terminal biotin moiety, this rate of tumbling of intact FBG can be slowed further by addition of avidin, a 64-kDa tetrameric protein (Fig. 1E). A typical progress curve obtained with the FP method is shown in Figure 1F.
Although the foregoing results established the functionality of FBG in both the AP and FP formats, it was critical to establish whether FBG was cleaved at the same sites as underivatized glucagon. To explore this, we used MALDI-TOF to analyze the fragments obtained after various lengths of incubation of FBG or human glucagon with IDE. Consistent with previous findings4, we obtained fragments with masses indicative of cleavage occurring C-terminal to Ser16, Arg17 and Trp25 (Table 1; Supplemental Fig. S2) for both derivatized and underivatized glucagon. These data suggest that the biotin and fluorescein tags do not interfere with the processing of FBG.
Table 1. Cleavage sites of FBG and unmodified glucagon determined by mass spectrometry.
MALDI-TOF mass spectrometry of FBG and unmodified human glucagon degraded partially by IDE was conducted and used to infer the cleavage sites (arrows) within the peptide sequence of both FBG and underivatized human glucagon. Note that the inferred cleavage sites match those reported previously4. The mass spectra used to derive these data are shown in Supplemental Fig. S2. ND = not detected (below the minimum mass threshold for detection by MALDI-TOF).
| ↓↓ ↓ | |||||||
|---|---|---|---|---|---|---|---|
| HSQGTFTSDYSKYLDSRRAQDFVQWLMNT | |||||||
| Unmodified glucagon | FBG | ||||||
| Fragment | Sequence | Exp. | Obs. | Diff. | Exp. | Obs. | Diff. |
| 1–29 | HSQGTFTSDYSKYLDSRRAQDFVQWLMNT | 3481.62 | 3481.23 | 0.39 | 4306.57 | 4306.19 | 0.38 |
| 1–17 | HSQGTFTSDYSKYLDSR | 1991.91 | 1991.76 | 0.15 | 2350.21 | 2350.45 | −0.24 |
| 17–29 | RRAQDFVQWLMNT | 1664.83 | 1664.70 | 0.13 | 2131.48 | 2130.62 | 0.86 |
| 18–25 | RAQDFVQW | 1049.52 | 1049.42 | 0.10 | 1049.52 | 1049.42 | 0.10 |
| 18–29 | RAQDFVQWLMNT | 1508.73 | 1508.61 | 0.12 | 1975.38 | 1974.55 | 0.83 |
| 26–29 | LMNT | 478.23 | ND | — | 944.88 | 944.17 | 0.71 |
Despite the clear advantages of the FP method from the standpoint of automation, there are additional complications that must be taken into account when it is used for quantitative assays. To illustrate this, we compared the signal changes obtained by the AP versus the FP methods in response to fixed percentages of hydrolyzed versus intact FBG (Fig. 2A). As expected, the percent change in RFU obtained using the AP method varies in direct proportion with the percent hydrolyzed FBG. In contrast, the percent change in mP obtained with the FP method departs significantly from linearity, effectively overestimating changes in hydrolysis at all time points (Fig. 2A). For quantitative assays, data expressed in mP must therefore be converted to percent hydrolysis (Fig. 2B), which is readily accomplished via a 3rd-order polynomial equation fitted to the data in Figure 2A (see Eq. 1 and Supplemental Fig. S3).
Figure 2. Characterization of the FP-based glucagon degradation assay.
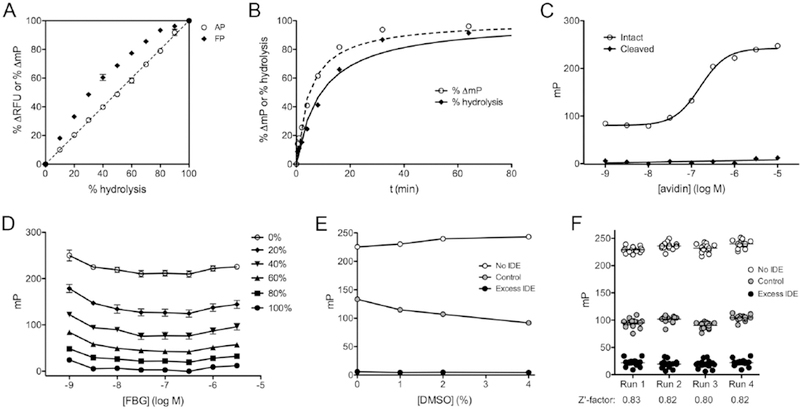
A, Relationship between percent signal change and percent hydrolysis of FBG for the FP- and AP-based methods. Note that, unlike the AP-based assay, the FP-based assay shows a non-linear relationship. These data were used to generate a formula for conversion of raw FP data to percent hydrolysis for quantitative analyses (see Materials and Methods and Supplemental Fig. S3). Data are mean ± SEM for 3 independent experiments. B, Progress curve from the FP-based assay showing raw percent change in mP values (dashed line) and the same data converted to percent hydrolysis (solid line), using the equation derived from the data in A (Eq. 1). C, Effect of avidin concentration on measured mP values for a fixed concentration of FBG (500 nM). Note that fully cleaved fragments are unaffected by avidin. Data are mean ± SEM for 3 independent experiments. D, Relationship between raw mP values and FBG concentration for different degrees of hydrolysis. Note that only slight changes in mP are observed between 10 nM and 300 nM. The relationship between percent signal change and percent hydrolysis for these data are shown in Supplemental Fig. S4. Data are mean ± SEM for 3 independent experiments. E, Effect of DMSO concentration on performance of the FP-based assay. Data are mean ± SEM for 16 replicates. F, Raw data and calculated Z’ factor values for 4 independent experiments conducted in high-throughput (384-well) format on separate days.
As is evident from Figure 1D, the absolute mP values obtained using the FP method depend critically upon the avidin concentration. To explore this, we tested the mP values for intact and fully cleaved FBG in the presence of varying concentration of avidin (Fig. 2C). For intact FBG at a nominal concentration of 500 nM, the EC50 for avidin (monomer) was found to be 160 ± 6.1 nM (n=3), a value in good agreement with expectations, and essentially complete saturation was obtained with ~1 to 3 µM avidin. Avidin had no effect on the FP signal of fully hydrolyzed FBG, as expected. In practice, we used at least 4 equivalents of avidin monomer (i.e., equimolar quantities of tetrameric avidin) per FBG equivalent in our stop solutions.
We also quantified how the FP signal varies as a function of FBG concentration, examining intact and fully cleaved FBG, as well as several fixed percentages of cleaved substrate across a wide range of concentrations (1 nM to 3 µM; Fig. 2D). The raw mP values varied only slightly as a function of concentration, being especially consistent between 10 nM and 300 nM (Fig. 2D). In addition, we examined whether FBG concentration affected the relationship between percent change in mP and percent hydrolysis. With the exception of the very lowest concentrations tested (1 and 3 nM), which showed slightly smaller deviations from linearity relative to all other concentrations, this relationship was essentially unchanged from that shown in Figure 2A (i.e., with 1 µM FBG) at all concentrations at or above 10 nM (Supplemental Fig. S4).
To assess the effect of DMSO on the FP-based assay, we tested the assay in the presence of 0, 1, 2 and 4% DMSO. Increasing concentrations of DMSO resulted in increased rates of FBG hydrolysis by a fixed amount of IDE, but the effect on uncleaved and fully cleaved substrate was modest (Fig. 2E), suggesting the assay is highly tolerant of DMSO.
To assess quantitatively the suitability of the FP-based glucagon degradation assay in high-throughput format, we conducted 4 independent experiments in 384-well format (30 µL/well) on separate days, quantifying the maximum and minimum changes in mP values, obtained from intact and fully hydrolyzed FBG, respectively, as well as testing the percent hydrolysis obtained using a fixed quantity of IDE terminated at a fixed interval of time (Fig. 2F). The percent hydrolysis achieved by control reactions was highly consistent (44 ± 1.4 %) among the independent runs (Fig. 2E). Z’-factor values13 calculated from the resulting data exceeded 0.80 in all cases and averaged 0.82 ± 0.007 (Fig. 2F).
To assess the utility of FBG-based assays for obtaining quantitative data, we determined the kinetic parameters of FBG degradation using both the AP and FP methods. To that end, progress curves were obtained at different substrate concentrations, from which the initial velocity (vo) of each reaction was quantified. As expected, plots of vo as a function of FBG concentration followed a hyperbolic relationship for both the AP (Fig. 3A) and FP (Fig. 3B) methods, yielding apparent KM and kcat values in good agreement (Table 2).
Figure 3. Kinetics of FBG degradation by IDE.
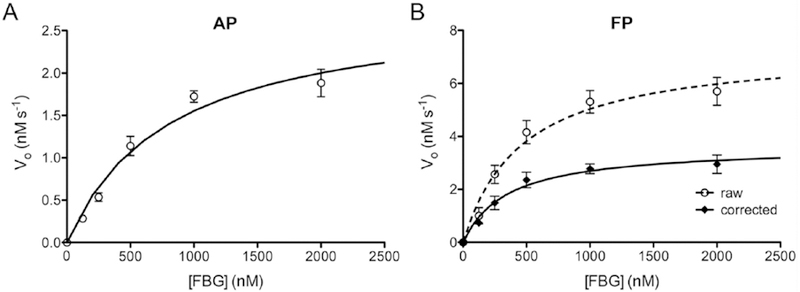
Results obtained using the AP (A) and FP (B) -based assays, showing initial velocity (vo) plotted as a function of FBG concentration. Data from the FP-based assay are plotted both in terms of raw percent change in mP (dashed line) and those data converted to percent hydrolysis using Eq. 1 (solid line). Note that uncorrected, raw data significantly overestimate the vmax of the reaction. Data are mean ± SEM for 4 independent experiments and are fitted to hyperbolae. Kinetic parameters derived from these results are provided in Table 2.
Table 2. Kinetic parameters of FBG degradation by IDE.
Quantitative kinetic parameters calculated from the data shown in Figure 3 using the AP and FP methods. For the FP method, raw percent changes in mP values were first converted to percent hydrolysis using Eq. 1. Note that kcat determinations take into account different IDE concentrations used with the different methods. Data are mean ± SEM of 4 independent replications.
| AP | FP | |
|---|---|---|
| KMapp (nM) | 800 ± 110 | 380 ± 72 |
| vmaxapp (nM s−1) | 2.81 ± 0.30 | 3.70 ± 0.35 |
| kcat (s−1) | 1.76 ± 0.19 | 1.16 ± 0.11 |
| kcat/KM (M−1 s−1) | 2.25 ± 0.12 × 10⁶ | 3.26 ± 0.59 × 10⁶ |
To further validate the FP-based glucagon degradation assay, we used it to characterize two previously described IDE inhibitors in terms of potency and mechanism of action, conducting experiments on separate days to verify whether the assay obtains consistent results. To that end, we conducted dose-response curves on P12–3A, a peptidic, competitive inhibitor of IDE discovered through phage display9, and ML345, a small-molecule, thiol-modifying, irreversible inhibitor of IDE15, 16. In excellent agreement with previous results 9, 15, 16, we obtained Ki values of 2.40 ± 0.30 µM for P12–3A (Fig. 4A) and 70.6 ± 9.0 nM for ML345 (Fig. 4B). To assess whether the FP-based FBG assay could be used to distinguish the different mechanisms of action of the two inhibitors, we conducted kinetics analyses in the absence or presence of P12–3A (5 µM) or ML345 (50 nM). As is evident from Lineweaver-Burk plots (Fig. 4C, D), as well as quantitative analysis of the resulting data (Table 3), we obtained results consistent with competitive and irreversible inhibition, respectively, for P12–3A and ML345.
Figure 4. Validation of FP-based glucagon assay using known IDE inhibitors.
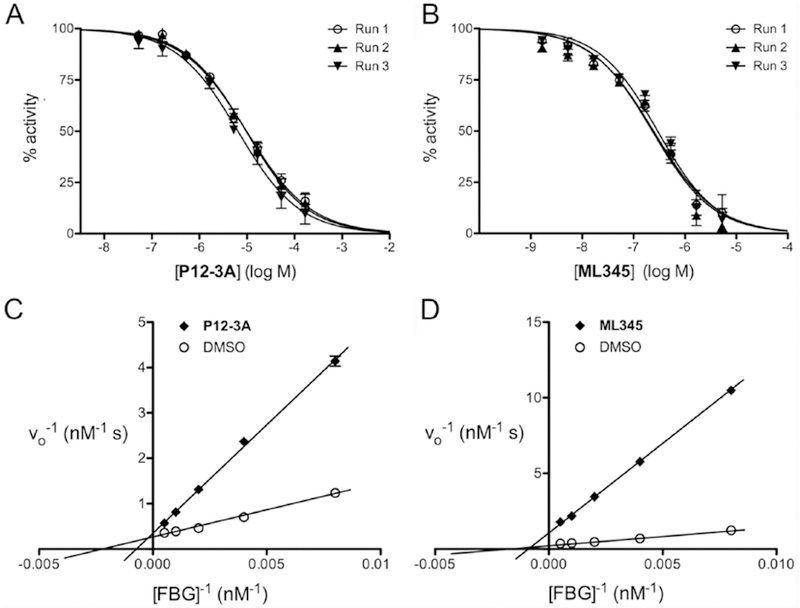
Dose-response curves (A, B) and kinetic analyses (C, D) conducted in the absence or presence of two well-characterized IDE inhibitors: P12–3A (A, C) and ML345 (B, D). For dose-response curves, data are mean ± SEM for each of 3 independent experiments conducted on separate days. For kinetic experiments, data are expressed as double-reciprocal plots; for clarity, we show a single linear regression curve is drawn from the mean ± SEM of 3 independent experiments. Kinetic parameters derived from these results are provided in Table 3.
Table 3. Effects of two different inhibitors of IDE on the kinetics of FBG degradation.
Kinetic parameters calculated from the data shown in Figure 4C, D. Note that P12–3A results in increased KMapp values, consistent with reversible inhibition, while ML345 results in reduced vmaxapp values, consistent with irreversible inhibition, in agreement with the established mechanisms of inhibition of the two inhibitors. Data are mean ± SD of 3 independent runs calculated from hyperbolic curves drawn through the raw S vs. vo data (not from double reciprocal plots).
| DMSO | P12–3A | ML345 | |
|---|---|---|---|
| KMapp (nM) | 331 ± 71 | 1540 ± 86 | 392 ± 73 |
| vmaxapp (nM s−1) | 3.37 ± 0.26 | 3.10 ± 0.15 | 0.827 ± 0.032 |
To establish the suitability of the FP-based glucagon degradation assay for HTS, we used it to screen a collection of 753 compounds, in duplicate, at two different concentrations (500 µM and 50 µM), for a total of 3012 separate reads plus controls. In parallel, we screened the same compounds using a well-characterized FP-based Aß degradation assay12 and a fluorogenic peptide substrate (Substrate V; Sub V). As expected, strong correlations were observed between replicate readings at both 500 µM (Fig. 5A) and 50 µM (Fig. 5D). Correlations with other assays confirmed the validity of the FBG-based assay and the advantage of the FP format over fluorescence-based screens. Comparison with the Aß degradation assay, another FP-based assay, revealed strong, but not perfect, correlations at both 500 µM (Fig. 5B) and 50 µM (Fig. 5E). In marked contrast, almost no correlation was observed at either compound concentration between the FBG-based assay and the fluorogenic assay utilizing Sub V (Fig. 5C, F), with the latter assay exhibiting evidence of strong activation by some compounds. These results are consistent with previous findings showing that screens conducted with fluorogenic peptide substrates often uncover compounds that exhibit markedly dissimilar activity when tested against endogenous substrates17, 18.
Figure 5. Performance of the FP-based glucagon degradation assay in HTS.
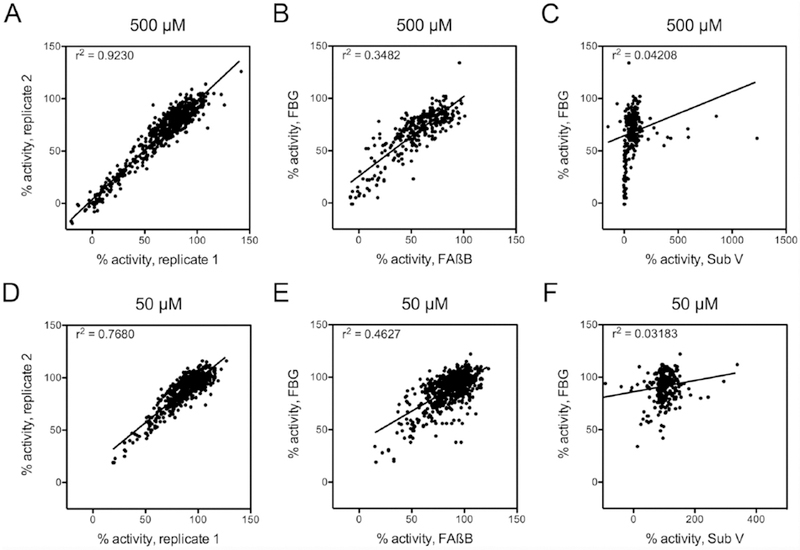
Results from screening of 753 compounds with the FP-based FBG assay at 500 µM (A–C) and 50 µM (D–F). A, Correlation between replicates conducted at 500 µM. B, Correlation between results obtained with FBG and an Aß-degradation assay (FAßB) at 500 µM. C, Correlation between results obtained with FBG and Substrate V (Sub V) at 500 µM. D, Correlation between replicates conducted at 50 µM. E, Correlation between results obtained with FBG and FAßB at 50 µM. C, Correlation between results obtained with FBG and Sub V at at 50 µM.
DISCUSSION
Using a dual-labeled form of glucagon, containing N-terminal fluorescein and C-terminal biotin moieties (FBG), we have succeeded in developing novel glucagon degradation assays that are versatile, quantitative, sensitive, and easily and inexpensively implemented. Notably, we demonstrate that the FP-based format of this assay is highly suitable for automated high-throughput screening.
Several lines of evidence suggest that FBG is processed similarly to unmodified glucagon, at least for IDE, which has been demonstrated to degrade glucagon in vivo5. Consistent with previous results4, MALDI-TOF analysis reveals that FBG is cleaved by IDE at the same sites as human glucagon, specifically C-terminal to Ser16, Arg17 and Trp25. Furthermore, the kinetic parameters of FBG degradation obtained with both assay formats are in close agreement with one another and, with certain qualifications, reasonably similar to those reported in a previous study19. The latter study, conducted in 1985 by Shroyer and colleagues, reported that glucagon was degraded with an apparent KM of 3.46 µM and kcat of 38.5 min−1 (0.641 s−1) by a semi-purified protease that has been inferred—but not definitively proven—to be IDE. More specifically, the protease in this study, purified by affinity chromatography from rat liver, exhibited some characteristics consistent with IDE and others that are inconsistent. As is true for IDE, the purified protease was susceptible to inhibition by bacitracin20 and thiol-alkylating agents such as N-ethylmaleimide21, and was partially, but not completely, inhibited by zinc-chelating agents such as EDTA22. On the other hand, the protease purified by Shroyer et al. was reported to exhibit a native size of ~180 kDa, rather than the correct value of ~220 kDa for the native, homodimeric form of IDE and, more troublingly, was composed of two non-identical subunits with different isoelectric points19, findings that are inconsistent with the purified protease being (exclusively) IDE. These considerations, together with other limitations inherent to the methodology available at the time, raise some doubts about the reliability of the kinetic parameters reported by Shroyer and colleagues, and may account for the modest discrepancy with the results obtained with the AP and FP assays.
The kinetic parameters of FBG degradation by IDE are also consistent with those reported for other IDE substrates. In multiple previous studies performed with the same form of purified recombinant IDE, amyloid-ß protein (Aß) was degraded with KM values of 0.8 – 1.2 µM and kcat values of 0.88 – 4.27 s-1 (refs. 12, 23), values in excellent agreement with those obtained in the present study (see Table 2). The notable exception is insulin, which was degraded with a KM of 65.7 ± 3.4 nM and a kcat value of 0.025 s−1 (refs. 12, 23). The significantly lower KM value for insulin reflects the known high affinity of insulin for IDE24, whereas the remarkably slower turnover rate of insulin vis-à-vis other substrates is thought to be attributable to the unusually large and rigid structure of insulin, a 2-chain, disulfide-bonded substrate that makes extensive contacts with the internal chamber of IDE during processing4, thus slowing the rate of release of incompletely hydrolyzed insulin from the protease25.
As is evident from the performance of the FP-based glucagon degradation assay in HTS format, the assay is highly tolerant of compound screening even at concentrations as high as 500 µM. Due to the ratiometric nature of FP-based assays, the assay is generally unaffected by compounds that absorb strongly, and it also corrects for changes in volume. Because of the relatively long wavelength used for excitation of FITC (~488 nm), issues with compound fluorescence are largely obviated. However, the assay could conceivably be subject to artifacts in the case of compounds that fluoresce strongly in the same wavelengths as FITC. As a convenient counterscreening strategy, such compounds can be readily identified by examination of the raw fluroescence data in wither the S or the P plane, then tested in orthogonal assays.
The assays described in the present study will facilitate the discovery of chemical modulators of glucagon degradation, which are expected to have multiple experimental and possibly therapeutic applications1. Given that IDE has been confirmed to mediate glucagon degradation in vivo5, it would seem to be an attractive target for such an effort. This idea might appear complicated, however, by the fact that IDE also avidly degrades glucagon’s anabolic counterpart, insulin22. While true, more than a decade of compound screening campaigns with IDE have shown that chemical modulators of IDE can be exquisitely substrate selective, with inhibitors showing widely varying Ki values for different substrates21, 26, in some cases differing by orders of magnitude27. Indeed, certain compounds that inhibit the degradation of some IDE substrates can actually activate the degradation of other substrates17, 28–30. These unusual substrate-selective effects arise as a consequence of the unique structure of IDE, which resembles a clamshell that completely encapsulates its substrates during a catalytic cycle4. Substrates interact with the inner chamber of the protease at multiple sites besides the region near the active site, thereby permitting additional sites for chemical modulation. The assays developed in the present study will be instrumental, therefore, in the effort to identify compounds that selectively inhibit IDE-mediated glucagon degradation. In addition, the versatile nature of the assay format suggests it could be used for the discovery of chemical modulators of other glucagon proteases and/or the discovery of novel proteases mediating the degradation and/or processing of glucagon.
Supplementary Material
ACKNOWLEDGEMENTS
We thank Dr. Benjamin Katz for assistance with mass spectrometry, Dr. Daniele Piomelli for granting access to the Molecular Devices SpectraMAX M5e, and Dr. Seth Cohen for providing the library of metal-binding pharmacophores. This work was supported by a grant from the National Institutes of Health (R01-GM115617) to MAL.
REFERENCES
- 1.Muller TD; Finan B; Clemmensen C; et al. The new biology and pharmacology of glucagon. Physiol Rev 2017, 97 (2), 721–766. [DOI] [PubMed] [Google Scholar]
- 2.Hinke SA; Pospisilik JA; Demuth HU; et al. Dipeptidyl peptidase IV (DPIV/CD26) degradation of glucagon. Characterization of glucagon degradation products and DPIV-resistant analogs. J Biol Chem 2000, 275 (6), 3827–34. [DOI] [PubMed] [Google Scholar]
- 3.Trebbien R; Klarskov L; Olesen M; et al. Neutral endopeptidase 24.11 is important for the degradation of both endogenous and exogenous glucagon in anesthetized pigs. Am J Physiol Endocrinol Metab 2004, 287 (3), E431–8. [DOI] [PubMed] [Google Scholar]
- 4.Shen Y; Joachimiak A; Rosner MR; et al. Structures of human insulin-degrading enzyme reveal a new substrate recognition mechanism. Nature 2006, 443 (7113), 870–4. [DOI] [PMC free article] [PubMed] [Google Scholar]
- 5.Maianti JP; McFedries A; Foda ZH; et al. Anti-diabetic activity of insulin-degrading enzyme inhibitors mediated by multiple hormones. Nature 2014, 511 (7507), 94–8. [DOI] [PMC free article] [PubMed] [Google Scholar]
- 6.Evans MR; Wei S; Posner BA; et al. An AlphaScreen Assay for the Discovery of Synthetic Chemical Inhibitors of Glucagon Production. J Biomol Screen 2016, 21 (4), 325–32. [DOI] [PMC free article] [PubMed] [Google Scholar]
- 7.DelleDonne A; Kouri N; Reinstatler L; et al. Development of monoclonal antibodies and quantitative ELISAs targeting insulin-degrading enzyme. Mol Neurodegener 2009, 4, 39. [DOI] [PMC free article] [PubMed] [Google Scholar]
- 8.Wilkins MR; Lindskog I; Gasteiger E; et al. Detailed peptide characterization using PEPTIDEMASS--a World-Wide-Web-accessible tool. Electrophoresis 1997, 18 (3–4), 403–8. [DOI] [PubMed] [Google Scholar]
- 9.Suire CN; Nainar S; Fazio M; et al. Peptidic inhibitors of insulin-degrading enzyme with potential for dermatological applications discovered via phage display. PLoS One 2018, 13 (2), e0193101. [DOI] [PMC free article] [PubMed] [Google Scholar]
- 10.Agrawal A; Johnson SL; Jacobsen JA; et al. Chelator fragment libraries for targeting metalloproteinases. ChemMedChem 2010, 5 (2), 195–9. [DOI] [PMC free article] [PubMed] [Google Scholar]
- 11.Puerta DT; Lewis JA; Cohen SM New beginnings for matrix metalloproteinase inhibitors: identification of high-affinity zinc-binding groups. J Am Chem Soc 2004, 126 (27), 8388–9. [DOI] [PubMed] [Google Scholar]
- 12.Leissring MA; Lu A; Condron MM; et al. Kinetics of amyloid beta-protein degradation determined by novel fluorescence- and fluorescence polarization-based assays. J Biol Chem 2003, 278 (39), 37314–20. [DOI] [PubMed] [Google Scholar]
- 13.Zhang JH; Chung TD; Oldenburg KR A simple statistical parameter for use in evaluation and validation of high throughput screening assays. J Biomol Screen 1999, 4 (2), 67–73. [DOI] [PubMed] [Google Scholar]
- 14.Hall MD; Yasgar A; Peryea T; et al. Fluorescence polarization assays in high-throughput screening and drug discovery: a review. Methods Appl Fluoresc 2016, 4 (2), 022001. [DOI] [PMC free article] [PubMed] [Google Scholar]
- 15.Abdul-Hay SO; Bannister TD; Wang H; et al. Selective targeting of extracellular insulin-degrading enzyme by quasi-irreversible thiol-modifying inhibitors. ACS Chem Biol 2015. [DOI] [PMC free article] [PubMed]
- 16.Bannister TD; Wang H; Abdul-Hay SO; et al. ML345: A small-molecule inhibitor of the insulin-degrading enzyme (IDE). In Probe Reports from the NIH Molecular Libraries Program; Bethesda (MD), 2014. [Google Scholar]
- 17.Cabrol C; Huzarska MA; Dinolfo C; et al. Small-molecule activators of insulin-degrading enzyme discovered through high-throughput compound screening. PLoS ONE 2009, 4 (4), e5274. [DOI] [PMC free article] [PubMed] [Google Scholar]
- 18.Leissring MA; Malito E; Hedouin S; et al. Designed inhibitors of insulin-degrading enzyme regulate the catabolism and activity of insulin. PLoS One 2010, 5 (5), e10504. [DOI] [PMC free article] [PubMed] [Google Scholar]
- 19.Shroyer LA; Varandani PT Purification and characterization of a rat liver cytosol neutral thiol peptidase that degrades glucagon, insulin, and isolated insulin A and B chains. Arch Biochem Biophys 1985, 236 (1), 205–19. [DOI] [PubMed] [Google Scholar]
- 20.Roth RA Bacitracin: an inhibitor of the insulin degrading activity of glutathione-insulin transhydrogenase. Biochem Biophys Res Commun 1981, 98 (2), 431–8. [DOI] [PubMed] [Google Scholar]
- 21.Neant-Fery M; Garcia-Ordonez RD; Logan TP; et al. Molecular basis for the thiol sensitivity of insulin-degrading enzyme. Proc Natl Acad Sci U S A 2008, 105 (28), 9582–7. [DOI] [PMC free article] [PubMed] [Google Scholar]
- 22.Leal MC; Morelli L Insulysin. In Handbook of Proteolytic Enzymes; 3rd ed.; Rawlings ND; Salvesen G, Eds.; Academic Press: 2013; Chapter 318, pp. 1415–1420. [Google Scholar]
- 23.Farris W; Leissring MA; Hemming ML; et al. Alternative splicing of human insulin-degrading enzyme yields a novel isoform with a decreased ability to degrade insulin and amyloid beta-protein. Biochemistry 2005, 44 (17), 6513–25. [DOI] [PubMed] [Google Scholar]
- 24.Hersh LB The insulysin (insulin degrading enzyme) enigma. Cell Mol Life Sci 2006, 63 (21), 2432–4. [DOI] [PMC free article] [PubMed] [Google Scholar]
- 25.Leissring MA; Selkoe DJ Enzyme target to latch on to. Nature 2006, 443 (7113), 761–2. [DOI] [PubMed] [Google Scholar]
- 26.Song ES; Hersh LB Insulysin: an allosteric enzyme as a target for Alzheimer’s disease. J Mol Neurosci 2005, 25 (3), 201–6. [DOI] [PubMed] [Google Scholar]
- 27.Abdul-Hay SO; Lane AL; Caulfield TR; et al. Optimization of peptide hydroxamate inhibitors of insulin-degrading enzyme reveals marked substrate-selectivity. J Med Chem 2013, 56 (6), 2246–55. [DOI] [PMC free article] [PubMed] [Google Scholar]
- 28.Song ES; Juliano MA; Juliano L; et al. Substrate activation of insulin-degrading enzyme (insulysin). A potential target for drug development. J Biol Chem 2003, 278 (50), 49789–94. [DOI] [PubMed] [Google Scholar]
- 29.Song ES; Juliano MA; Juliano L; et al. ATP effects on insulin-degrading enzyme are mediated primarily through its triphosphate moiety. J Biol Chem 2004, 279 (52), 54216–20. [DOI] [PubMed] [Google Scholar]
- 30.Im H; Manolopoulou M; Malito E; et al. Structure of substrate-free human insulin-degrading enzyme (IDE) and biophysical analysis of ATP-induced conformational switch of IDE. J Biol Chem 2007, 282 (35), 25453–63. [DOI] [PubMed] [Google Scholar]
Associated Data
This section collects any data citations, data availability statements, or supplementary materials included in this article.