

Summary:
The hepatic TCA cycle supports oxidative and biosynthetic metabolism. This dual responsibility requires anaplerotic pathways, such as pyruvate carboxylase (PC), to generate TCA cycle intermediates necessary for biosynthesis without disrupting oxidative metabolism. Liver-specific PC knockout (LPCKO) mice were created to test the role of anaplerotic flux in liver metabolism. LPCKO mice have impaired hepatic anaplerosis, diminution of TCA cycle intermediates, suppressed gluconeogenesis, reduced TCA cycle flux, and a compensatory increase in ketogenesis and renal gluconeogenesis. Loss of PC depleted aspartate and compromised urea cycle function, causing elevated urea cycle intermediates and hyperammonemia. Loss of PC prevented diet-induced hyperglycemia and insulin resistance, but depleted NADPH and glutathione, which exacerbated oxidative stress and correlated with elevated liver inflammation. Thus, despite catalyzing the synthesis of intermediates also produced by other anaplerotic pathways, PC is specifically necessary for maintaining oxidation, biosynthesis, and functions more distal to the TCA cycle, such as antioxidant defenses.
Keywords: Pyruvate carboxylase, Metabolic Flux, Anaplerosis, TCA Cycle, Urea Cycle, Gluconeogenesis, Liver physiology, High-Fat Diet
Graphical Abstract

eTOC Blurb:
Capel et al. report that in the liver, pyruvate carboxylase (PC) regulates gluconeogenesis. More generally, PC replenishes TCA cycle intermediates, and its loss is insufficiently compensated by alternative pathways. Hence, PC flux is essential for TCA cycle-dependent biosynthesis, and less obvious roles in substrate oxidation, urea cycle, redox and antioxidant capacity.
Introduction:
The hepatic TCA cycle provides intermediates and the energy necessary for multiple biosynthetic pathways (Fig. 1A). For example, phosphoenolpyruvate (PEP) carboxykinase (PEPCK) catalyzes the conversion of the TCA cycle intermediate oxaloacetate (OAA) to PEP, which subsequently supports the majority of gluconeogenesis during fasting (Landau et al., 1996). The cataplerotic loss of OAA would rapidly deplete TCA cycle intermediates without a balanced influx of precursors via anaplerotic pathways. Pyruvate carboxylase (PC) catalyzes the carboxylation of pyruvate to OAA and represents a major anaplerotic pathway by which alanine and lactate replenish TCA cycle intermediates, not only for gluconeogenesis, but also for other pathways including the urea cycle and lipid synthesis, (Fig. 1A). Mutations in the PC gene (Pcx) cause hypoglycemia, urea cycle defects, and neurological deficits in humans (Marin-Valencia et al., 2010). In contrast, over-activation of this pathway causes hyperglycemia during insulin resistance and diabetes (Consoli et al., 1990; Landau et al., 1996; Reaven, 1988). Characterizing the role of PC in anaplerosis and downstream pathways is important for understanding the metabolic mechanisms of diseases like obesity, insulin resistance, and inborn errors of related pathways.
Figure 1: Authentication and phenotyping of LPCKO mice.
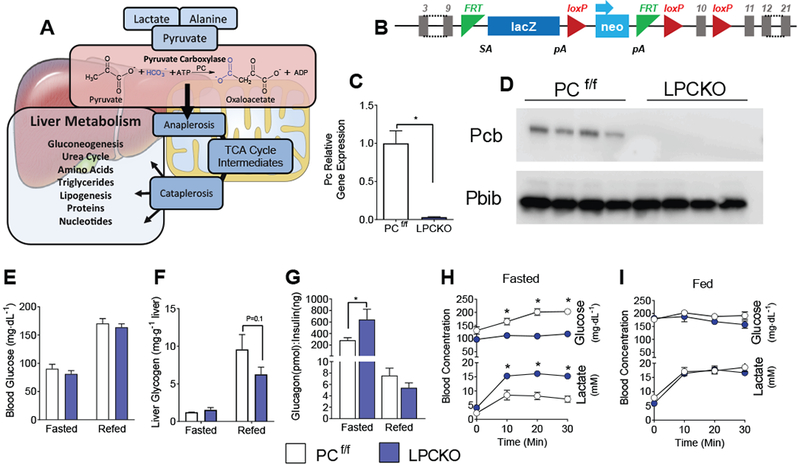
A) Pathway illustrating the role of pyruvate carboxylase in anaplerotic flux. B) Schematic of construct used in LCPKO mice showing locations of loxP sites within the Pyruvate Carboxylase gene. C) Gene expression for pyruvate carboxylase normalized to Ppib (cyclophilin B) from livers of PCf/f and LPCKO mice; n=4. D) Western blot for PC (alpha-Pcb) and cyclophilin B (Ppib) from liver protein extract; n=4. E) Blood glucose levels in the fasted and refed state; n=4. F) Liver glycogen concentration in fasted and fed mice; n=4. G) Glucagon to insulin ratio in the fasted and refed state; n=4. Blood glucose and lactate in the H) fasted and I) refed state following a 1.5 mg/g body weight lactate-pyruvate tolerance test. Data expressed as mean ± SEM. * indicates p<.05 by Student’s t-test or 2-way ANOVA. See also Figure S1.
As seminal steps in gluconeogenesis, both PEPCK (Rognstad, 1979) and PC (Groen et al., 1986) were proposed to regulate the rate of gluconeogenesis in liver. Inasmuch as PEPCK has an exceptional transcriptional response to insulin and glucagon signaling, it is frequently cited as the chief regulatory step in hepatic gluconeogenesis (Granner et al., 1983; Hanson and Reshef, 1997). However, knockdown studies of PEPCK demonstrated that transcriptional regulation of PEPCK is not an effective mechanism for control of hepatic gluconeogenesis (Burgess et al., 2007). In contrast to PEPCK, PC is weakly regulated by transcriptional mechanisms, although PC protein content increases with insulinopenia (Salto et al., 1996) and correlates with glycemia in humans (Kumashiro et al., 2013). Most importantly, metabolic control analysis indicates that PC exerts ~80% control over gluconeogenesis (Groen et al., 1986). Thus, PC controls anaplerotic/cataplerotic flux in response to metabolic conditions despite weak transcriptional regulation.
The tight control of flux by PC is mediated by its unique structure and function. PC is a tetrameric mitochondrial enzyme consisting of a dimer of dimers with two active sites (Bottger et al., 1969; Jitrapakdee et al., 2008). One active site catalyzes the MgATP/HCO3 dependent carboxylation of biotin and the other active site is a transferase that completes the carboxylation of pyruvate (St Maurice et al., 2007). The proximity of these two enzymatic sites, and thus PC activity, is positively modulated by allostery, principally the binding of acetyl-CoA to amino acid residues that change the conformation of the enzyme (Jitrapakdee et al., 2008). Physiological concentrations of acetyl-CoA are necessary for PC activity, while metabolites of the TCA cycle such as α-ketoglutarate or products of energy scarcity such as ADP reduce the allosteric binding of acetyl-CoA and thereby inhibit PC activity (Keech and Utter, 1963; McClure and Lardy, 1971; von Glutz and Walter, 1976). The allostery of PC is one reason why gluconeogenesis is acutely responsive to hepatic energetics, especially fat oxidation which generates acetyl-CoA, increases ATP and reduces ADP (Williamson et al., 1966). The sensitivity of PC to fat oxidation may be a link between elevated adipose lipolysis and increased gluconeogenesis during T2DM (Rebrin et al., 1996).
This study investigates the role of PC in hepatic gluconeogenesis, amino acid metabolism, energy metabolism and redox state. These pathways were examined in a liver-specific knockout of Pcx (LPCKO) using metabolomics, metabolic tracers and mathematical modeling. We report that hepatic PC is required for normal gluconeogenesis, TCA cycle and urea cycle functions, but its loss did not elicit obvious neurological defects observed in humans with inborn PC deficiency. Although loss of hepatic PC prevented insulin resistance and glucose intolerance during a high fat diet (HFD), it also impaired oxidative defense and predisposed liver to inflammation. Thus, elevated anaplerosis contributes to hyperglycemia during obesity and insulin resistance, but it is also indispensable for urea cycle function and antioxidant defenses.
Results
Authentication of liver-specific pyruvate carboxylase knockout mice
A liver-specific PC knockout mouse was generated by targeting the Pcx gene in C57BL/6N embryonic stem cells (Skarnes et al., 2011). The vector L1L2_Pgk_P was inserted upstream of the targeted exon and an additional loxP site was inserted downstream of the Pcx exon 10 (Fig. 1B). This mouse was crossed with a mouse expressing Flp recombinase to create mice with the Pcx floxed allele. Pcx floxed (PCf/f) mice were bred with albumin-Cre (She et al., 2000) expressing mice to create liver-specific PC knockout (LPCKO) mice. LPCKO mice are viable and fertile, and no gross effects on health or mortality were observed. Gene expression of PC is reduced by 98% in the livers of the LPCKO mice as measured by qPCR (Fig. 1C). PC protein was undetectable by western blotting in protein extracts from livers of LPCKO mice (Fig. 1D). These data demonstrate that PC mRNA and protein were successfully removed from liver of LPCKO mice.
LPCKO does not affect basal glucose levels but lowers fasting insulin
PC catalyzes the carboxylation of pyruvate to oxaloacetate in the TCA cycle and can be used to support many different pathways, most notably gluconeogenesis in liver (Fig. 1A). Surprisingly, LPCKO mice had normal plasma glucose in the fed and fasted state (Fig. 1E) but stored less hepatic glycogen (Fig. 1F). Fasting insulin was lower (Fig. S1A), with no change in fasting glucagon (Fig. S1B), leading to an elevated glucagon/insulin ratio (Fig. 1G). After an overnight fast, a lactate/pyruvate tolerance test (1.5/0.15 mg/g BW) produced a significant excursion of glucose in PCf/f, but not LPCKO mice by 10 minutes after injection (Fig. 1H). Similarly, PCf/f mice rapidly cleared lactate compared to LPCKO mice, as indicated by lower blood lactate concentrations throughout the test (Fig. 1H). In contrast, when the test was performed in the fed state, where gluconeogenesis is suppressed and glycogenolysis predominates, there were no differences between the PCf/f and LPCKO mice (Fig. 1I). Metabolic cage data indicated mild effects on whole body metabolism, including a small increase in food intake and energy expenditure in LPCKO mice (Fig. S1C–H). Thus, mice tolerate loss of hepatic PC without effects on glycemia and only mild effects on whole-body energy metabolism.
Loss of PC impairs hepatic gluconeogenesis
Since LPCKO mice maintain normoglycemia following an overnight fast, we determined how loss of PC specifically affects hepatic gluconeogenesis. Fasting endogenous glucose production was examined by steady state infusion of [U-13C]glucose in conscious and unrestrained overnight fasted mice. Plasma glucose M+6 was slightly increased in the LPCKO mice (Fig. 2A), while lactate mass isotopomers were normal in LPCKO mice (Fig. 2B). These data were regressed to a modified elementary metabolite unit analysis of whole body glucose production and gluconeogenesis from lactate (Antoniewicz et al., 2007) using the INCA modeling software (Young, 2014). Both EGP (Fig. 2C) and whole body gluconeogenesis from PC (Fig. 2D) were statistically lower but remarkably normal in the LPCKO mice. To ensure liver autonomy, we performed isolated liver perfusions in overnight fasted LPCKO mice and their PCf/f littermates. Perfusate contained lactate, pyruvate, glycerol and free fatty acids (FFA)/albumin as metabolic substrates, and tracer levels of 2H/13C (2H2O and [U-13C]propionate) to examine metabolic flux through gluconeogenesis and TCA cycle related pathways. In contrast to endogenous glucose production, hepatic glucose output was decreased by 75% in LPCKO livers (Fig. 2E). 2H NMR analysis of glucose (Fig. 2F) confirmed that very little glucose originated from glycogen (i.e. H2 and H5 enrichments were similar), as expected from fasted livers. Moreover, lower 2H labeling on glucose H6s indicated that the fraction of glucose produced from TCA cycle intermediates was substantially reduced in LPCKO livers (Fig. 2F and S2A). When normalized to total glucose production, absolute gluconeogenesis from TCA cycle anaplerosis in LPCKO liver was less than 15% of control liver (Fig. 2G). The difference in deuterium labeling on glucose H5 and H6s indicated that the fraction of glucose produced from non-TCA cycle intermediates (i.e. glycerol) tended to be greater in LPCKO liver (Fig. S2A), but its absolute flux was surprisingly suppressed in LPCKO liver (Fig. S2B). Since PC-independent anaplerotic sources are available to liver in vivo, we attempted to overcome loss of PC by supplementing perfusate with either 1 mM propionate or 1 mM glutamine, but neither was effective at rescuing glucose production (Fig. 2H). The inability of LPCKO liver to compensate by utilization of PC-independent substrates was consistent with a general decrease in the expression of gluconeogenic genes Pepck and G6pase in LPCKO liver (Fig. S2C). These data demonstrate that PC is required for a large majority of hepatic gluconeogenesis from the TCA cycle and that the elimination of flux through PC reduces hepatic gene expression related to gluconeogenesis.
Figure 2: Liver specific PC loss prevents hepatic gluconeogenesis and activates renal gluconeogenesis.

Mass enrichments in A) plasma glucose and B) plasma lactate following a [U-13C]glucose infusion in conscious unrestrained mice after an overnight fast. Rates of C) in vivo glucose production and D) gluconeogenesis determined from glucose and lactate enrichments. E) Hepatic glucose production by isolated perfused livers from overnight fasted mice; n=5-6. F) Representative 2H NMR spectra from mono-acetone glucose derived from glucose produced by PC f/f and LPCKO livers. G) Hepatic gluconeogenesis from the TCA cycle by the isolated perfused liver determined from 2H glucose enrichments. H) Effect of supplementing liver perfusions with 1mM glutamine or propionate. I) Expression of genes whose products control gluconeogenesis and glucose uptake normalized to cyclophilin B in kidney of 18-hour fasted mice. J) Mass enrichments in kidney oxaloacetate after [U-13C]glucose infusion; n=4. K) M+3 enrichment in kidney TCA cycle intermediates after a [U-13C]lactate/pyruvate injection; n=3-4. Data expressed as mean ± SEM. * indicates p<.05 by Student’s t-test or 2-way ANOVA. See also Figure S2.
The relatively normal endogenous gluconeogenesis but near abolishment of hepatic gluconeogenesis indicates compensation by an extrahepatic tissue. Although normally negligible, the proximal tubules of the kidney can contribute significantly to endogenous glucose production during hypoglycemia and acidosis (Joseph et al., 2000). Expression of Pgc1α, Pcx, G6pase, and Glut2 (which is required for glucose transport across the basolateral membrane of the renal proximal tubule), were elevated in the kidney of LPCKO mice (Fig. 2I). LPCKO kidney had elevated M2 and M3 enriched1 oxaloacetate following [U-13C]glucose infusion (Fig. 2J), consistent with increased utilization of circulating M2 and M3 lactate/pyruvate in the anaplerotic pathway of the kidney. Similar results were obtained following a [U-13C]lactate/pyruvate injection (Fig. S2D). In particular, kidney of fasted (Fig. 2K) but not fed (Fig. S2D) LPCKO mice had elevated M3 enrichment in most TCA cycle intermediates, suggesting increased utilization of the anaplerotic pathway for gluconeogenesis. Thus LPCKO mice maintain normal glycemia, in part, by substantially increasing renal gluconeogenesis.
Loss of PC disrupts hepatic amino acid catabolism
Humans with inborn errors of PC have altered plasma amino acid profiles (Marin-Valencia et al., 2010) . Thus, we examined amino acid metabolism in livers of LPCKO mice. We first performed an untargeted 1H NMR metabolomic analysis of liver extracts from fasted and refed mice (Fig. S3A). Metabolomic profiles of LPCKO liver were clearly distinct from control liver when analyzed by principal component analysis (Fig. S3B), including differences in a variety of amino acids (Fig. S3C). Thus, we also performed a targeted quantitative GC-MS analysis of amino acids in livers from fasted mice. Alanine, the amino acid analog of pyruvate, was elevated in LPCKO liver, while glutamate, a potential PC-independent anaplerotic substrate, was lower (Fig. 3A). Aspartate, an obligate ammonia donor to the urea cycle, was decreased by ~50%, and there were large increases in levels of urea cycle intermediates citrulline and arginine (Fig. 3B). Ornithine tended to be elevated in the MS analysis and was significantly elevated in the 1H NMR analysis (Fig. S3C). Lysine, a marker of urea cycle dysfunction, was dramatically elevated in LPCKO liver (Fig. 3B). Plasma lysine, citrulline, and arginine were also dramatically elevated (Fig. S3D), as is typical in humans with PC deficiency or other urea cycle defects. However, unlike humans with PC deficiency or other urea cycle defects, we did not detect neurological effects by observation or by neuromotor evaluation (Fig. S3E). In conjunction with elevated urea cycle intermediates, LPCKO liver had an increase in the expression of argininosuccinate lyase (Asl), the enzyme responsible for production of fumarate and arginine from argininosuccinate, and carbamoyl phosphate synthetase (Cps), the enzyme that synthesizes carbamoyl phosphate from ammonia and bicarbonate (Fig. 3C). The urinary urea/creatinine ratio was not changed (Fig. 3D), but plasma ammonia was elevated in the LPCKO mice (Fig. 3E). The elevated expression of these genes and the robust increase in urea cycle intermediates may provide a mechanism to compensate for reduced aspartate supply. Indeed, when liver was perfused with 1mM aspartate, there was a dramatic induction of urea production in LPCKO liver compared to PCf/f controls (Fig. 3F), which did not occur when livers were perfused with glutamine (Fig. 3G). These data demonstrate that loss of hepatic PC causes a deficiency in aspartate, resulting in a rise in urea cycle metabolites and hyperammonemia (Fig. 3H) despite a compensatory rise in urea cycle gene expression.
Figure 3: Loss of PC disrupts hepatic amino acid catabolism.

A) Concentrations of alanine, glutamine, glutamate as determined by mass spectrometry in snap frozen livers from overnight fasted mice; n=5-7. B) Concentrations of urea cycle intermediates and related amino acids; n=5-7. C) Expression of genes whose products contribute to urea cycle function normalized to cyclophilin b; n=4. D) Ratio of urea to creatinine in urine collected from ad lib fed mice; n=5-6. E) Concentration of ammonia in the plasma of overnight fasted mice; n=4. F) Rate of urea production in liver perfusion from 18-hour fasted mice using substrate with lactate/pyruvate or 1mM aspartate supplementation; n=4. G) Rate of urea production in liver perfusion from overnight fasted mice using substrate with lactate/pyruvate or 1mM glutamate supplementation. n=4 H) Schematic illustrating the effects of LPCKO on hepatic urea cycle. Data expressed as mean ± SEM. * indicates p<.05 by Student’s t-test. See also Figure S3.
Pyruvate carboxylase is required for hepatic TCA cycle function
Since PC is the principal anaplerotic pathway for the TCA cycle in liver, we examined whether loss of PC altered TCA cycle function. Untargeted NMR metabolomic analysis of livers from fasted and refed mice indicated lower concentrations of TCA cycle intermediates and higher lactate concentrations (Fig. S3C). Quantitative analysis by GC-MS confirmed that hepatic concentrations of pyruvate and lactate were elevated in the liver of fasted LPCKO mice (Fig. 4A), and that TCA cycle intermediates were generally decreased by ~50% in the livers of LPCKO mice (Fig. 4B). Interestingly, α-ketoglutarate, a substrate for the ALT reaction (Ala + aKG ↔ Pyr + Glu), was increased, similar to alanine. This finding is consistent with the expected effect of pyruvate accumulation and the depletion of glutamate, since transaminases operate at near equilibrium (Brosnan et al., 1970). However, the mass action ratio of ALT ([Ala][αKG]/[Pyr][Glu]) was elevated 4-fold (Fig. S4A), while the aspartate amino transferase (AST) mass action ratio ([Asp][αKG]/[OAA][Glu]) tended to be higher (Fig. S4B) in the LPCKO liver. These data indicate that the ALT reaction does not reach the same equilibrium state in the LPCKO liver and suggest that the transamination reactions themselves may be inhibited.
Figure 4: Loss of PC suppresses TCA cycle function but maintains β-oxidation by activation of ketogenesis.

A) Concentrations of lactate and pyruvate in livers of overnight fasted mice as determined by mass spectrometry; n=5-7. B) Concentrations of TCA cycle intermediates in livers of overnight fasted mice as determined by mass spectrometry; n=5-7. Relative concentrations of M+3 labeled C) malate and D) oxaloacetate following a [U-13C]lactate/pyruvate injection; n=4. E) Determination of M+2 acetyl-CoA oxidation in the TCA cycle as an estimate of PDH activity; n=4. F) Representative 13C NMR spectra of the C2 position of mono-acetone glucose derived from glucose produced by perfused PCf/f and LPCKO livers from overnight fasted mice. G) Rate of production of glucose isotopomers with 13C labeling in carbons 1, 2 and 3, where filled circles represent 13C; n=5-6. Calculated rates of H) anaplerosis and I) TCA cycle turnover based on glucose isotopomer formation in isolated perfused liver; n=5-6. J) Oxygen consumption of perfused livers; n=5-6. K) Gene expression for genes whose products control fatty acid oxidation normalized to cyclophilin B; n=4-6. L) Plasma triglyceride levels in 18 hour fasted and 4 hours following re-feeding after an 18 hour fast conditions; n=7-10 fasted 4-5 refed. M) Liver triglyceride content in overnight fasted mice; n=6. N) Plasma total ketones in overnight fasted and 4 hours following re-feeding after 18 hour fast conditions; n=4. O) Ketone production as determined by perfusion of livers from 18-hour fasted mice; n=5-7. P) β-Oxidation determined by flux balance analysis of data from isolated perfused liver; n=5-7. Q) Schematic illustrating the effect of LPCKO on hepatic TG and ketone body metabolism. Data expressed as mean ± SEM. * indicates p<.05 by Student’s t-test. See also Figure S4.
To test the function of the PC pathway in vivo, we examined the enrichment of hepatic TCA cycle intermediates following a [U-13C]lactate/pyruvate tolerance test. Lactate and pyruvate M3 enrichments were elevated in LPCKO mice (Fig. S4C), indicating impaired disposal through PC. Oxaloacetate, malate and fumarate M3 enrichments were 2-fold lower in liver of fasted LPCKO mice, but were remarkably normal in the fed state (Fig. S4D). However, when 13C incorporation was normalized to total ion count, the relative abundances of M3 OAA and M3 malate were lower by ~90% in the LPCKO in both the fasted and fed state (Fig. 4C,D), consistent with loss of anaplerotic function of the TCA cycle. The residual 13C enrichment in the TCA cycle intermediates in the LPCKO liver may have originated from PDH flux. Indeed, citrate M5 and M6 (Fig. S4D), which can only be formed during PDH flux, were both elevated in the liver of the LPCKO mice. The M5-citrate/M3-OAA ratio was used to estimate M2-acetyl-CoA oxidation relative to TCA cycle flux. As expected, PDH flux in control liver was low and completely suppressed by fasting. However, LPCKO liver had elevated PDH flux which was not suppressed by fasting (Fig. 4E).
To specifically examine TCA cycle function, we analyzed 13C isotopomers in glucose after perfusion of isolated liver with lactate/pyruvate, FFA, and tracer levels (15-fold lower than lactate/pyruvate) of [U-13C]propionate. The dilution and rearrangement of these isotopomers in the TCA cycle reports anaplerotic and oxidative TCA cycle flux (Jin et al., 2004; Jones et al., 2001; Landau et al., 1993). Total glucose 13C enrichment at the C2 position was ~5%, confirming that the tracer did not substantially contribute to glucose flux. There were no significant differences in the relative isotopomer distributions that appeared in glucose as measured by 13C NMR spectroscopy (Fig. 4F), but their rate of appearance of these isotopomers was markedly lower (Fig. 4G). Analysis of the glucose isotopomers using a mathematical model of the TCA cycle (Jin et al., 2004; Jones et al., 2001) indicated that, as expected, absolute anaplerotic flux was dramatically reduced (Fig. 4H). More importantly, loss of PC caused a substantial suppression of oxidative TCA cycle flux in liver (Fig. 4I). These findings were also consistent with lower oxygen uptake by the LPCKO liver (Fig. 4J), indicating that loss of PC reduces oxidative metabolism in liver.
Loss of PC increases ketogenesis but not β-oxidation
Liver supplies the majority of its oxidative metabolism through β-oxidation. In contrast to lower TCA cycle flux, the expression levels of fatty acid oxidation genes were normal or increased in liver from fasted chow-fed LPCKO mice (Fig. 4K). Fasting concentrations of acetyl-CoA, malonyl-CoA (Fig. S4E) and the acyl-carnitine profile (Fig. S4F) were normal in LPCKO liver. Plasma triglycerides were decreased in LPCKO mice (Fig. 4L), but relative mRNA levels for genes related to triglyceride synthesis and assembly were normal, except for Dgat2, which was elevated (Fig. S4G). Increased Dgat2 expression may compensate for impaired glycerophosphate synthesis during PC inhibition. However, there was no difference in liver triglyceride content between the LPCKO mice and their PCf/f littermates in the fasted state (Fig. 4M). To more specifically examine β-oxidation, we measured ketones, which represent the predominant fate of hepatic acetyl-CoA in the fasted state (McGarry and Foster, 1980; Puchalska and Crawford, 2017). Loss of hepatic PC increased the plasma ketone levels in both the fasted and refed states (Fig. 4N), and increased ketogenic flux in fasted liver (Fig. 4O). Nonetheless, regression of all fluxes to a flux balance analysis (FBA) indicated that LPCKO liver maintained normal β-oxidation (Fig. 4P). Thus, the increase in ketogenesis offset the decrease in TCA cycle flux, but did not alter lipid oxidation and did not affect liver triglycerides (Fig. 4Q).
PC knockout reduces mitochondrial energy production but not respiratory capacity
PC is a mitochondrial enzyme, and its loss of function suppresses anaplerosis, the TCA cycle, the urea cycle and may impair cellular respiration in humans with PC deficiency (Habarou et al., 2015). Citrate synthase activity was unchanged, indicating that there was no difference in the amount of mitochondria in LPCKO hepatocytes (Fig. 5A). Oxygen uptake and other substrate fluxes measured in isolated perfused liver were regressed using a flux balance analysis to model hepatic respiration (Fig. 5B). Flux through complex I and complex IV was significantly lower, while respiration of FADH2 (complex II and ETF-Q oxidoreductase) was normal in LPCKO liver. To determine if suppressed respiration in functioning liver impaired the ability of LPCKO mitochondria to maintain hepatocellular energetics, adenine nucleotides were measured in snap frozen liver from fasted mice. AMP and ADP were normal, while ATP and the ATP/AMP ratio tended to be higher in LPCKO liver (Fig. 5C–D), suggesting that mitochondrial respiration was more than sufficient to sustain hepatocellular energy charge. In addition, total NAD+/NADH and cytosolic redox state (indicated by hepatic [pyruvate]/[lactate]) were normal (Fig. S5A), and mitochondrial redox state (indicated by hepatic [αKG][NH4]/[glu]) (Krebs and Veech, 1969), was more oxidized (Fig. 5E) in LPCKO liver. These data indicate that respiration was sufficient to sustain the oxidation of NADH.
Figure 5: Loss of PC reduces hepatic energy demand but not mitochondrial respiratory capacity.

A) Citrate synthase activity in livers of PCf/f and LPCKO mice n=6. B) Respiration in functioning isolated perfused liver determined by a flux balance analysis model. C) Concentrations of AMP, ADP, and ATP in the livers of 18-hour fasted PCf/f and LPCKO mice; n=4-5. D) Ratio of ATP to AMP; n=4-5. E) Mitochondrial redox state (NAD+/NADH) indicated by the [aKG][NH4]/[glu] in snap frozen livers of fasted mice.; n=4-5. F) Oxygen consumption measured by Seahorse of isolated mitochondria from PCf/f and LPCKO livers using 10 mM pyruvate and 5mM malate as substrate; n=4. G) Schematic illustrating the effect of LPCKO on hepatic mitochondrial energy metabolism and hepatic energetics. Data expressed as mean ± SEM. * indicates p<.05 by Student’s t-test.
The suppression of oxidative metabolism and respiration in functioning liver was contrasted by an oxidized redox state and elevated energy charge, thus we examined respiration in isolated mitochondria to clarify whether mitochondrial capacity is altered in the absence of PC. Mitochondria isolated from livers of LPCKO and PCf/f animals were exposed to media containing 10mM pyruvate and 5 mM malate, and oxygen consumption was measured using a Seahorse system. There was no difference in oxygen consumption rates when mitochondria were treated with ADP (to activate ATP production), oligomycin (to measure proton leak), CCCP (to measure maximal respiration) or antimycin A (to measure non-mitochondrial oxygen consumption) (Fig. 5F). Together, these observations suggest that LPCKO livers do not have an inherent defect in mitochondrial respiration, but rather that primary defects in the TCA cycle, gluconeogenesis, and the urea cycle lower the observed respiration secondary to decreased NADH production and ATP demand (Fig. 5G).
LPCKO mice are protected against HFD-induced glucose intolerance but not hepatic steatosis.
Elevated fat oxidation and increased acetyl-CoA activate PC (Williamson et al., 1966), and induce gluconeogenesis during obesity and insulin resistance (Rebrin et al., 1996). Thus, we tested whether liver specific loss of PC is sufficient to protect against elevated gluconeogenesis during a 60% fat diet (HFD). LPCKO mice tended to gain less weight during a HFD (Fig. S6A), perhaps due to slightly increased energy expenditure in these mice (Fig. S1F–H), though weight differences did not reach significance. After 12-weeks on a HFD, control mice had elevated fasting plasma glucose, while the LPCKO mice maintained levels similar to a standard chow diet (Fig. 6A). Glucose excursion in the LPCKO mice was significantly lower during a glucose tolerance test (Fig. 6B). Insulin administered into the portal vein of 12-week HFD mice caused rapid phosphorylation of Akt (Fig. S6B), but LPCKO liver was roughly 2-fold more sensitive than control liver to insulin action (Fig. 6C). After 18-weeks of a HFD LPCKO mice had lower fasting plasma insulin levels compared to the PCf/f mice (Fig. 6D). Several effects observed in chow-fed LPCKO mice, including increases in ketosis (Fig. 4N), fatty acid oxidation related mRNA (Fig. 4K) and hepatic energy charge (Fig. 5D), may protect insulin sensitivity. However, these potentially beneficial characteristics were lost during an 18-week HFD (Fig. S6C–F). Circulating triglycerides were lower in LPCKO mice (Fig. 6E), but biochemical analysis revealed no difference in liver TG content between LPCKO mice and PCf/f littermates (Fig. 6F). Inspection of H&E staining indicated that LPCKO liver (Fig. 6G) had reduced macrovesicular steatosis, but no improvement in microvesicular steatosis, inflammation, or necrosis. These results demonstrate that LPCKO mice are protected against HFD-induced changes in glycemia and hepatic insulin resistance but not hepatic steatosis.
Figure 6: LPCKO mice are resistant to HFD induced glucose intolerance but not hepatic steatosis.

A) Blood glucose in 5-hour fasted PCf/f and LPCKO mice fed either chow or 12 weeks of HFD; n=5-7. B) I.P. glucose tolerance test (2mg glucose/g body weight)) in 5-hour fasted chow and 12-week HFD mice; n=5-6. * indicates statistical significance for LPCKO HFD versus PCf/f HFD and † indicates statistical significance versus chow fed PCf/f by two-way repeated measures ANOVA with Tukey multiple comparison test. C) Quantification of Western blot analysis of Akt phosphorylation in response to portal insulin injection in 12-week HFD fed mice (see also Figure S6); n=4. D) Plasma insulin levels in 18-hour fasted PCf/f or LPCKO mice on a HFD for 18 weeks; n=5-7. E) Plasma triglycerides and F) liver triglyceride content in 18-hour fasted mice; n= 5-7. G) Vesicular steatosis measured in images of H&E-stained liver sections taken from 18-hour fasted mice; n=5-7. Data expressed as mean ± SEM. * indicates p<.05 by Student’s t-test. See also Figure S6.
Loss of hepatic PC predisposes liver to oxidative stress and inflammation by dysregulating NADP(H) redox state.
Inhibition of cataplerosis by knockdown of PEPCK protected glycemia, lowered oxidative metabolism, decreased oxidative stress, and reduced inflammation in liver during a HFD (Satapati et al., 2015). Thus, we examined whether inhibition of anaplerosis by loss of PC also protected liver pathology during a HFD. Serum amyloid P was elevated in LPCKO mice (Fig. S7A), but ALT was lower compared to control mice on a HFD (Fig. S7B). However, the AST/ALT ratio was increased by 3-fold in the LPCKO liver (Fig. S7C), suggesting that impaired ALT function in LPCKO liver (Fig. S4A) may have limited plasma transaminase activity. In fact, mRNA markers of inflammation and cell death were increased in LPCKO compared to control livers after a 12-week HFD, and dramatically increased after an 18-week HFD (Fig. 7A). Thus, loss of hepatic PC protects against impaired glycemia, plasma triglycerides, and macrovesicular steatosis, but predisposes liver to inflammation during a HFD. Given changes in mitochondrial metabolism in LPCKO liver, we investigated oxidative stress as a potential mechanism for increased susceptibility to inflammation. Nuclear factor (erythroid-derived)-like (Nrf) and other adaptive transcription factors are stabilized by TCA cycle intermediates (Al-Sawaf et al., 2015; Laukka et al., 2016), which were markedly suppressed in LPCKO mice on a HFD (Fig. S7D). Indeed, Nrf1/2 were activated, but the expression of their target gene, catalase, was suppressed (Fig. 7B). We observed alterations in TCA cycle intermediates and amino acids in HFD-fed mice (Fig. S7D–E), similar to those that provided an oxidized NAD(H) redox state on chow diet. We therefore examined whether a similar effect occurred in the NADP(H) redox state, an essential cofactor in antioxidant pathways. The impaired production of malate and accumulation of pyruvate resulted in a striking shift in the malic enzyme redox pair (Malate + NADP+ → Pyr + NADPH), suggesting a markedly lower NADPH/NADP+ ratio in LPCKO compared to control liver (Fig. 7C). Indeed, direct analysis of total NADPH and NADP+ confirmed a 4-fold lower NADPH/NADP+ ratio (Fig. 7D). NADPH acts as a reducing agent in the glutathione antioxidant system, thus its depletion led to less glutathione (GSH) in LPCKO mice (Fig. 7E). These factors should increase oxidative stress, which was confirmed by increased lipid peroxidation (Fig. 7F). Impaired control of NADP(H) appeared to mediate elevated inflammation, as IL6 expression strongly correlated with NADP(H) redox state (Fig. 7G) and total glutathione (Fig. S7F). Thus, loss of PC caused a redistribution of intermediates, which depleted NADPH/NADP+, suppressed antioxidant defenses, and predisposed liver to inflammation.
Figure 7: Loss of PC predisposes liver to oxidative stress and inflammation.

Expression levels of genes whose products are involved in A) inflammation and B) oxidative stress in 12 and 18-week HFD mice normalized to cyclophilin B; n=4-6. NADPH/NADP+ in snap frozen livers of fasted mice, indicated by C) the malate/pyruvate ratio and the malic enzyme equilibrium constant, or D) total NADP+ and NADPH ratio. E) Total amount of hepatic glutathione in the reduced state; n=4-6. F) Lipid peroxidation measured by the TBARS assay; n=4-6. G) Correlation between hepatic inflammation (IL6 expression) and NADPH/ NADP+ ratio. H) Schematic illustrating the effect of LPCKO on hepatic inflammation and oxidative stress. Data expressed as mean ± SEM. * Indicates p<.05 by Student’s t-test or 2-way ANOVA. Significance of relationship determined by Spearman correlation. See also Figure S7.
Discussion
Pyruvate carboxylase catalyzes the carboxylation of pyruvate to yield the TCA cycle metabolite OAA. This anaplerotic pathway allows TCA cycle intermediates to be used as precursors in a variety of pathways without depleting the TCA cycle (Fig. 1A). Despite impaired hepatic gluconeogenesis, LPCKO mice support normoglycemia by increased hepatic ketone production and elevated renal gluconeogenesis, similar to other mice with impaired hepatic gluconeogenesis (Burgess et al., 2004; Burgess et al., 2007). Loss of PC depleted TCA cycle intermediates and caused a dramatic suppression of TCA cycle activity, a more oxidized redox state, and lower respiration in functioning liver, but did not impair hepatic energetics (ATP/AMP) or cause an inherent defect in mitochondrial respiration. Remarkable alterations in liver and plasma amino acid profiles were indicative of impaired urea cycle function due to aspartate deficiency in LPCKO mice. Although LPCKO mice are resistant to high fat diet-induced hyperglycemia, they are not protected from hepatic steatosis. Rather, loss of PC induces a shift in intermediary metabolite pools that cause a more oxidized NADP(H) redox state and predisposes liver to oxidative stress and inflammation.
Although rare, human PC deficiency occurs with multiple subtypes of severity (reviewed in (Marin-Valencia et al., 2010)). PC deficient patients present with lactic acidosis, ketoacidosis hypoglycemia, elevated urea cycle intermediates, hyperlysinemia, hyperammonemia, seizures and neurological defects. These metabolic defects are thought to originate from impairments in gluconeogenic, TCA cycle and urea cycle functions (Garcia-Cazorla et al., 2006). Some of the presumed mechanisms in human PC deficiency are demonstrated by liver specific loss of PC, while others are not. The inhibition of the TCA cycle and activation of ketogenesis was elucidated by tracer analysis in LPCKO liver. The inhibition of the urea cycle was found to be due to aspartate deficiency, since aspartate supplementation was sufficient to raise urea production in LPCKO liver. However, the marked hyperlysinemia was unrelated to α-ketoglutarate deficiency, as previously postulated (Kamoun et al., 2002), inasmuch as α-ketoglutarate was the only organic acid to be increased in the LPCKO liver. The ALT equilibrium and elevated alanine concentration should have favored lower α-ketoglutarate (Groen et al., 1982), suggesting impaired ALT activity. Interestingly, impaired lysine degradation leads to inactivation of pyridoxal-5-phosphate (vitamin B6), a required co-enzyme in transaminases, particularly ALT (Hallen et al., 2013). The reduced activity of plasma ALT relative to AST observed in the LPCKO mice on a HFD is reminiscent of a similar effect of vitamin B6 deficiency in alcoholic liver disease (Sorbi et al., 1999).
Treatment of PC deficiency using supplements that bypass PC-mediated anaplerosis such as citrate, aspartic acid, or triheptanoin (Ahmad et al., 1999; Mochel et al., 2005) have been used with limited success in humans. Triheptanoin treatment generates propionyl-CoA as a PC-independent anaplerotic substrate for gluconeogenesis, though this approach has not been uniformly effective at treating the metabolic symptoms of PC deficiency in humans (Breen et al., 2014). Indeed, propionate did not improve hepatic glucose production, and the TCA cycle independent conversion of glycerol was also impaired in LPCKO liver. Gluconeogenic gene expression was reduced in LPCKO liver, perhaps due to enhanced insulin signaling. Triheptanoin may also work on the TCA cycle of neurons (Hadera et al., 2014), either by its direct metabolism or after being converted to C5 ketone bodies in the liver (Deng et al., 2009). The absence of impaired motor coordination or seizures with liver specific loss of PC indicates that PC in the CNS is crucial to the neurological deficits in PC deficiency. Indeed, liver transplantation resolves the metabolic phenotype, but not the neurological effects in PC deficient humans (Nyhan et al., 2002). Future experiments in PC knockout mice may help elucidate the underlying mechanisms of this disease.
In contrast to PC deficiency, elevated PC flux plays a role in obesity, insulin resistance, and nonalcoholic fatty liver disease. PC and PEPCK control the rate of non-oxidative flux into (anaplerosis) and out of (cataplerosis) the TCA cycle and hence regulate the initial steps of gluconeogenesis and glyceroneogenesis. PC flux also contributes to citrate synthesis, which is necessary for increased lipid synthesis during insulin resistance. Knockout of PC had similar benefits of knockdown of PEPCK by suppressing anaplerosis/cataplerosis in the TCA cycle, reducing gluconeogenesis, improving insulin action and lowering glucose in HFD mice. Likewise, deleting the mitochondrial pyruvate carrier (MPC) resulted in reduced hepatic gluconeogenesis and protection from hyperglycemia during either insulin deficiency (McCommis et al., 2015) or insulin resistance (Gray et al., 2015). Antisense oligo (ASO) knockdown of liver and adipose PC in rats (Kumashiro et al., 2013) also improved glycemia, and had the additional benefit of lowering hepatic steatosis. Although circulating triglycerides were lower in liver specific PC knockout mice, hepatic steatosis was not improved, and shifted from macrovesicular to microvesicular steatosis, potentially a more pathological form of fatty liver (Tandra et al., 2011). Alterations in lipid storage and release are likely due to impaired glyceroneogenesis and FFA re-esterification (Kumashiro et al., 2013; Nye et al., 2008), though it is not obvious why a similar effect does not occur with loss of PEPCK, which also impairs glyceroneogenesis. The potential for liver pyruvate carboxylase to be a therapeutic target against hyperglycemia and hyperlipidemia may be limited by its multi-faceted role in metabolism.
LPCKO mice highlight the role of PC in supporting TCA cycle function, fat oxidation and respiration in liver. Importantly, loss of PC depletes the TCA cycle pool and shifts mitochondria toward a higher NAD+/NADH ratio (more oxidized redox state). The former impairs TCA cycle function and limits citrate cataplerosis necessary for lipogenesis, while the latter promotes β-oxidation, consistent with increased ketogenesis observed in both fasting and fed states. Thus, despite robust inhibition of the TCA cycle, disposal of liver fat by β-oxidation is maintained by ketogenesis. Nonetheless, the shift of acetyl-CoA to ketogenesis and away from the TCA cycle, along with a reduction in ATP utilization by decreased gluconeogenic and urea cycle flux resulted in decreased hepatic respiration. This effect was not related to mitochondrial function, per se, inasmuch as in vivo ATP concentration/energy charge tended to be elevated, the lactate/pyruvate ratio was normal, and LPCKO mitochondria had normal respiration when malate was provided. It is notable that inhibition of cataplerosis by loss of PEPCK has opposite effects on redox state, likely because TCA cycle intermediates are markedly increased and inhibition of the TCA cycle occurs due to accumulation of NADH rather than the loss of TCA cycle functionality. Nonetheless, loss of PEPCK also suppresses the TCA cycle, reduces respiration in liver, increases ketogenesis (Satapati et al., 2015) and paradoxically increases energy charge (Berglund et al., 2009). Thus, the responsiveness of TCA cycle flux to anaplerosis and cataplerosis is critical for linking the ATP requirements of downstream pathways (e.g. gluconeogenesis and urea cycle) to redox state and respiration.
TCA cycle intermediates may also impact the oxidative stress response. We previously found that knockdown of PEPCK decreased oxidative metabolism and protected against oxidative stress and inflammation in HFD mice (Satapati et al., 2015). Despite a similar reduction in oxidative fluxes, improved insulin sensitivity, and prevention of hyperglycemia with loss of hepatic PC, the expression of oxidative stress and inflammatory markers were increased during a HFD. The similar flux profiles, but dramatically different metabolite profiles of these two models, may provide important clues about how oxidative metabolism coordinates with antioxidant mechanisms. First, elevated TCA cycle intermediates, like fumarate and succinate, caused by suppressed cataplerosis stabilize antioxidant transcription factors such as Nrf1/2, Hif-1 and If1 (Al-Sawaf et al., 2015; Laukka et al., 2016; Satapati et al., 2015). In contrast, these TCA cycle intermediates are decreased by suppressed anaplerosis in LPCKO mice. Although the expression of Nrf1/2 is elevated in LPCKO liver on a HFD, their downstream antioxidant target, catalase, was decreased. Second, suppressed cataplerosis in PEPCK knockdown mice caused a reduced redox state, including a higher NADPH/NADP+, which promoted antioxidant function (Satapati et al., 2015). Loss of PC had the opposite effect on redox by shifting the concentrations of metabolites in NADP(H) dependent equilibrium reactions to a more oxidized state. For example, accumulation of pyruvate and depletion of malate impinges the equilibrium of the malic enzyme reaction (Pyruvate + CO2 + NADPH → Malate + NADP+), and may cause the depletion of NADPH. Loss of NADPH, in turn, inhibits free radical scavenging by the glutathione and thioredoxin systems (Fisher-Wellman and Neufer, 2012), and deactivates catalase (Kirkman et al., 1999). Indeed, lower NADPH/NADP+ and total glutathione correlated closely with the activation of inflammatory pathways in LPCKO liver. Finally, less understood factors such as and impaired urea cycle function may also contribute to oxidative stress and/or inflammation (Bigot et al., 2017). Thus, the relative equilibrium between anaplerosis and cataplerosis in the TCA cycle, and attendant shifts in metabolite concentrations, may promote oxidative stress/inflammation by impinging on redox state and/or transcription factors.
Conclusions and Limitations of Study
Hepatic PC is required for gluconeogenesis, the TCA cycle, the urea cycle, redox balance and antioxidant capacity. Oxidative and anaplerotic fluxes in the TCA cycle are inherently difficult to measure (McCullough et al., 2018; Previs and Kelley, 2015). In this study, a [U-13C]propionate tracer was used, since it does not require PC to interrogate the TCA cycle. Numerous independent studies demonstrated the validity of this tracer (d’Avignon et al., 2018; Hasenour et al., 2015; Landau et al., 1993; Satapati et al., 2015), and confirm that it provides flux estimates similar to lactate tracers (Landau et al., 1995; Satapati et al., 2015). Wasserman and colleagues recently suggested (Hughey et al., 2018) that anomalous effects of propionate (Perry et al., 2016) occurred due to an unconventional infusion protocol. Nonetheless, we also used tracer independent studies, which demonstrated that alternative anaplerotic pathways were unable to compensate gluconeogenesis in LPCKO liver; leading to the conclusion that PC is the principle anaplerotic pathway in liver. Aspartate supplementation, on the other hand, stimulated urea production in the knockout liver, suggesting that PC derived OAA fueled both TCA and urea cycles. However, secondary effects on the malate-aspartate shuttle, which were not intensively investigated, may broadly limit TCA cycle, redox and transamination in the absence of PC. Thus, these results do not necessarily diminish the importance of alternative anaplerotic pathways/substrates in normal physiology. A potential benefit of PC inhibition was that it prevented hyperglycemia in obese mice, but this effect was eclipsed by the development of hepatic oxidative stress and inflammation. The depletion of TCA cycle intermediates, caused by loss of PC, imposed an oxidized NADP(H) redox state and limited antioxidant capacity. However, the precise TCA cycle intermediates, their relative concentrations and/or compartmentation that impacts the liver’s antioxidant potential are incompletely understood. A less severe inhibition of anaplerosis might retain the beneficial effects of lower gluconeogenic and oxidative flux without impairing antioxidant pathways. It is notable that inhibition of mitochondrial pyruvate transport partially suppresses anaplerosis, and has beneficial effects in the context of obesity and nonalcoholic fatty liver disease (McCommis and Finck, 2018). Thus, mechanisms that act on TCA cycle metabolism may have surprising effects on cell-stress that are difficult to predict without a better understanding of how this pathway and its metabolites impinge on redox and antioxidant systems.
Experimental Procedures
See STAR Methods.
STAR Methods
Further information and requests for resources and reagents should be directed to and will be fulfilled by the Lead Contact, Shawn C. Burgess (shawn.burgess@utsouthwestern.edu).
Experimental model and subject details
Animal Care
Mice were housed in a climate controlled facility (22-24°C) in ventilated cages with a 12-hour light/dark cycle with lights on between 0600 and 1800 local time. Adlibitum access to water was provided by individual bottles in each cage. All mice were group-housed, up to 5 mice per cage, and were provided with plastic “igloo” huts in the cage for environment enrichment. Mice were fed a standard rodent chow diet (Teklad Global 16% Protein Rodent Diet) consisting of 66% calories from carbohydrate, 22% from protein and 12% from fat. For the high-fat diet studies, mice were fed a diet consisting of 60% calories from fat, 18% from protein and 22% from carbohydrate (Teklad Adjusted Calories Diet 60/Fat). Experiments were performed on young adult male mice between the ages of 12-24 weeks. The liver specific pyruvate carboxylase knockout animals (LPCKO) were compared against littermates expressing the floxed PC gene but not the Cre recombinase. Animal housing facilities were managed by the Animal Resources Center at UT Southwestern Medical Center. All procedures were performed in accordance with National Institutes of Health guidelines and approved by the Institutional Animal Care and Use Committee at UT Southwestern Medical Center (APN 2015-101209).
Animal Model
Mice expressing the pyruvate carboxylase gene flanked by loxp sites (PCf/f) were created from cells obtained from the European Conditional Mouse Mutagenesis program (Skarnes et al., 2011). Creation of this mouse model is detailed in the results section. These mice are on a full C57BL/6N background. The PCf/f mice were bred with mice that express Cre recombinase under control of the liver-specific albumin promoter. The albumin-Cre mice used were originally acquired from Jackson Labs and have been maintained in our colony for the past 8 years and are on a mixed C57/BL6N and C57/BL6J background. Offspring were used for experiments and were therefore on a mixed C57/BL6J and C57/BL6N background.
Method Details
Lactate/Pyruvate tolerance test
LPCKO mice and PCf/f littermates were fasted for 18 hours and then given an intraperitoneal injection of 1.5 mg/g of a solution consisting of 10:1 sodium lactate to sodium pyruvate dissolved in saline solution at 150 mg/mL, resulting in an injection volume of approximately 250 μL. 40% of the lactate and pyruvate was [U-13C]lactate and [U-13C]pyruvate (Cambridge Isotopes). Blood samples were collected through small superficial incision in the tail. Blood glucose was measured by glucometer (Accucheck Aviva) and blood lactate was measured by blood lactate meter (Nova Biomedical Lactate Plus). Blood glucose and lactate measurements were taken prior to the pyruvate injection and then at 10, 20, and 30 minutes following the lactate/pyruvate treatment.
Glucose tolerance test
LPCKO and PCf/f littermates fed high fat diet for 14 weeks and age-matched chow fed mice were fasted for 5 hours and then given 2 mg glucose/kg body weight by intraperitoneal injection of D50 50% dextrose solution. Blood glucose was measured before the glucose injection and every 15 minutes thereafter, up to 1 hour using a glucometer (Accucheck Aviva) from blood derived from superficial tail incision. Mice were conscious and unrestrained for the duration of the glucose tolerance test.
Hepatic insulin signaling
LPCKO and PCf/f littermates fed high fat diet for 12 weeks were fasted for 18 hours and then given an intrahepatic injection of 5 U/kg insulin in 200 μL of saline while under ketamine/xylazine anesthesia. A small portion of the liver was excised to use as a pre-insulin treated sample. Livers were collected 2 minutes following the insulin injection. Western blots were performed to measure Akt phosphorylation as described below.
Western Blotting
Protein extracts were prepared by homogenization of approximately 50 mg of frozen liver tissue in RIPA buffer. Proteins were detected using SuperSignal Pico chemiluminescent substrate (Pierce) and the Imagequant LAS 4000 system (GE Healthcare). Rabbit anti-Pcb (pyruvate carboxylase) was obtained from Santa Cruz Biotech, and Rabbit anti-Ppib (Cyclophilin B) was obtained from Abcam. Antibodies to total Akt, pAkt(S473), and pAkt(T308) were obtained from Cell Signaling. Antibodies were diluted 1:1000.
Gene Expression
Levels of gene expression were determined by qPCR analysis. RNA was extracted from snap frozen liver tissue using RNA Stat60 (Tel-Test). cDNA was synthesized from 2 μg RNA using the iScript Advanced cDNA Synthesis Kit (BioRad). The reaction was run in triplicate using iTaq Universal SYBR Green (BioRad) on the CFX384 Real-Time PCR Detection system under control of BioRad CFX Manager 3.1 software (BioRad). Primer sequences are shown in Supplemental Table 1.
Plasma Hormones
Plasma insulin was determined using a Crystal Chem Ultra-sensitive Mouse Insulin ELISA according to kit directions. 5 μL of plasma was used and OD at 450/630 nm was determined using a Synergy H1 hybrid plate reader (Biotek). Glucagon was determined using a Crystal Chem Glucagon ELISA according to kit directions. 10 μL of plasma was used and OD at 450/630 nm was determined using a Synergy H1 hybrid plate reader (Biotek).
Ketones
Total ketones were measured from 2 μL of plasma or 10 μL of liver perfusate using an Autokit Total Ketones assay kit (Wako) according to kit directions.
Liver Enzymes
Plasma ALT and AST activity were measured from 5 μL of plasma using the ALT Activity Assay (Sigma) or AST Activity Assay (Sigma) according to kit directions. OD at 570 nm (ALT) or 450nm (AST) was measured using a Synergy H1 hybrid plate reader (Biotek).
Plasma Lipids
Glycerol and triglycerides were measured from 2 μL of plasma using the Triglyceride Determination Kit (Sigma) according to kit directions. Absorbance at 540 nm was measured using a Synergy H1 hybrid plate reader (Biotek) to determine free glycerol and triglyceride content. Free fatty acids were measured using HR Series NEFA reagent kit (Wako) according to kit directions. 4 μL of plasma was used and OD at 560/670 nm was measured using a Synergy H1 hybrid plate reader (Biotek).
Hepatic Lipids
Triglycerides were extracted from whole liver using a chloroform-methanol Folch extraction. Approximately 100 mg of frozen liver was homogenized in 2:1 chloroform methanol solution in a 1:20 ratio. Lipids were extracted at room temperature for 30 min. 50 mM NaCl was added in a 1:5 ratio, samples were vortexed for 30 sec and then centrifuged 10 min at 1000×g to separate phases. The organic phase was transferred into a new tube and washed twice with 0.36 M CaCl2 in methanol in a 1:5 ratio. Organic phase was removed and brought up to 5 mL with chloroform. 100 μL of extract was dried down and re-suspended in 160 μL of tert-butanol and 80 μL of 1:1 Triton X-100/methanol for quantitation of liver TG using the Triglyceride Determination Kit (Sigma) according to kit directions. 20 μL of the re-suspended lipid solution was run in duplicate and absorbance was read at 540 nM using a Synergy H1 hybrid plate reader (Biotek).
Ammonia Concentration
Ammonia levels in plasma were determined using an Ammonia Assay Kit (Abcam) according to kit instructions. 10 μL of plasma was used and absorbance was read at 570 nM using a Synergy H1 hybrid plate reader (Biotek). Ammonia levels in plasma were determined using the same ammonia assay kit protocol. Approximately 10 mg of tissue was homogenized in 1 mL of ammonia assay buffer, this extract was assayed for ammonia concentration.
Measurement of Glycogen in Liver
Approximately 50 mg of liver tissue was homogenized in a glass tube containing 0.5 ml of 30% (m/v) KOH and boiled for 15 min. After centrifugation at 1800×g, 200 μL of supernatant was spotted onto a Whatman filter paper disk, washed twice with 70% (v/v) ethanol and once with acetone. Glycogen was hydrolyzed by amyloglucosidase (Sigma) by adding 2 mL of enzyme (0.2 mg/mL in 50 mM sodium acetate pH 4.8) to the dried disk followed by incubation at 55°C for 1 hou r. Glucose concentration was measured using glucose kit (Sigma).
Urea/Creatinine Concentration
Concentrations of urea (Abcam) and creatinine (Cayman Chemical) in urine were determined using commercial kits. Urine was collected from ad-lib fed mice. 1 μL of urine diluted 1:1000 was used for the urea assay kit. 15 μL of urine diluted 1:10 was used for the creatinine assay. Urea was measured by OD at 570 nm using a Synergy H1 hybrid plate reader (Biotek). Creatinine was measured by the difference of initial absorbance and final absorbance at 500 nm.
Measurement of Glutathione in Liver
Glutathione was measured using a commercially available kit (Abcam). Approximately 20 mg of liver tissue was homogenized, deproteinized with trichloroacetic acid, and diluted 1:60 according to the kit’s directions. Fluorescence was measured at Ex/Em 490/520 using a Synergy H1 Hybrid plate reader (Biotek).
Measurement of Thiobarbituric Acid Reactive Substances (TBARS) in Liver
TBARS was measured using a commercially available kit (Cayman Chemical). Approximately 25mg of liver tissue was homogenized in 250ul of RIPA buffer with protease inhibitors and sonicated for 10 seconds with an amplitude power setting at 10%. Samples were centrifuged at 1600 × g for 10 minutes at 4°C, and the supernatant was used according to the kit’s directions. Absorbance was read at 532nm using a Synergy H1 Hybrid plate reader (Biotek).
1H NMR metabolic profiling
Dried methanol liver extracts were reconstituted in 250 μL of 0.1 M phosphate buffer solution (pH = 7.0, 99.9% D2O, 0.9 mM TSP) and mixed vigorously. Samples were centrifuged for 3 minutes at 21,000×g, and 200 μL of supernatant was transferred into 3 mm NMR tubes. Spectra were recorded on 14.1 T Varian INOVA spectrometer equipped with 3 mm broadband probe. 1H spectra were acquired using 90° pulse with solvent signal suppression 3.5 s relaxation delay, 2.0 s acquisition time and 128 transients. Raw FIDs were zero filled to 64k data points and Fourier transformed using 0.3 Hz line broadening. After phase and baseline correction spectra were exported to MATLAB for further processing. Chemical shift was calibrated using TSP signal at 0 ppm. Residual water signal (4.675 - 4.982 ppm) was removed from analysis. Analysis was performed as previously described (Silvers et al., 2017). Briefly, Signals were aligned using correlation optimized warping (COW) and icoshift algorithms and finally reduced to 9193 variables. Multivariate data analysis was performed in SIMCA P+ v.13.0 using pareto scaling.
Measurement of Amino Acids in Liver
Extracted amino acid samples were immediately spiked with labeled amino acid internal standard (Isotec) and cold acetone. The extraction and derivatization of amino acids from liver were prepared as previously described (Casetta et al., 2000). Briefly, tissue was homogenized in methanol, centrifuged to remove precipitant, dried, and resuspended in acidified butanol to form amino acid butyl esters. The separation of amino acids was achieved on a reverse phase C18 column (Xbridge, Waters, Milford, MA; 150×2.1 mm, 3.0 μm) with a gradient elution. Amino acids were detected using the MRM mode by monitoring specific transitions under positive electro spray on API 3200 triple quadrupole LC/MS/MS mass spectrometer (Applied Biosystems/Sciex Instruments). Quantification was done by comparison of individual ion peak areas to that of an internal standard.
Measurement of Organic Acids in Liver
Approximately 50 mg of frozen tissue was homogenized in 0.8% sulfosalicylic acid and 5M hydroxylamine-HCl solution. Samples were spun at 4°C for 10 minutes. The supernatant was neutralized with 2 M KOH to pH 6-7 and then incubated at 65°C for 60 min. The reaction mixture was acidified to pH 1-2, saturated with sodium chloride, and extracted with ethyl acetate. The dried extract was added to acetonitrile and MTBSTFA as silylation reagent and reacted at 60°C for 60 min. The derivatives were analyzed in both scan and SIM modes with an Agilent 7890A gas chromatography interfaced to an Agilent 5975C mass-selective detector (70eV, electron ionization source). An HP-5ms GC column (30 m×0.25 mm I.D., 0.25 μm film thickness) was used for all analyses (Des Rosiers et al., 1994). Quantification was done by comparing individual ion peak areas to that of an internal standard.
Measurement of amino acids in plasma
Thawed plasma samples were immediately spiked with labeled amino acid internal standard (Isotec) and cold acetone. Plasma was homogenized with methanol, centrifuged to remove precipitant, dried, and re-suspended in acidified butanol to form amino acid butyl esters as previously detailed (Casetta et al., 2000). Amino acid derivatives were separated on a reverse phase C18 column (Xbridge, Waters, Milford, MA; 150×2.1 mm, 3.0 μm) with a gradient elution and detected using the MRM mode by monitoring specific transitions under positive electrospray on API 3200 triple quadrupole LC/MS/MS mass spectrometer (Applied Biosystems/Sciex Instruments). Quantification was done by comparing individual ion peak areas to that of an internal standard.
Measurement of adenine nucleotides in liver
Adenine nucleotides were measured by ion-pair reverse-phase liquid chromatography–electrospray ionization-tandem mass spectrometric method. The frozen liver samples were immediately spiked with labeled ATP and AMP (Sigma-Aldrich) internal standards. Approximately 50 mg of frozen tissue was homogenized in 500 μL 0.4 M HClO4 containing 0.5 mM EGTA and remained on ice for 30 minutes. Samples were spun at max speed at 4°C for 10 minutes. The supernatant was neutralized with 0.5 M K2CO3. After removing the precipitate (KClO4) by centrifugation, the neutralized supernatants were stored at −20°C before being subjected to LC–MS analyses. 1 μL was injected for LC-MS analysis.
For NADH and NADPH frozen liver samples were homogenized in 40× 0.01M KOH and 20× CHCl3 and spiked with AMP internal standard. Samples were centrifuged at 1,500×g for 15 minutes at 4°C. 250 μL of the supernatant was mixed with 750 μL of ice cold methanol and incubated on ice for 5 minutes. This mixture was then centrifuged at max speed for 15 minutes at 4°C. 2 μl of the supernatant was injected for LC-MS analysis.
Analysis was done on an API 3200 triple quadrupole LC-MS/MS mass spectrometer (Applied Biosystems/Sciex Instruments) in positive electrospray ionization mode. The mass spectrometer was equipped with a Shimadzu LC-20AD liquid chromatograph (LC) and a SIL-20ACHT auto sampler. A reverse-phase C18 column (Waters ×Bridge, 150 × 2.1 mm, 3 μm) was used with LC mobile phase consisting of water/methanol (5:95, v/v) with 4 mM dibutylamine acetate (eluent A), and acetonitrile with 4 mM dibutylamine acetate (eluent B).
Positive-ion-mode ESI was used for the analysis of the nucleotides. Multi reaction monitoring (MRM) measurements were carried out for the detection of the nucleotides in standard solutions and biological samples.
Measurement of acylcarnitines in liver
Approximately 20 mg of frozen tissue was homogenized in water. The supernatant from the centrifugation was spiked with deuterium-labeled acylcarnitine standards (Cambridge Isotope Laboratories, Andover, MS). Following, proteins were removed by precipitation with acetonitrile, the derivatization and measurement were performed as previously described (Millington et al., 1990). Chromatographic separation was achieved on a C18 column (Xbridge, Waters, Milford, MA; 150×2.1 mm, 3.0μm). The analysis was performed in MRM mode on API 3200 triple quadrupole LC/MS/MS mass spectrometer with electrospray ionization. Quantification of acylcarnitines was achieved by comparison of the individual ion peak area with that of the internal standard.
Tracer Infusions
Indwelling jugular vein catheters were surgically implanted and mice were allowed five days for recovery. Conscious and unrestrained mice were infused with [U-13C6]glucose after an 18-hr fast. Tracer was delivered in two phases: as a prime at 1 μmol/min for 10 minutes, followed by continuous infusion at 0.2 μmol/min for 80 minutes. After infusions, mice were anesthetized by isoflurane, and blood was collected until exsanguinated by cardiac puncture in EDTA containing tubes and centrifuged at 1,100×g at 4°C for 15 minutes to obtain plasma. Liver was collected and flash-frozen in liquid nitrogen. Samples were stored at −80°C until further analysis.
Endogenous glucose production (EGP) and gluconeogenesis (GNG) in fasted mice
Steady state metabolic fluxes were calculated by combining mass isotopomer distributions (MIDs) of plasma glucose (Gluc.blood) and lactate (Lac.blood) and the known infusion rate of [U-13C6]glucose (GLC_inf) in INCA software. Flux through each reaction was estimated by minimizing sum of squared residual (SSR) between simulated and experimentally measured MIDs. Flux estimates were repeated 50 times from random initial values. Residuals were normally distributed and fits were in an acceptable SSR range [1.2-14.4] with 6 degrees of freedom. The metabolic network consisted of three compartments: liver (all gluconeogenic tissues), blood and muscle (all extrahepatic tissues), similar to a previously published model (Antoniewicz et al., 2007). The metabolic network with carbon atom transitions is presented in Supplementary Table S2. Model assumptions were as follows: 1) the gluconeogenic compartment (liver) cannot distinguish between liver and kidney metabolism and therefore reports whole-body GNG; 2) there is no recycling of labeled CO2; 3) liver PDH is negligible; 4) glycogen is depleted in 18-hour fasted mice; 5) oxaloacetate is fully equilibrated with succinate; 6) blood glucose passes through muscle (oxidative compartment) and is either terminally oxidized to CO2 or recycled into blood as lactate; 7) lactate is diluted only in the muscle compartment; and 8) activity of the pentose phosphate pathway is negligible. Although the model consists of many reactions, not all could be estimated with an acceptable level of precision (based on the analysis of confidence intervals). Reported fluxes including EGP, GNG_Lactate (GNG that required PC flux) and GNG_Unlabeled (GNG from all other carbon sources that do not require PC flux) could be estimated reliably.
Liver Perfusions
Livers from LPCKO mice and PCf/f littermates were isolated following an 18 hour fast and perfused without recirculation for 60 minutes (tracer studies) or 90 minutes (supplementation studies) as previously described (Burgess et al., 2004; Burgess et al., 2007). Mice were anesthetized with ketamine/xylazine and livers were exposed and cannulated by the portal vein after which they were excised from the body and placed in a vessel containing effluent perfusate which was continuously removed and collected on ice at the same rate as perfusate was pumped in. Livers were perfused at a rate of 8 mL/min with a non-recirculating perfusate containing 25 mM NaHCO3, 118 mM NaCl, 4.7 mM KCl, 1.2 mM MgSO4, 1.2 mM KH2PO4, 0.15 mM pyruvate, 0.25 mM glycerol, 1.5 mM lactate, 30 g/L bovine serum albumin (BSA), and 0.8 mM free fatty acids mixture (22% palmitic acid, 5% palmitoleic acid, 3% stearic acid, 27% oleic acid, 38% linoleic acid, 2% γ-linoleic acid, and 3% decosahexanoic acid). In the tracer studies, the perfusate contained 0.1 mM [U-13C3] propionate (Cambridge Isotopes), and 3% (v/v) D2O (Cambridge Isotopes). 1 mL samples of perfusate were taken every 15 minutes to determine glucose and urea production over time. In the tracer studies the perfusion continued for 60 minutes, whereas the supplementation perfusions lasted for 90 minutes with a period of 30 minutes for each supplement. In the supplementation studies, 1 mM aspartic acid, glutamine, or unlabeled propionate were added to the perfusate using an infusion pump (Harvard Apparatus), allowing for the rapid switching between different substrates within the same liver perfusion study. Oxygen consumption was determined by measuring the oxygen concentration in both the afferent and efferent perfusate with a blood gas analyzer. Following the study, livers were freeze clamped and stored at −80°C.
Perfusate Glucose
Glucose concentration in perfusate was determined using the Glucose (HK) Assay Kit (Sigma Aldrich) according to kit directions. 50 μL of perfusate was assayed and absorbance at 340 nm was determined using a Synergy H1 hybrid plate reader (Biotek).
Perfusate glucose purification
Glucose purification was performed as previously described (Burgess et al., 2004). 70% perchloric acid was added to thawed perfusate to a final concentration of 5% and the solution was spun down to remove proteins. After neutralization to pH 7.5 the solution was suction filtered to remove KClO4. The filtered solution was evaporated using a rotary evaporator, and the dried extract was re-suspended in 90% methanol/water and then filtered again to remove excess salts. The filtered methanol/water solution was then evaporated using a rotary evaporator. The dried sample was then re-dissolved in distilled water and run through an ion exchange column consisting of activated Amberlite anion and Dowex cation resins to further remove salts. The purified glucose was then freeze dried overnight using a SpeedVac (Thermo Fisher).
Mono-acetone glucose (MAG) conversion
MAG conversion was performed as previously described (Burgess et al., 2004). Conversion of glucose to MAG creates an asymmetric molecule in which all 6 positions of glucose can be individually resolved by NMR. 6 mL of acetone was added to the dried glucose followed by 240 μL of H2SO4 and left for 4 hours under stirring, after which, 6 mL of distilled water was added and the pH was changed to 1.9 using Na2CO3 and left to react for 24 hours under stirring. The pH was then changed to 8 with Na2CO3 and the solvent evaporated using a SpeedVac concentrator. The dried material was washed with boiling ethyl acetate. The ethyl acetate solution was then gravity filtered through Whatman filter paper and dried to yield a white crystalline solid.
Mono-acetone glucose 2H and 13C NMR
The MAG samples were dissolved in a solution of 7 μL DI water and 193 μL acetonitrile and transferred into a 3 mm NMR tube. NMR spectra of 2H and 13C were acquired on a 14.1 T Varian INOVA spectrometer using a 3 mm broadband probe tuned to 92 MHz. Pulse was applied at 90° and signal acqu isition took place over 1 s. For 13C the instrument was tuned to 150 MHz using a 50° pul se with an acquisition time of 1.5 s. Peak areas of signals were analyzed using ACD/NMR Processor Academic Edition.
Metabolic Flux Analysis in perfused liver
The 2H signals from MAG at the H2, H5, and H6s positions were used to calculate rates of glycogenolysis and gluconeogenesis. The ratio of enrichment at H2 to H5 (H2/H5) corresponds to glucose derived from glycogen; the ratio of enrichment at H6s to H2 (H6s/H2) corresponds to flux of carbon from the TCA cycle; and difference in enrichment at H5 and H6s divided by the enrichment at H2 ([H5-H6]/H2) corresponds to glucose derived from glycerol. The 13C spectra, particularly the multiplets observed at the C2 position allowed for calculation of rates of anaplerosis, gluconeogenesis, and TCA cycle flux. Labeling in C1 and C2 produces the 1-2 doublet (D12); labeling in C2 and C3 produces the 2-3 doublet (D23), and labeling in all three produces the quartet (Q). The ratios of the areas of these peaks can be used to measure pyruvate cycling ([D12-Q]/[Q-D23]), flux through PEPCK ([D12-D23]/[Q-D23]), and flux through citrate synthase ([D23]/[Q-D23]). These relative fluxes are then normalized to the rate of gluconeogenesis as determined by 2H tracer analysis (Burgess et al., 2004; Burgess et al., 2007; Jin et al., 2004; Satapati et al., 2015).
Flux Balance Analysis (FBA)
Fluxes obtained from metabolic flux analysis using analytical equations based on 2H and 13C NMR isotopomer analysis of glucose were used as an input for further flux balance analysis in INCA software (Young, 2014). For modeling purposes mean flux values were used with SEM as a weighting factor. Briefly, by using measured fluxes, stoichiometric constraints and cofactor balances it is possible to infer unknown or otherwise hard to directly measure pathways (Supplementary Table S3). Cofactors: NAD+, NADH, FAD+ and FADH2 were balanced while ATP and ADP were remained unbalanced during FBA modeling.
Citrate Synthase Activity
Approximately 20 mg of liver tissue was homogenized in 20:1 Cell Lytic MT reagent (Sigma) and spun down 10 min at 12,000×g to remove cell debris. Protein amount was quantified by Pierce BCA assay (Thermo Fisher). The supernatant was used with the Citrate Synthase Activity Assay kit (Sigma) to measure citrate synthase activity according to kit directions. Data was acquired by detecting absorbance at 412 nm every 10 seconds for 1.5 minutes using a Synergy H1 hybrid plate reader (Biotek).
Mitochondrial Isolation
Mitochondria were extracted from whole mouse liver in isolation buffer consisting of 10 mM HEPES, 200 mM sucrose, and 0.5 mM EGTA at pH 7.4. All isolation procedures were performed either on ice or in cold room at 4°C. Livers were excised from mice under isoflurane anesthesia, cut into small sections, and washed with isolation buffer. Liver sections were then placed in 5 mL isolation buffer and transferred to a glass Potter-Elvehjem homogenizer where they were homogenized using a rapidly spinning Teflon pestle. Homogenized samples were spun down 5 times at 600×g for 5 minutes collecting the supernatant after each spin to eliminate cellular debris. Mitochondria were then pelleted by spinning at 10,000×g for 10 minutes and resuspended in 500 μL of isolation buffer. A 25 μL sample was lysed and assayed for protein content to determine yield of extraction.
Mitochondrial Function
Mitochondrial function was assayed using a Seahorse XFe96 system (Agilent), as previously described (Rogers et al., 2011). Mitochondria were plated at 5 μg protein per well into a 96 well Seahorse culture plate (part of Seahorse XFe96 FluxPak). 12 hours prior to the experiment, a 6 well flux assay plate (part of Seahorse XFe96 FluxPak) was placed into seahorse calibrant solution. At the time of the experiment ADP, Oligomycin, CCCP, and Antimycin A were loaded into the plate for injection at final concentrations of 4 mM ADP, 4 μM oligomycin, 10 μM CCCP, and 4 μM Antimycin A. Mitochondria were plated in media containing either 10 mM pyruvate and 5 mM malate or 10 mM succinate and 5 mM malate. The plates were loaded into the Seahorse XFe96 analyzer and oxygen concentration was measured in individual wells to determine the rate of oxygen consumption.
Histology
Liver sections were collected from mice and fixed in 10% formalin in phosphate buffered saline. Livers were processed and embedded in paraffin at the Molecular Pathology Core at UT Southwestern Medical Center. Sections were stained with haemotoxylin and eosin and slides were visualized under 10× magnification on an Olympus BX41 microscope (Olympus Corporation). Images were captured using Cellsens Standard 1.13 software (Olympus Corporation). Liver sections were scored for by a blinded pathologist.
Rotarod Testing
Motor coordination was tested using a rotarod test at the UT Southwestern Medical Center Rodent Behavior Core Facility. Mice were given 4 tests per day over 2 days with a 20-minute interval between the trials. The wheel was set to accelerate from 5-45 RPM over the course of 5 minutes, and the trial ended when the mouse held on to the rod for two full rotations.
Indirect Calorimetry
Food intake, meal patterns, energy expenditure, and locomotor activity were monitored using a combined indirect calorimetry system (Labmaster, TSE Systems GmbH, Germany) at the UT Southwestern Metabolic Phenotyping Core. Experimental animals were individually housed in a light (12 hr on/12 hr off, 7am-7pm) and temperature (22.5-23.5°C) controlled environment, and acclimated in the home cage for 5 days before data collection. Mice were then analyzed in the metabolic chambers for 4 days and were provided with food and water ad libitum. O2 consumption and CO2 production were measured by indirect calorimetry to determine energy expenditure. Locomotor activity was measured using a multidimensional infrared light beam detection system. Continuous food and water intake was recorded using lid-mounted sensors.
Statistical analysis
Details of statistical analyses used in each study are available in the corresponding figure legends. All data are presented as mean +/− SEM. Statistical significance was defined as p < 0.05. Two-tailed student’s t-test, Two-way ANOVA, and Two-way Repeated measures ANOVA were used as appropriate. Grubb’s outlier test was used to determine outliers. All statistical analysis was performed using Graphpad Prism 7 software.
Supplementary Material
Key Resource Table
| REAGENT or RESOURCE | SOURCE | IDENTIFIER |
|---|---|---|
| Antibodies | ||
| Rabbit anti-Pcb (Pyruvate Carboxylase) | Santa Cruz Biotech | Cat# sc-67021 |
| Rabbit anti-Ppib (Cyclophilin B) | Abcam | Cat# Ab16045 |
| Rabbit anti-Akt | Cell Signaling | Cat# 9272 |
| Rabbit anti-Phospho-Akt (Thr308) | Cell Signaling | Cat# 2965 |
| Chemicals, Peptides, and Recombinant Proteins | ||
| U-13C Propionate | Cambridge Isomiddlees | Cat# CLM-1865 |
| 2H2O | Cambridge Isomiddlees | Cat# DLM-4-1000 |
| U-13C Lactate | Cambridge Isomiddlees | Cat# CLM-1579 |
| U-13C Glucose | Cambridge Isomiddlees | Cat# CLM-1396 |
| U-13C Pyruvate | Sigma-Aldrich | Cat# 490717 |
| Sodium pyruvate | Sigma-Aldrich | Cat# P2256 |
| Sodium propionate | Sigma-Aldrich | Cat# P1880 |
| L-(+)-Lactic acid solution | Sigma-Aldrich | Cat# L1875 |
| Glycerol | Sigma-Aldrich | Cat# G5516 |
| Glutamine | Sigma-Aldrich | Cat# G8540 |
| Aspartic Acid | Sigma-Aldrich | Cat# A7219 |
| Bovine Serum Albumin | Sigma-Aldrich | Cat# A3803 |
| Palmitic Acid | Sigma-Aldrich | Cat# P5585 |
| Palmitoleic Acid | Sigma-Aldrich | Cat# P9417 |
| Stearic Acid | Sigma-Aldrich | Cat# S4751 |
| Oleic Acid | Sigma-Aldrich | Cat# O1008 |
| Linoleic Acid | Sigma-Aldrich | Cat# L1376 |
| γ-Linoleic Acid | Sigma-Aldrich | Cat# L2378 |
| Decosahexanoic acid | Sigma-Aldrich | Cat# D2534 |
| Amberlite Resin | Sigma-Aldrich | Cat# A9960 |
| Dowex Resin | Sigma-Aldrich | Cat# 217506 |
| 70% Perchloric Acid | Sigma-Aldrich | Cat# 244252 |
| Ethyl Acetate | EMD Millipore | Cat# EX0245 |
| ADP | Sigma-Aldrich | Cat# A2754 |
| CCCP | Sigma-Aldrich | Cat# C2759 |
| Oligomycin | Sigma-Aldrich | Cat# O4876 |
| Antimycin A | Sigma-Aldrich | Cat# A8674 |
| Succinate | Sigma-Aldrich | Cat# S2378 |
| Malate | Sigma-Aldrich | Cat# 240176 |
| Glutamate | Sigma-Aldrich | Cat# 49621 |
| Amyloglucosidase | Sigma-Aldrich | Cat# A7420 |
| Critical Commercial Assays | ||
| Ammonia Assay Kit | Abcam | Cat# ab83360 |
| Urea Assay Kit | Abcam | Cat# ab83362 |
| GSH/GSSG Ratio Detection Assay Kit | Abcam | Cat#ab138881 |
| Seahorse XFe96 FluxPak mini | Agilent | Cat# 102601–100 |
| iScript cDNA Synthesis Kit | BioRad | Cat# 1708890 |
| Mouse Glucagon Elisa Kit | Crystal Chem | Cat# 81518 |
| Ultra-Sensitive Mouse Insulin ELISA | Crystal Chem | Cat# 90080 |
| TBARS Assay Kit | Cayman Chemical | Cat# 10009055 |
| Creatinine Assay Kit | Cayman Chemical | Cat# 500701 |
| Cell Lytic MT Cell Lysis reagent | Sigma Aldrich | Cat# C3228 |
| Citrate Synthase Activity Assay | Sigma-Aldrich | Cat# CS0720 |
| Glucose (HK) Assay Kit | Sigma-Aldrich | Cat# GAHK20 |
| Triglyceride Determination Kit | Sigma-Aldrich | Cat# TRO100 |
| ALT Activity Assay | Sigma-Aldrich | Cat# MAK052 |
| AST Activity Assay | Sigma-Aldrich | Cat# MAK055 |
| RNA STAT-60 | Tel-Test | Cat# Cs-111 |
| Pierce BCA Protein Assay | Thermo Fisher | Cat# 23225 |
| SuperSignal West Pico Chemiluminescent Substrate | Thermo Fisher | Cat# 34080 |
| Autokit Total Ketones | Wako Diagnostics | Cat# 411-73401 |
| HR Series NEFA Reagent | Wako Diagnostics | Cat# 955-34693 |
| Deposited Data | ||
| NA | ||
| Experimental Models: Organisms/Strains | ||
| Mouse: Pyruvate carboxylase floxed | Made in lab. Cells purchased from EMMA | |
| Mouse: Albumin-cre | This lab (originally Jackson Labs) | |
| Oligonucleotides | ||
| Please see Table S1 for qPCR primer sequences | ||
| Software and Algorithms | ||
| MSD ChemStation | Agilent Technologies | E 02.01.1177 |
| VNMRJ | Agilent Technologies | http://openvnmrj.org |
| ACD/NMR Processor Academic Edition | Advanced Chemistry Development | www.acdlabs.com/resources/freeware/nmr_proc/ |
| Wave 2.4 | Agilent Technologies | www.agilent.com/en-us/support/cell-analysis-(seahorse)/seahorse-xf-software |
| BioRad CFX Manager 3.1 | BioRad Laboratories | www.bio-rad.com/en-us/product/previous-qpcr-software-releases |
| Gen5 2.01 | BioTek Instruments | www.biotek.com/products/software-robotics-software/gen5-microplate-reader-and-imager-software/ |
| Graphpad Prism 7 | GraphPad Software | www.graphpad.com |
| CellSens Standard 1.13 | Olympus Corporation | www.olympus-lifescience.com/en/software/cellsens/ |
| SIMCA P+ v.13.0 | Umetrics | umetrics.com/products/simca |
| INCA v1.7 | VU e-Innovations | mfa.vueinnovations.com/ |
Highlights:
Pyruvate carboxylase (PC) maintains hepatic TCA cycle function and gluconeogenesis
PC replenishes TCA cycle intermediates required for urea cycle and redox capacity
Loss of hepatic PC prevents hyperglycemia in obesity but worsens liver inflammation
PC moderates oxidative stress during obesity by maintaining NADPH and glutathione
Context and Significance:
Pyruvate carboxylase (PC) is an enzyme necessary for the biosynthesis and oxidation of nutrients. Although PC exists in many tissues, it is especially important in the liver for coordinating glucose and fat metabolism. Defects in PC driven pathways are prominent in diseases such as obesity and diabetes. This study investigated PC as a site of metabolic control, mediator of metabolic disease and therapeutic target. Removal of PC from the liver inhibited glucose production and prevented high blood sugar levels in obese mice, but also made the liver more susceptible to inflammation by depleting metabolites necessary for fat, amino acid and antioxidant metabolism. Although PC is complicit in some metabolic diseases, the potential benefits of targeting PC are eclipsed by its indispensable role in supporting critical metabolic pathways.
Acknowledgements
The authors acknowledge the UT Southwestern Metabolic Phenotyping Core for their assistance with the calorimetry studies. Tianteng He, Xiaoli Lin and Wei Zhang provided surgical expertise for the liver perfusion studies. PCf/f mice were created with support from UT Southwestern Medical Center (SCB). Metabolic analysis was supported by NIH R01DK078184 (S.C.B) P41EB015908 (SCB, SD) and the Robert A. Welch Foundation I-1804 (SCB and SD). DAC was supported by F32DK105741.
Footnotes
Publisher's Disclaimer: This is a PDF file of an unedited manuscript that has been accepted for publication. As a service to our customers we are providing this early version of the manuscript. The manuscript will undergo copyediting, typesetting, and review of the resulting proof before it is published in its final citable form. Please note that during the production process errors may be discovered which could affect the content, and all legal disclaimers that apply to the journal pertain.
M1, M2, M3, etc. indicate the mass enrichment of a stable isotope (e.g. 13C or 2H) in a metabolite after correction for natural abundance. In this example, “M3 enriched oxaloacetate” indicates that oxaloacetate was labeled with a 13C isotope in 3 positions.
Declaration of Interests
The authors declare no competing interests.
References:
- Ahmad A, Kahler SG, Kishnani PS, Artigas-Lopez M, Pappu AS, Steiner R, Millington DS, and Van Hove JL (1999). Treatment of pyruvate carboxylase deficiency with high doses of citrate and aspartate. Am J Med Genet 87, 331–338. [DOI] [PubMed] [Google Scholar]
- Al-Sawaf O, Clarner T, Fragoulis A, Kan YW, Pufe T, Streetz K, and Wruck CJ (2015). Nrf2 in health and disease: current and future clinical implications. Clinical science (London, England : 1979) 129, 989–999. [DOI] [PubMed] [Google Scholar]
- Antoniewicz MR, Kelleher JK, and Stephanopoulos G (2007). Elementary metabolite units (EMU): a novel framework for modeling isotopic distributions. Metabolic engineering 9, 68–86. [DOI] [PMC free article] [PubMed] [Google Scholar]
- Berglund ED, Lee-Young RS, Lustig DG, Lynes SE, Donahue EP, Camacho RC, Meredith ME, Magnuson MA, Charron MJ, and Wasserman DH (2009). Hepatic energy state is regulated by glucagon receptor signaling in mice. Journal of Clinical Investigation 119, 2412–2422. [DOI] [PMC free article] [PubMed] [Google Scholar]
- Bigot A, Tchan MC, Thoreau B, Blasco H, and Maillot F (2017). Liver involvement in urea cycle disorders: a review of the literature. J Inherit Metab Dis 40, 757–769. [DOI] [PubMed] [Google Scholar]
- Bottger I, Wieland O, Brdiczka D, and Pette D (1969). Intracellular localization of pyruvate carboxylase and phosphoenolpyruvate carboxykinase in rat liver. Eur J Biochem 8, 113–119. [DOI] [PubMed] [Google Scholar]
- Breen C, White FJ, Scott CAB, Heptinstall L, Walter JH, Jones SA, and Morris AAM (2014). Unsuccessful treatment of severe pyruvate carboxylase deficiency with triheptanoin. European Journal of Pediatrics 173, 361–366. [DOI] [PubMed] [Google Scholar]
- Brosnan JT, Krebs HA, and Williamson DH (1970). Effects of ischaemia on metabolite concentrations in rat liver. The Biochemical journal 117, 91–96. [DOI] [PMC free article] [PubMed] [Google Scholar]
- Burgess SC, Hausler N, Merritt M, Jeffrey FM, Storey C, Milde A, Koshy S, Lindner J, Magnuson MA, Malloy CR, et al. (2004). Impaired tricarboxylic acid cycle activity in mouse livers lacking cytosolic phosphoenolpyruvate carboxykinase. The Journal of biological chemistry 279, 48941–48949. [DOI] [PubMed] [Google Scholar]
- Burgess SC, He T, Yan Z, Lindner J, Sherry AD, Malloy CR, Browning JD, and Magnuson MA (2007). Cytosolic phosphoenolpyruvate carboxykinase does not solely control the rate of hepatic gluconeogenesis in the intact mouse liver. Cell Metab 5, 313–320. [DOI] [PMC free article] [PubMed] [Google Scholar]
- Casetta B, Tagliacozzi D, Shushan B, and Federici G (2000). Development of a method for rapid quantitation of amino acids by liquid chromatography-tandem mass spectrometry (LC-MSMS) in plasma. Clin Chem Lab Med 38, 391–401. [DOI] [PubMed] [Google Scholar]
- Consoli A, Nurjhan N, Reilly J, Bier D, and Gerich J (1990). Mechanism of increased gluconeogenesis in noninsulin dependent diabetes mellitus. Journal of Clinical Investigation 86, 2038–2045. [DOI] [PMC free article] [PubMed] [Google Scholar]
- d’Avignon DA, Puchalska P, Ercal B, Chang Y, Martin SE, Graham MJ, Patti GJ, Han X, and Crawford PA (2018). Hepatic ketogenic insufficiency reprograms hepatic glycogen metabolism and the lipidome. JCI insight 3. [DOI] [PMC free article] [PubMed] [Google Scholar]
- Deng S, Zhang GF, Kasumov T, Roe CR, and Brunengraber H (2009). Interrelations between C4 ketogenesis, C5 ketogenesis, and anaplerosis in the perfused rat liver. The Journal of biological chemistry 284, 27799–27807. [DOI] [PMC free article] [PubMed] [Google Scholar]
- Des Rosiers C, Fernandez CA, David F, and Brunengraber H (1994). Reversibility of the mitochondrial isocitrate dehydrogenase reaction in the perfused rat liver. Evidence from isotopomer analysis of citric acid cycle intermediates. J Biol Chem 269, 27179–27182. [PubMed] [Google Scholar]
- Fisher-Wellman KH, and Neufer PD (2012). Linking mitochondrial bioenergetics to insulin resistance via redox biology. Trends in endocrinology and metabolism: TEM 23, 142–153. [DOI] [PMC free article] [PubMed] [Google Scholar]
- Garcia-Cazorla A, Rabier D, Touati G, Chadefaux-Vekemans B, Marsac C, de Lonlay P, and Saudubray JM (2006). Pyruvate carboxylase deficiency: metabolic characteristics and new neurological aspects. Annals of neurology 59, 121–127. [DOI] [PubMed] [Google Scholar]
- Granner D, Andreone T, Sasaki K, and Beale E (1983). Inhibition of transcription of the phosphoenolpyruvate carboxykinase gene by insulin. Nature 305, 549–551. [DOI] [PubMed] [Google Scholar]
- Gray LR, Sultana MR, Rauckhorst AJ, Oonthonpan L, Tompkins SC, Sharma A, Fu X, Miao R, Pewa AD, Brown KS, et al. (2015). Hepatic Mitochondrial Pyruvate Carrier 1 Is Required for Efficient Regulation of Gluconeogenesis and Whole-Body Glucose Homeostasis. Cell Metab 22, 669–681. [DOI] [PMC free article] [PubMed] [Google Scholar]
- Groen AK, Sips HJ, Vervoorn RC, and Tager JM (1982). Intracellular compartmentation and control of alanine metabolism in rat liver parenchymal cells. European journal of biochemistry / FEBS 122, 87–93. [DOI] [PubMed] [Google Scholar]
- Groen AK, van Roermund CW, Vervoorn RC, and Tager JM (1986). Control of gluconeogenesis in rat liver cells. Flux control coefficients of the enzymes in the gluconeogenic pathway in the absence and presence of glucagon. Biochemical journal 237, 379–389. [DOI] [PMC free article] [PubMed] [Google Scholar]
- Habarou F, Brassier A, Rio M, Chretien D, Monnot S, Barbier V, Barouki R, Bonnefont JP, Boddaert N, Chadefaux-Vekemans B, et al. (2015). Pyruvate carboxylase deficiency: An underestimated cause of lactic acidosis. Molecular genetics and metabolism reports 2, 25–31. [DOI] [PMC free article] [PubMed] [Google Scholar]
- Hadera MG, Smeland OB, McDonald TS, Tan KN, Sonnewald U, and Borges K (2014). Triheptanoin partially restores levels of tricarboxylic acid cycle intermediates in the mouse pilocarpine model of epilepsy. Journal of neurochemistry 129, 107–119. [DOI] [PubMed] [Google Scholar]
- Hallen A, Jamie JF, and Cooper AJ (2013). Lysine metabolism in mammalian brain: an update on the importance of recent discoveries. Amino acids 45, 1249–1272. [DOI] [PMC free article] [PubMed] [Google Scholar]
- Hanson RW, and Reshef L (1997). Regulation of phosphoenolpyruvate carboxykinase (GTP) gene expression. Annual Review of Biochemistry 66, 581–611. [DOI] [PubMed] [Google Scholar]
- Hasenour CM, Wall ML, Ridley DE, Hughey CC, James FD, Wasserman DH, and Young JD (2015). Mass spectrometry-based microassay of 2H and 13C plasma glucose labeling to quantify liver metabolic fluxes in vivo. American journal of physiology. Endocrinology and metabolism 309, E191–203. [DOI] [PMC free article] [PubMed] [Google Scholar]
- Hughey CC, Trefts E, Bracy DP, James FD, Donahue EP, and Wasserman DH (2018). Glycine N-methyltransferase deletion in mice diverts carbon flux from gluconeogenesis to pathways that utilize excess methionine cycle intermediates. The Journal of biological chemistry 293, 11944–11954. [DOI] [PMC free article] [PubMed] [Google Scholar]
- Jin ES, Jones JG, Merritt M, Burgess SC, Malloy CR, and Sherry AD (2004). Glucose production, gluconeogenesis, and hepatic tricarboxylic acid cycle fluxes measured by nuclear magnetic resonance analysis of a single glucose derivative. Analytical biochemistry 327, 149–155. [DOI] [PubMed] [Google Scholar]
- Jitrapakdee S, St Maurice M, Rayment I, Cleland WW, Wallace JC, and Attwood PV (2008). Structure, mechanism and regulation of pyruvate carboxylase. The Biochemical journal 413, 369–387. [DOI] [PMC free article] [PubMed] [Google Scholar]
- Jones JG, Solomon MA, Cole SM, Sherry AD, and Malloy CR (2001). An integrated (2)H and (13)C NMR study of gluconeogenesis and TCA cycle flux in humans. American journal of physiology. Endocrinology and metabolism 281, E848–856. [DOI] [PubMed] [Google Scholar]
- Joseph S, Heaton N, Potter D, Pernet A, Umpleby M, and Amiel S (2000). Renal glucose production compensates for the liver during the anhepatic phase of liver transplantation. Diabetes 49, 450–456. [DOI] [PubMed] [Google Scholar]
- Kamoun P, Richard V, Rabier D, and Saudubray JM (2002). Plasma lysine concentration and availability of 2-ketoglutarate in liver mitochondria. Journal of inherited metabolic disease 25, 1–6. [DOI] [PubMed] [Google Scholar]
- Keech DB, and Utter MF (1963). Pyruvate Carboxylase. li. Properties. J Biol Chem 238, 2609–2614. [PubMed] [Google Scholar]
- Kirkman HN, Rolfo M, Ferraris AM, and Gaetani GF (1999). Mechanisms of Protection of Catalase by NADPH: KINETICS AND STOICHIOMETRY. Journal of Biological Chemistry 274, 13908–13914. [DOI] [PubMed] [Google Scholar]
- Krebs HA, and Veech RL (1969). Equilibrium relations between pyridine nucleotides and adenine nucleotides and their roles in the regulation of metabolic processes. Advances in enzyme regulation 7, 397–413. [DOI] [PubMed] [Google Scholar]
- Kumashiro N, Beddow SA, Vatner DF, Majumdar SK, Cantley JL, Guebre-Egziabher F, Fat I, Guigni B, Jurczak MJ, Birkenfeld AL, et al. (2013). Targeting pyruvate carboxylase reduces gluconeogenesis and adiposity and improves insulin resistance. Diabetes 62, 2183–2194. [DOI] [PMC free article] [PubMed] [Google Scholar]
- Landau BR, Chandramouli V, Schumann WC, Ekberg K, Kumaran K, Kalhan SC, and Wahren J (1995). Estimates of Krebs cycle activity and contributions of gluconeogenesis to hepatic glucose production in fasting healthy subjects and IDDM patients. Diabetologia 38, 831–838. [DOI] [PubMed] [Google Scholar]
- Landau BR, Schumann WC, Chandramouli V, Magnusson I, Kumaran K, and Wahren J (1993). 14C-labeled propionate metabolism in vivo and estimates of hepatic gluconeogenesis relative to Krebs cycle flux. American Journal of Physiology - Endocrinology And Metabolism 265, E636–E647. [DOI] [PubMed] [Google Scholar]
- Landau BR, Wahren J, Chandramouli V, Schumann WC, Ekberg K, and Kalhan SC (1996). Contributions of gluconeogenesis to glucose production in the fasted state. J Clin Invest 98, 378–385. [DOI] [PMC free article] [PubMed] [Google Scholar]
- Laukka T, Mariani CJ, Ihantola T, Cao JZ, Hokkanen J, Kaelin WG Jr., Godley LA, and Koivunen P (2016). Fumarate and Succinate Regulate Expression of Hypoxia-inducible Genes via TET Enzymes. The Journal of biological chemistry 291, 4256–4265. [DOI] [PMC free article] [PubMed] [Google Scholar]
- Marin-Valencia I, Roe CR, and Pascual JM (2010). Pyruvate carboxylase deficiency: mechanisms, mimics and anaplerosis. Molecular genetics and metabolism 101, 9–17. [DOI] [PubMed] [Google Scholar]
- McClure WR, and Lardy HA (1971). Rat liver pyruvate carboxylase. IV. Factors affeing the regulation in vivo. J Biol Chem 246, 3591–3596. [PubMed] [Google Scholar]
- McCommis KS, Chen Z, Fu X, McDonald WG, Colca JR, Kletzien RF, Burgess SC, and Finck BN (2015). Loss of Mitochondrial Pyruvate Carrier 2 in the Liver Leads to Defects in Gluconeogenesis and Compensation via Pyruvate-Alanine Cycling. Cell Metab 22, 682–694. [DOI] [PMC free article] [PubMed] [Google Scholar]
- McCommis KS, and Finck BN (2018). Treating Hepatic Steatosis and Fibrosis by Modulating Mitochondrial Pyruvate Metabolism. Cellular and molecular gastroenterology and hepatology 7, 275–284. [DOI] [PMC free article] [PubMed] [Google Scholar]
- McCullough A, Previs S, and Kasumov T (2018). Stable isotope-based flux studies in nonalcoholic fatty liver disease. Pharmacology & therapeutics 181, 22–33. [DOI] [PMC free article] [PubMed] [Google Scholar]
- McGarry JD, and Foster DW (1980). Regulation of Hepatic Fatty Acid Oxidation and Ketone Body Production. Annual Review of Biochemistry 49, 395–420. [DOI] [PubMed] [Google Scholar]
- Millington DS, Kodo N, Norwood DL, and Roe CR (1990). Tandem mass spectrometry: a new method for acylcarnitine profiling with potential for neonatal screening for inborn errors of metabolism. J Inherit Metab Dis 13, 321–324. [DOI] [PubMed] [Google Scholar]
- Mochel F, DeLonlay P, Touati G, Brunengraber H, Kinman RP, Rabier D, Roe CR, and Saudubray JM (2005). Pyruvate carboxylase deficiency: clinical and biochemical response to anaplerotic diet therapy. Mol Genet Metab 84, 305–312. [DOI] [PubMed] [Google Scholar]
- Nye CK, Hanson RW, and Kalhan SC (2008). Glyceroneogenesis is the dominant pathway for triglyceride glycerol synthesis in vivo in the rat. J Biol Chem 283, 27565–27574. [DOI] [PMC free article] [PubMed] [Google Scholar]
- Nyhan WL, Khanna A, Barshop BA, Naviaux RK, Precht AF, Lavine JE, Hart MA, Hainline BE, Wappner RS, Nichols S, et al. (2002). Pyruvate carboxylase deficiency--insights from liver transplantation. Mol Genet Metab 77, 143–149. [DOI] [PubMed] [Google Scholar]
- Perry RJ, Borders CB, Cline GW, Zhang XM, Alves TC, Petersen KF, Rothman DL, Kibbey RG, and Shulman GI (2016). Propionate increases hepatic pyruvate cycling, anaplerosis and alters mitochondrial metabolism. The Journal of biological chemistry. [DOI] [PMC free article] [PubMed] [Google Scholar]
- Previs SF, and Kelley DE (2015). Tracer-based assessments of hepatic anaplerotic and TCA cycle flux: Practicality, stoichiometry and hidden assumptions. American journal of physiology. Endocrinology and metabolism, ajpendo 00216 02015. [DOI] [PubMed] [Google Scholar]
- Puchalska P, and Crawford PA (2017). Multi-dimensional Roles of Ketone Bodies in Fuel Metabolism, Signaling, and Therapeutics. Cell Metab 25, 262–284. [DOI] [PMC free article] [PubMed] [Google Scholar]
- Reaven GM (1988). Banting lecture 1988. Role of insulin resistance in human disease. Diabetes 37, 1595–1607. [DOI] [PubMed] [Google Scholar]
- Rebrin K, Steil GM, Mittelman SD, and Bergman RN (1996). Causal linkage between insulin suppression of lipolysis and suppression of liver glucose output in dogs. The Journal of Clinical Investigation 98, 741–749. [DOI] [PMC free article] [PubMed] [Google Scholar]
- Rogers GW, Brand MD, Petrosyan S, Ashok D, Elorza AA, Ferrick DA, and Murphy AN (2011). High throughput microplate respiratory measurements using minimal quantities of isolated mitochondria. PLoS One 6, e21746. [DOI] [PMC free article] [PubMed] [Google Scholar]
- Rognstad R (1979). Rate-limiting steps in metabolic pathways. J Biol Chem 254, 1875–1878. [PubMed] [Google Scholar]
- Salto R, Sola M, Oliver FJ, and Vargas AM (1996). Effects of starvation, diabetes and carbon tetrachloride intoxication on rat kidney cortex and liver pyruvate carboxylase levels. Arch Physiol Biochem 104, 845–850. [DOI] [PubMed] [Google Scholar]
- Satapati S, Kucejova B, Duarte JA, Fletcher JA, Reynolds L, Sunny NE, He T, Nair LA, Livingston K, Fu X, et al. (2015). Mitochondrial metabolism mediates oxidative stress and inflammation in fatty liver. J Clin Invest 125, 4447–4462. [DOI] [PMC free article] [PubMed] [Google Scholar]
- She P, Shiota M, Shelton KD, Chalkley R, Postic C, and Magnuson MA (2000). Phosphoenolpyruvate Carboxykinase Is Necessary for the Integration of Hepatic Energy Metabolism. Mol. Cell. Biol 20, 6508–6517. [DOI] [PMC free article] [PubMed] [Google Scholar]
- Silvers MA, Deja S, Singh N, Egnatchik RA, Sudderth J, Luo X, Beg MS, Burgess SC, DeBerardinis RJ, Boothman DA, et al. (2017). The NQO1 bioactivatable drug, beta-lapachone, alters the redox state of NQO1+ pancreatic cancer cells, causing perturbation in central carbon metabolism. The Journal of biological chemistry 292, 18203–18216. [DOI] [PMC free article] [PubMed] [Google Scholar]
- Skarnes WC, Rosen B, West AP, Koutsourakis M, Bushell W, Iyer V, Mujica AO, Thomas M, Harrow J, Cox T, et al. (2011). A conditional knockout resource for the genomewide study of mouse gene function. Nature 474, 337–342. [DOI] [PMC free article] [PubMed] [Google Scholar]
- Sorbi D, Boynton J, and Lindor KD (1999). The ratio of aspartate aminotransferase to alanine aminotransferase: potential value in differentiating nonalcoholic steatohepatitis from alcoholic liver disease. The American journal of gastroenterology 94, 1018–1022. [DOI] [PubMed] [Google Scholar]
- St Maurice M, Reinhardt L, Surinya KH, Attwood PV, Wallace JC, Cleland WW, and Rayment I (2007). Domain architecture of pyruvate carboxylase, a biotin-dependent multifunctional enzyme. Science 317, 1076–1079. [DOI] [PubMed] [Google Scholar]
- Tandra S, Yeh MM, Brunt EM, Vuppalanchi R, Cummings OW, Unalp-Arida A, Wilson LA, and Chalasani N (2011). Presence and significance of microvesicular steatosis in nonalcoholic fatty liver disease. J Hepatol 55, 654–659. [DOI] [PMC free article] [PubMed] [Google Scholar]
- von Glutz G, and Walter P (1976). Regulation of pyruvate carboxylation by acetyl-CoA in rat liver mitochondria. FEBS letters 72, 299–303. [DOI] [PubMed] [Google Scholar]
- Williamson JR, Kreisberg RA, and Felts PW (1966). Mechanism for the Stimulation of Gluconeogenesis by Fatty Acids in Perfused Rat Liver. Proceedings of the National Academy of Sciences of the United States of America 56, 247–254. [DOI] [PMC free article] [PubMed] [Google Scholar]
- Young JD (2014). INCA: a computational platform for isotopically non-stationary metabolic flux analysis. Bioinformatics (Oxford, England) 30, 1333–1335. [DOI] [PMC free article] [PubMed] [Google Scholar]
Associated Data
This section collects any data citations, data availability statements, or supplementary materials included in this article.