Abstract
Liver cancer stem cells (CSCs) were involved in tumorigenesis, progression, recurrence, and drug resistance of hepatocellular carcinoma (HCC). miR‐365 was downregulated in hepatocellular carcinoma and inhibited HCC cell proliferation and invasion. However, the role of miR‐365 in liver cancer stem cells was unknown. Herein, we observed a remarkable decrease of miR‐365 expression in CD133 or EpCAM‐positive liver CSCs as well as in CSC‐enriched hepatoma spheres. Up‐regulated miR‐365 suppressed liver CSC expansion by inhibiting the dedifferentiation of hepatoma cells and decreasing the self‐renewal ability of liver CSCs. Mechanistically, bioinformatic and luciferase reporter analysis identified Ras‐related C3 botulinum toxin substrate 1 (RAC1) as a direct target of miR‐365. Overexpression of miR‐365 in hepatoma cells downregulated the RAC1 mRNA and protein expression. RAC1 also could promote the expansion of liver CSCs. The special RAC1 inhibitor EHop‐106 or RAC1 overexpression abolished the discrepancy in liver CSC proportion and the self‐renewal capacity between miR‐365 overexpression hepatoma cells and control cells, which further confirmed that RAC1 was required in miR‐365‐suppressed liver CSCs expansion. miR‐365 was downregulated in liver CSCs and could inhibit HCC cells dedifferentiation and liver CSCs expansion by targeting RAC1 signaling.
Keywords: hepatocellular carcinoma, liver cancer stem cell, miR‐365, RAC1, sorafenib
1. INTRODUCTION
Hepatocellular carcinoma (HCC) is one of the most common malignancies in the world.1 It remains the sixth most common malignant tumor and the second highest cause of cancer‐related death in the world.2 According to the statistics, more than half of the new patients are in China. It is hard to diagnosis at early stage due to the unobvious symptoms, however, the metastasis and recurrence rate remains very high.3, 4 Increasing appreciation of heterogeneity and hierarchical organization in liver cancer supported the theory of liver cancer stem cells (CSCs).5, 6 Liver CSCs exhibit extended self‐renewal potential and tumor‐initiating ability.7 Tumors that harbor an abundant CSC population or have high expression of stemness‐related genes may signal a poor clinical outcome in HCC patients.8 Therefore, the underlying mechanisms of liver CSCs expansion are urgent to be clarified.
miRNAs, a small non‐coding RNA molecule (containing about 22 nucleotides), regulate RNA silencing and post‐transcriptional of gene expression in general by binding to the 3′UTR of target mRNAs.9, 10 miRNAs act as oncogenes or tumor suppressors in tumors dependent on special conditions.11, 12 miRNAs are also involved in regulating the progression of cancers and CSCs.13, 14 For instance, miR‐429 drives liver tumor‐initiating cell properties by targeting Rb binding protein 4.15
Recent studies reported that miR‐365 suppresses the proliferation and invasion of numerous tumors including breast cancer, gastric cancer, and liver cancer,16, 17, 18 suggesting that this miRNA was associated with tumor initiation and progression. For instance, miR‐365 suppressed HCC cells growth and metastasis by targeting ADAM10.19 miR‐365 also induced HCC cells apoptosis through targeting Bcl‐2.20 Development of HCC can be driven by a small heterogeneous population of tumor‐derived cancer stem cells (CSCs). Liver CSCs were participated in tumor propagation, resistance to conventional therapy, and promotion of tumor recurrence, causing poor patient outcomes. However, the regulatory role of miR‐365 in liver CSCs remains unknown.
In the present study, we for first find that miR‐365 was downregulated in liver CSCs. Next, by using gain‐of‐function analysis in HCC cells, we demonstrate that miR‐365 could inhibit the self‐renewal capacity of liver CSCs. Further mechanism study reveals that miR‐365 directly regulated RAC1 by binding with its mRNA 3′UTR. RAC1 special inhibitor EHop‐106 could abolish the self‐renewal discrepancy between miR‐365 overexpression HCC cells and control cells. We also found that miR‐365 could affect the drug resistance of HCC cells to sorafenib and cisplatin. Taken together, our study shows that miR‐365 is a novel cancer stem cell marker that plays a key role in liver CSCs expansion and drug resistance of HCC.
2. MATERIALS AND METHODS
2.1. Patients and samples
Total 100 HCC patients’ tissue samples were collected from the Gansu provincial hospital (Gansu, China). Patient informed consent was also obtained and the procedure of human sample collection was approved by the Ethic Committee of Gansu provincial hospital.
2.2. Cell lines and cell culture
HCC cell lines HCCLM3 and SMMC7721 were purchased form Chinese Academy of Sciences, Shanghai, China. The HCC cells were cultured with Dulbecco's modified Eagle's medium (DMEM) supplemented with 10% fetal bovine serum (FBS) and 2 mM l‐glutamine, and 25 μg/mL of gentamicin and maintained at 37°C in 5% CO2 incubator. The culture cells were digested with 0.5% trypsin and moved to a new plate twice a week.
The lenti‐vector expressing miR‐365 or RAC1 and their control virus were produced as described previously.21 The lentiviral vectors were purchased from Shanghai GenePharma (Shanghai, China). The lentiviral vectors were mixed with PolyJet (Polyplus, New York, NY), and then added to the cells. SMMC‐7721 and HCC‐LM3 cells were infected with miR‐365 or its control virus and the stable infectants were screened by puromycin. The miR‐365 inhibitor was also purchased from Shanghai GenePharma.
HCCLM3 or SMMC7721 cells were seeded into a six‐well plate until they reached 60‐70% confluence. Transfection of si‐STAT3 or its negative control was performed in each well in the absence of serum with siRNA transfection reagent according to the manufacturer's instructions (Polyplus, Illkirch, France). The sequence of si‐STAT3 is as follows: 5′‐CCACUUUGGUGUUUCAUAATT‐3′. The siRNA was purchased from Shanghai GenePharma.
HCCLM3 miR‐365 or SMMC7721 miR‐365 cells and their control cells were treated with 10 μM EHop‐106 (cat. no. S7319; Selleck.cn) or left untreated and then subjected to Spheroid formation or flow‐cytometric analysis.
HCCLM3 and SMMC7721 were treated with FH535 (40 nM), SIS3 (1 µM), S3I‐201 (100 µM) for 24 h and then subjected to real‐time PCR assay.
2.3. Cell proliferation assays
For cell proliferation analysis, SMMC7721 or HCCLM3 miR‐365 and their control cells were seeded in 96‐well plates (3 × 10³ cells per well). The hepatoma cells were treated with different doses sorafenib or cisplatin. ATP activity was measured using a Cell Counting Kit‐8 at indicated time points. The procedure was as follows: The cell suspension (100 µL/well) was inoculated in a 96‐well plate, and the plate was pre‐incubated in a humidified incubator at 37°C for 1 h. This was followed by the addition of 10 µL of the CCK‐8 solution to each well of the plate, and incubation of the plate for 1 h in the incubator. Finally, the absorbance was measured at 450 nm using a microplate reader (Synergy H1; BioTek Instruments, Inc., Winooski, VT).
2.4. Spheroid formation assay
SMMC7721 or HCCLM3 miR‐365 and their control cells were cultured in a 6‐ or 96‐well ultra‐low attachment culture plate for 7 days, and the total number of spheres was counted under the microscope (Olympus, Beijing, China).
2.5. Limiting dilution assay
Various numbers of SMMC7721 or HCCLM3 miR‐365 and their control cells (64, 32, 16, 8, 4, 2, cells per well) were seeded into 96‐well ultra‐low attachment culture plates for 7 days. CSC proportions were analyzed using Poisson distribution statistics and the L‐Calc Version 1.1 software program (Stem Cell Technologies, Inc., Vancouver, Canada) as described.22
2.6. Real‐time PCR
For detection of mature miR‐365, total RNA was subjected to reverse transcription using a TaqMan MicroRNA Reverse Transcription Kit (Applied Biosystems, Beijing, China). qRT‐PCR analysis of miR‐365 expression was carried out using TaqMan MicroRNA assay kits (Applied Biosystems). Results were normalized to U6 snRNA using the comparative threshold cycle (Ct) method.
The total cells RNA were extracted by using Trizol reagent (Invitrogen Thermo Fisher Scientific (Suzhou) Instruments Co., Ltd, Jiangsu, China). Total cDNAs were synthesized by ThermoScript TM RT‐PCR system (Invitrogen, 11146‐057). The total mRNA amount presented in the cells was measured by RT‐PCR using the ABI PRISM 7300 sequence detector (Applied Biosystems). The RAC1 primer sequences were forward: 5′‐GCAAACAGATGTGTTCTTAAT‐3′, reverse: 5′‐TCATCCCTAAGATCAAGTTT‐3′; CD24 primer sequences were forward: 5′‐GCAAACAGATGTGTTCTTAAT‐3′, reverse: 5′‐TCATCCCTAAGATCAAGTTT‐3′; CD133 primer sequences were forward: 5′‐ACATGAAAAGACCTGGGGG‐3′, reverse: 5′‐GATCTGGTGT CCCAGCATG‐3′; CD90 primer sequences were forward: 5′‐CGGAAGACCCCAGTCCA‐3′, reverse: 5′‐ACGAAGGCTCTGGTCCACTA‐3′; EpCAM primer sequences were forward: 5′‐CGCAGCTCAGGAAGAATGTG‐3′, reverse: 5′‐TGAAGTACACTGGCATTGACGA‐3′; NANOG primer sequences were forward: 5′‐AATACCTCAGCCTCCAGCAGATG‐3′; reverse: 5′‐TGCGTCACACCATTGCTATTCTTC‐3′; SOX‐2 primer sequences were forward: 5′‐TGGAGAAGGAATGGTCCACTTC‐3′, reverse: 5′‐GGATAAGTACACGCTGCCCG‐3′; Oct4 primer sequences were forward: 5′‐ATGTGCGCGTAACTGTCCAT‐3′; reverse: 5′‐CTGCAGTGTGGGTTTCGGGCA‐3′; c‐Myc primer sequences were forward: 5′‐CCCTCCACTCGGAAGGACTA‐3′; reverse: 5′‐GCTGGTGCATTTTCGGTTGT‐3′. The β‐actin was used as reference for relative expression calculation and its primer sequences were forward: 5′‐GGCCCAGAATGCAGTTCGCCTT‐3′, reverse: 5′‐AATGGCACCCTGCTCACGCA‐3′.
2.7. Western blotting assay
Twenty micrograms of proteins was subjected to sodium dodecyl sulfate polyacrylamide gel electrophoresis and then transferred to nitrocellulose membrane. The membrane was blocked with 5% non‐fat milk and incubated with the primary antibody overnight. The protein band, specifically bound to the primary antibody, was detected using an IRDye 800CW‐conjugated secondary antibody and LI‐COR imaging system (LI‐COR Biosciences, Lincoln, NE). The primary antibodies were STAT3 (1:1000; #9139, Cell Signaling Technology, Shanghai, China), RAC1 (1:1000; #4651, Cell Signaling Technology), β‐catenin (1:1000; #8480, Cell Signaling Technology), p‐AKT (1:1000; #4060, Cell Signaling Technology), p‐ERK (1:1000; #4370, Cell Signaling Technology), and GAPDH (1:5000; #5174, Cell Signaling Technology).
2.8. Flow‐cytometric analysis
Hepatoma cells were incubated with the primary anti‐CD133 (Cat. no. 18470‐1‐AP; Proteintech, Hubei, China) or anti‐EpCAM (Cat. no. ab8666; Abcam, Shanghai, China) for 30 min at room temperature. The cells were then subjected to flow cytometry using a MoFlo XDP cell sorter from Beckman Coulter (Indianapolis, IN) according to the manufacturer's instructions.
SMMC7721 or HCCLM3 miR‐365 and their control cells were incubated with the primary anti‐CD133 or anti‐EpCAM for 30 min at room temperature. Flow‐cytometric analysis was performed using a MoFlo XDP from Beckman Coulter according to the manufacturer's instructions.
2.9. Apoptosis assay
SMMC7721 or HCCLM3 miR‐365 and their control cells were treated with sorafenib (10 µM) or cisplatin (1 µg/mL) for 0 and 48 h, followed by staining with Annexin V and PI for 15 min at 48°C in the dark. Apoptotic cells were determined by an Annexin VFITC Apoptosis Detection Kit I (BD Pharmingen, San Diego, CA) and flow cytometer according to the manufacturer's instructions.
2.10. Luciferase reporter assay
A 1000‐bp fragment of the RAC1 3′UTR containing the conserved miR‐365‐binding sites was inserted into a luciferase reporter plasmid. The sequence was produced by PCR with primer 5′‐CGA CGC GTA GGC AAT GAT CGA TCA TGC‐3′ and the reverse primer 5′‐AGG CTC GCT GAT GTCA CAA GGT TAC CAC G‐3′. The PCR products were subcloned into the MluI and Xho I sites of pMIR‐Report vector (LQbiotech, Shanghai, China) to generate the RAC1 3′UTR luciferase reporter (RCA1‐luc). The RAC1 3′UTR mutant luciferase plasmid was just changed the potential miR‐365‐binding base sequence “GGGCAUC” to “AAAGCUU.” Then the 1000‐bp fragment of RAC1 mutant 3′UTR fragment was inserted into a luciferase reporter plasmid.
HCC cells were transfected with RAC1 WT or RAC1 mutant 3′UTR plasmids. Luciferase activity was measured using a Synergy 2 Multidetection Microplate Reader (BioTek Instruments, Inc.). Data were normalized for transfection efficiency by dividing firefly luciferase activity by Renillaluciferase activity.
2.11. Statistical analysis
GraphPad Prism (GraphPad Software, Inc. La Jolla) was used for all statistical analyses. Statistical analysis was carried out using t‐test or Bonferroni Multiple Comparisons Test: *P < 0.05. A P‐value of less than 0.05 was considered significant.
3. RESULTS
3.1. miR‐365 expression was preferentially downregulated in liver CSCs
To explore the function of miR‐365 in HCC progression, we checked miR‐365 expression by using a great amount of human HCC tissues. As shown in Figure 1A, miR‐365 expression was dramatically reduced in HCC cases compared with the paired non‐tumorous tissues.
Figure 1.
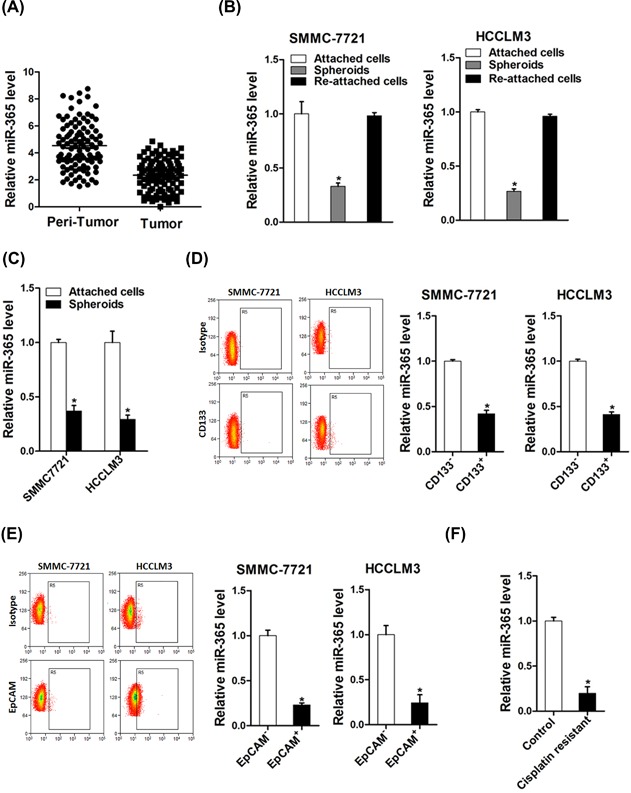
miR‐365 expression was downregulated in liver CSCs. (A) The expression of miR‐365 in 100 pairs of HCC (T) and neighboring noncancerous tissues (N) was checked by real‐time PCR analysis. (B) The expression of miR‐365 in hepatoma spheroids was performed by real‐time PCR. (C) HCCLM3 and SMMC7721 cell‐derived spheroids were trypsinized and cultured in attachment conditions. miR‐365 expression in spheroids versus reattached cells was compared by real‐time PCR. (D) The expression of miR‐365 in CD133+ subpopulation of hepatoma cells was examined by real‐time PCR. (E) The expression of miR‐365 in EpCAM+ subpopulation of hepatoma cells was examined by real‐time PCR. (F) Real‐time PCR was performed to check the expression of miR‐365 in cisplatin‐resistant HCC xenograft
Considering the close association of liver CSCs with HCC recurrence and chemoresistance, we investigated the expression of miR‐365 in liver CSCs. The expression of miR‐365 was markedly downregulated in the self‐renewing spheroids compared with the attached cells (Figure 1B). Intriguingly, miR‐365 levels could be partially restored during reattachment in parallel with the differentiation (Figure 1C). Cluster of differentiation 133 (CD133) and EpCAM are well‐accepted liver CSCs marker.23, 24 As expected, CD133+ and EpCAM+ liver CSCs sorted from trypsinized spheres of hepatoma cells displayed reduced miR‐365 expression (Figures 1D and 1E). In comparison with control tumors, miR‐365 expression was markedly decreased in the cisplatin‐resistant HCC residual, indicating that miR‐365 expression was associated with chemoresistance (Figure 1F), which further suggested that miR‐365 expression was downregulated in liver CSCs.
3.2. miR‐365 suppressed liver CSCs expansion
To further explore the role of miR‐365 in liver CSCs, miR‐365 stable overexpressing infectants of HCC cells were used (Figure 2A). Flow‐cytometric analysis revealed a decreased proportion of liver CSCs in miR‐365 stably transfected hepatoma cells (Figures 2B and 2C). Consistently, hepatoma cells overexpressing miR‐365 formed small and fewer spheroids than control cells (Figure 2D). An in vitro limiting dilution assay illustrated that miR‐365 overexpression dramatically decreased the CSC population in hepatoma cells (Figure 2E).
Figure 2.
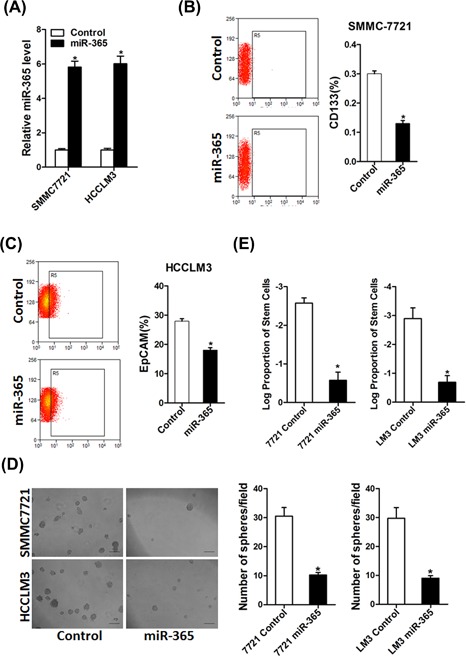
miR‐365 repressed the expansion of liver CSCs. (A) HCCLM3 and SMMC7721 cells were infected with miR‐365 overexpression virus and the sable infectants were checked by real‐time PCR. (B) Flow cytometric analysis of the proportion of CD133+ cells in miR‐365 overexpression and control 7721 cells. (C) Flow cytometric analysis of the proportion of EpCAM+ cells in miR‐365 overexpression and control LM3 cells. (D) Spheres formation assay of miR‐365 overexpression and control hepatoma cells. (E) The frequency of liver CSCs in 7721 miR‐365 or LM3 miR‐365 and their control cells was compared by in vitro limiting dilution assay
It was reported that the stem cell associated genes, including OCT4, SOX‐2 and Nanog and so on, have important roles in liver CSCs regulation.25, 26, 27 As expected, miR‐365 overexpression downregulated the expression of stemness‐associated genes (Figures 3A and 3B) and liver CSC markers in hepatoma cells (Figures 3C and 3D), which further supported that miR‐365 could inhibit liver CSCs expansion.
Figure 3.
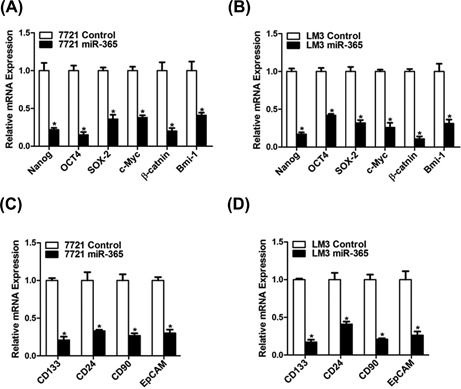
Overexpression miR‐365 downregulated stem cell associated genes. (A and B) The expression of stemness‐associated transcription genes was examined in 7721 miR‐365 or LM3 miR‐365 and their control cells by real‐time PCR. (C and D) The expression of liver CSCs surface marker was checked in miR‐365 overexpression and control hepatoma cells
3.3. miR‐365 affected the drug resistance of HCC cells to sorafenib and cisplatin
Liver CSCs were also involved in HCC chemoresistance and recurrence.28 So we next explored the role of miR‐365 in chemoresistance of HCC to sorafenib and cisplatin. As expected, we found that miR‐365 expression was downregulated in cisplatin‐resistant or sorafenib‐resistant hepatoma cells (Figures 4A and 4B), suggesting miR‐365 was involved in drug resistance. Furthermore, miR‐365 overexpression dramatically increased the sensitivity of HCC cells to the same dosages of sorafenib or cisplatin (Figures 4C and 4D). In addition, the population of apoptotic cells was also significantly increased in hepatoma cells with miR‐365 overexpression when exposed to sorafenib or cisplatin (Figure 4E). Taken together, these results demonstrated that drug sensitivity of HCC cells to sorafenib and cisplatin was significantly increased when miR‐365 was overexpressing, suggesting a possible role of miR‐365 in the treatment of HCC cells drug resistance.
Figure 4.
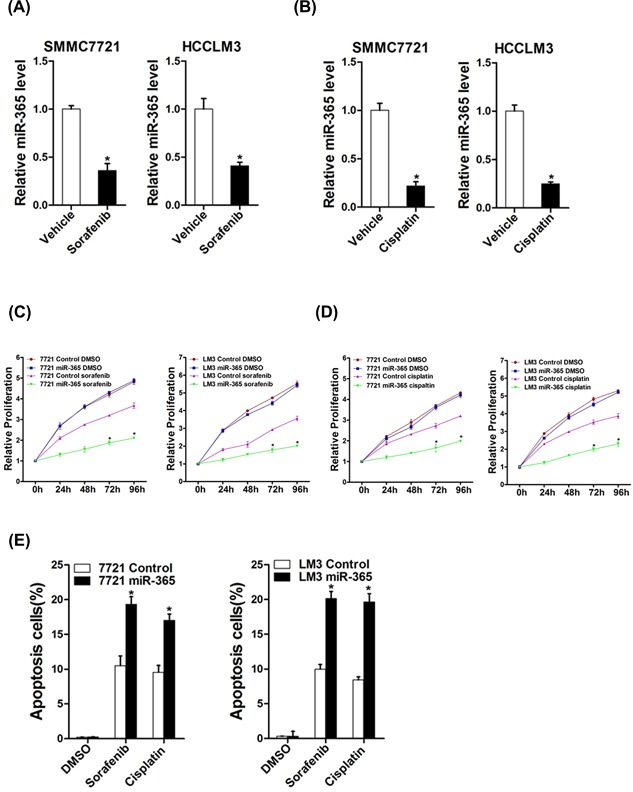
The effect of miR‐365 on drug resistance of HCC to sorafenib and cisplatin. (A) The expression of miR‐365 in sorafenib‐resistant was downregulated. (B) The expression of miR‐365 in cisplatin‐resistant was downregulated. (C) 7721 miR‐365 or LM3 miR‐365 and their control cells cultured in 96‐well plates were treated with 10 µM sorafenib, and cell viability was measured at the indicated time points using Cell Counting Kit‐8. (D) Cell proliferation of HCC cell lines with overexpressing miR‐365 compared with control cells when exposed to the same dosages of cisplatin (1 µg/mL). (E) 7721 miR‐365 or LM3 miR‐365 and their control cells were treated with different doses cisplatin or sorafenib for 24 h. Percentage of apoptotic cells was determined by fluorescence‐activated cell sorting
3.4. RAC1 was a direct target of miR‐365 in HCC cells
Next, we attempted to identify the target genes of miR‐365 that may be involved in liver CSCs expansion. Bioinformatics analysis suggested that RAC1 mRNA harbored a putative miR‐365 binding site in its 3′‐UTR (Figure 5A). To further explore whether miR‐365 directly regulates RAC1 expression via interaction with its 3′‐UTR, the wild‐type or mutant RAC1 3′‐UTR reporter plasmids were transfected into miR‐365 overexpression hepatoma cells and their control cells. The luciferase activity of wild‐type reporter was significantly inhibited in the presence of miR‐365 (Figure 5B). However, miR‐365‐mediated repression of the reporter expression was abolished by mutation of the miR‐365 binding site in the RAC1 3′‐UTR. Moreover, RAC1 mRNA expression was downregulated in miR‐365 overexpression hepatoma cells (Figure 5C). Consistently, RAC1 protein level was decreased in miR‐365 overexpression HCC cells and increased in miR‐365 inhibitor HCC cell (Figure 5D). There was a significant negative correlation between miR‐365 and RAC1 protein expression in HCC samples (r = 0.707, P < 0.001; Figure 5E). These results suggested that RAC1 was a direct target of miR‐365.
Figure 5.
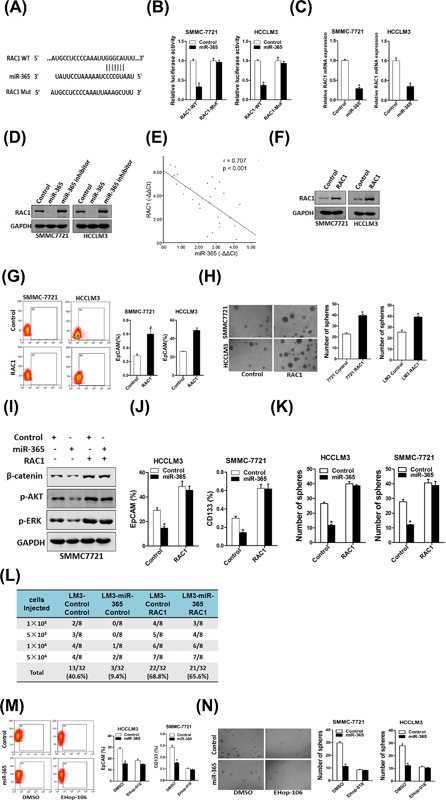
RAC1 was a direct target of miR‐365 in liver CSCs. (A) A potential target site for miR‐365 in the 3′‐UTR of human RAC1 mRNA, as predicted by the program Targetscan. To disrupt the interaction between miR‐365 and RAC1 mRNA, the target site was mutated. (B) Luciferase reporter assays performed in SMMC7721 miR‐365 or HCCLM3 miR‐365 and their control cells transfected with wild‐type or mutant RAC1 3′‐UTR constructs. (C) The mRNA expression of RAC1 was checked in SMMC7721 miR‐365 or HCCLM3 miR‐365 and their control cells by real‐time PCR. (D) The protein expression of RAC1 was checked in miR‐365 overexpression or miR‐365 inhibitor and control cells by Western blot. (E) Spearman correlation analysis of the relationship between RAC1 protein and miR‐365 expression in 30 HCC specimens. (F) HCCLM3 and SMMC7721 cells were infected with RAC1 overexpression virus and the sable infectants were checked by Western bolt assay. (G) Flow cytometric analysis of the proportion of CD133+ or EpCAM+ cells in RAC1 overexpression and control cells. (H) Spheres formation assay of RAC1 overexpression and control hepatoma cells. (I) The expression of p‐ERK, p‐AKT and β‐catenin was checked in miR‐365/RAC1 overexpression HCC cells. (J) HCCLM3 miR‐365 or SMMC7721 miR‐365 and their control cells were infected with RAC1 overexpression virus or control virus and the EpCAM+ or CD133+ hepatoma cells was checked by flow‐cytometric assay. (K) SMMC7721 miR‐365 or HCCLM3 miR‐365 and their control cells were infected with RAC1 overexpression virus or control virus and subjected to spheroid formation. (L) In vivo limiting dilution assay of indicated HCC cells. Tumors were observed over 2 months; n = 8 for each group. (M) HCCLM3 miR‐365 or SMMC7721 miR‐365 and their control cells were treated with EHop‐016 (10 µM) or not and the EpCAM+ or CD133+ hepatoma cells was checked by flow‐cytometric assay. (N) SMMC7721 miR‐365 or HCCLM3 miR‐365 and their control cells were treated with EHop‐016 (10 µM) or not and subjected to spheroid formation
Next we doubt whether RAC1 was involved in liver CSCs regulation. RAC1 stable overexpressing infectants of hepatoma cells were used (Figure 5F). Flow‐cytometric analysis revealed an increased proportion of liver CSCs in RAC1 stably transfected hepatoma cells (Figure 5G). Consistently, hepatoma cells overexpressing RAC1 formed bigger and much more spheroids than control cells (Figure 5H). The data demonstrated that RAC1 promotes liver CSCs expansion. It was reported that RAC1 regulates many signaling pathways in cancer cells including ERK, AKT, β‐catenin. We found the expression of p‐ERK, p‐AKT and β‐catenin was downregulated in miR‐365 overexpression HCC cells. The downregulation could be reversed by RAC1 overexpression (Figure 5I). Consistently, overexpressing RAC1 restored liver CSC proportion and the self‐renewal capacity in miR‐365 overexpression hepatoma cells (Figures 5J and 5K). More importantly, RAC1 overexpression revised the miR‐365‐dereased tumorigenicity of HCC cells in vivo (Figure 5L).
To further confirm the role of RAC1 in miR‐365‐mediated expansion of liver CSCs, the special RAC1 inhibitor EHop‐106 was used.29 As expected, EHop‐106 diminished the difference in liver CSC proportion between miR‐365 overexpression hepatoma cells and control cells (Figure 5M). Consistently, EHop‐106 entirely depleted the discrepancy of self‐renewal capacity between miR‐365 overexpression hepatoma cells and control cells (Figure 5N). Collectively, these data suggest distinct regulation of RAC1 by miR‐365 in liver CSCs.
3.5. JAK/STAT3 pathway was required for miR‐365 downregulation in liver CSCs
Several signaling pathway including JAK/STAT3, TGF‐β/SMAD, and β‐catenin have been reported feed into the activation of CSCs. Then HCC cells were treated with these signaling pathways special inhibitor. In present study, our data demonstrated that β‐catenin inhibitor FH535 and SMAD3 inhibitor SIS3 was not influencing miR‐365 expression in liver CSCs. However, the STAT3 inhibitor S3I‐201 could dramatically upregulate miR‐365 expression in liver CSCs (Figure 6A). We also found high activity of STAT3 in liver CSCs than in normal HCC cell lines (Figure 6B). Moreover, STAT3 siRNA increased miR‐365 expression in liver CSCs (Figures 5C and 5D). Consistently, overexpressing STAT3 also decreased miR‐365 expression in liver CSCs (Figures 5E and 5F). These results remained us that miR‐365 expression was regulated by JAK/STAT3 signaling pathway in liver CSCs. The new data have been added into the revised manuscript.
Figure 6.
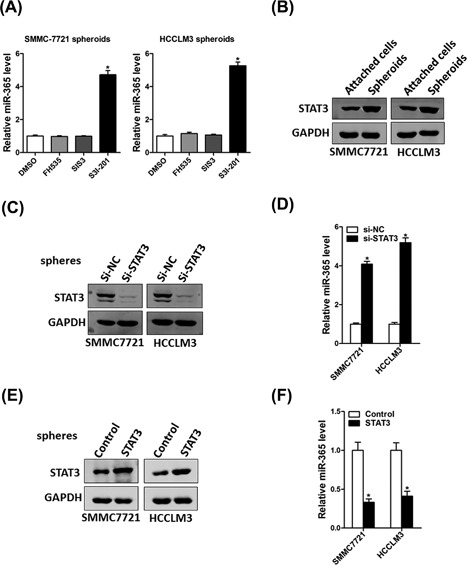
JAK/STAT3 pathway was required for miR‐365 downregulation in liver CSCs. (A) HCC cells were treated with FH535 (40 nM), SIS3 (1 µM), S3I‐201 (100 µM) for 24 h and then subjected to real‐time PCR assay. (B) The expression of STAT3 in attached cells and hepatoma spheroids determined by Western bolt assay. (C) Hepatoma cells were transfected with si‐STAT3 and si‐NC for 24 h and then performed Western bolt assay. (D) HCC cells were transfected with si‐STAT3 and si‐NC for 24 hours. The miR‐365 expression was checked by RT‐PCR. (E) Hepatoma cells were infected with STAT3 overexpression plasmid or control plasmid for 24 h and then performed Western bolt assay. (F) HCC cells were infected with STAT3 overexpression plasmid or control plasmid for 24 h. The miR‐365 expression was checked by RT‐PCR
4. DISCUSSION
Hepatocellular carcinoma (HCC) is a worldwide and lethal cancer with high incidence and recurrence.30 Only a part of HCC patients benefit from TACE or sorafenib treatment.31 Most cancer therapies fail to eradicate tumors due to the existence of CSCs.32 However, the understanding of regulatory mechanisms for CSCs is limited. In this study, we reported that miR‐365 plays a pivotal role in liver CSC expansion and may serve as a therapeutic target in personalized treatment of HCC.
Accumulating evidence shows that miRNAs were involved in the initiation and progression of human cancers,33 and may prove to be a novel marker for the diagnosis and treatment of cancers. It was reported that miR‐365 worked as a tumor suppressor gene in numerous cancers.34 miR‐365 was also played an important role in liver cancer proliferation, metastasis and apoptosis.35 However, the potential role of miR‐365 in liver CSCs has not been reported. In our above work, we found that miR‐365 overexpression by lenti‐virus inhibited liver CSCs self‐renew and dedifferentiation.
The existence of CSCs has been confirmed by numerous studies, and these cells have the ability to self‐renew and the potential for generating heterogeneous malignant progenies.36 It was accepted that liver CSCs were contributed to the chemoresistance and HCC recurrence. In the current study, liver CSCs were enriched by establishing chemoresistant HCC xenograft tumors, and expression of miR‐365 in these chemoresistant xenografts was notably down‐regulated. Considering the importance of CSCs in tumor recurrence and chemoresistance, we investigated the influence of miR‐365 on liver CSCs. Spheroid culture of cancer cells is a routine approach to enrich CSCs. We found that miR‐365 expression was downregulated in hepatoma spheroids. Our data showed that miR‐365 levels decreased in CD133+ or EpCAM+ liver CSCs. Moreover, miR‐365 overexpression in hepatoma cells inhibited the self‐renewal capacity of liver CSCs, and downregulated stemness‐associated genes and liver CSC markers. We also observed that miR‐365 overexpression HCC cells are more sensitivity to sorafenib and cisplatin treatment.
Ras‐related C3 botulinum toxin substrate 1 (RAC1) is a pleiotropic regulator of many cellular processes, including the cell cycle, cell‐cell adhesion, motility, and of epithelial differentiation.37 Recent studies showed that RAC1 worked as an oncogene in many tumors, including breast cancer, melanoma, and liver cancer.38, 39, 40 In the present study, we for the first time found that RAC1 was a direct target of miR‐365. Overexpression RAC1 also could promote the expansion of liver CSCs. Overexpressing miR‐365 in hepatoma cells downregulated RAC1 expression through binding to its 3′UTR. EHop‐016, a novel Rac inhibitor, was derived on the basis of the structure of NSC23766 and inhibited the activation of Rac with a substantially lower IC50 compared with NSC23766.41 In additional, EHop‐016 could abolish the discrepancy of the self‐renewal ability between miR‐365 overexpression hepatoma cells and their control cells, which further confirm RAC1 was the downstream of miR‐365 in regulating liver CSCs expansion.
Herein, we showed that miR‐365 was downregulated in liver CSCs, which in turn inhibited the expansion of liver CSCs. Moreover, miR‐365 inhibited liver CSCs expansion via directly regulating RAC1 in vitro and in vivo. These findings of the present study not only shed a new light on the mechanism of liver CSCs but suggest a novel prognostic marker and a potential therapeutic target against HCC.
COMPETING INTERESTS
All authors declare no competing interests.
ACKNOWLEDGMENTS
We thank Daimin Xaing for supporting the Cisplatin‐resistant HCC xenografts and cisplatin‐resistant or sorafenib‐resistant hepatoma cells samples. This work was supported by grand from National Natural Science Foundation of China 81260326.
Jiang Z‐B, Ma B‐Q, Liu S‐G, et al. miR‐365 regulates liver cancer stem cells via RAC1 pathway. Molecular Carcinogenesis. 2019;58:55–65. 10.1002/mc.22906
Bing‐Qiang Ma contributed equally to this work.
REFERENCES
- 1. Jemal A, Bray F, Center MM, Ferlay J, Ward E, Forman D. Global cancer statistics. CA Cancer J Clin. 2011; 61:69–90. [DOI] [PubMed] [Google Scholar]
- 2. El‐Serag HB. Hepatocellular carcinoma. N Engl J Med. 2011; 365:1118–1127. [DOI] [PubMed] [Google Scholar]
- 3. Forner A, Llovet JM, Bruix J. Hepatocellular carcinoma. Lancet. 2012; 379:1245–1255. [DOI] [PubMed] [Google Scholar]
- 4. Laursen L. A preventable cancer. Nature. 2014; 516:S2–S3. [DOI] [PubMed] [Google Scholar]
- 5. Sell S, Leffert HL. Liver cancer stem cells. J Clin Oncol. 2008; 26:2800–2805. [DOI] [PMC free article] [PubMed] [Google Scholar]
- 6. Li XF, Chen C, Xiang DM, et al. Chronic inflammation‐elicited liver progenitor cell conversion to liver cancer stem cell with clinical significance. Hepatology. 2017; 66:1934–1951. [DOI] [PubMed] [Google Scholar]
- 7. Xiang D, Cheng Z, Liu H, et al. Shp2 promotes liver cancer stem cell expansion by augmenting beta‐catenin signaling and predicts chemotherapeutic response of patients. Hepatology. 2017; 65:1566–1580. [DOI] [PubMed] [Google Scholar]
- 8. Bayoumi AS, Sayed A, Broskova Z, et al. Crosstalk between long noncoding RNAs and MicroRNAs in health and disease. Int J Mol Sci. 2016; 17:356. [DOI] [PMC free article] [PubMed] [Google Scholar]
- 9. DeSano JT, Xu L. MicroRNA regulation of cancer stem cells and therapeutic implications. AAPS J. 2009; 11:682–692. [DOI] [PMC free article] [PubMed] [Google Scholar]
- 10. Chen PS, Su JL, Hung MC. Dysregulation of microRNAs in cancer. J Biomed Sci. 2012; 19:90. [DOI] [PMC free article] [PubMed] [Google Scholar]
- 11. Emmrich S, Streltsov A, Schmidt F, Thangapandi VR, Reinhardt D, Klusmann JH. LincRNAs MONC and MIR100HG act as oncogenes in acute megakaryoblastic leukemia. Mol Cancer. 2014; 13:171. [DOI] [PMC free article] [PubMed] [Google Scholar]
- 12. Long M, Zhan M, Xu S, et al. MiR‐92b‐3p acts as a tumor suppressor by targeting Gabra3 in pancreatic cancer. Mol Cancer. 2017; 16:167. [DOI] [PMC free article] [PubMed] [Google Scholar]
- 13. Bao B, Azmi AS, Li Y, et al. Targeting CSCs in tumor microenvironment: the potential role of ROS‐associated miRNAs in tumor aggressiveness. Curr Stem Cell Res Ther. 2014; 9:22–35. [DOI] [PMC free article] [PubMed] [Google Scholar]
- 14. Cha SY, Choi YH, Hwang S, Jeong JY, An HJ. Clinical impact of microRNAs associated with cancer stem cells as a prognostic factor in ovarian carcinoma. J Cancer. 2017; 8:3538–3547. [DOI] [PMC free article] [PubMed] [Google Scholar]
- 15. Li L, Tang J, Zhang B, et al. Epigenetic modification of MiR‐429 promotes liver tumour‐initiating cell properties by targeting Rb binding protein 4. Gut. 2015; 64:156–167. [DOI] [PubMed] [Google Scholar]
- 16. Liu Y, Zhang G, Li H, et al. Serum microRNA‐365 in combination with its target gene TTF‐1 as a non‐invasive prognostic marker for non‐small cell lung cancer. Biomed Pharmacother. 2015; 75:185–190. [DOI] [PubMed] [Google Scholar]
- 17. Guo SL, Ye H, Teng Y, et al. Akt‐p53‐miR‐365‐cyclin D1/cdc25A axis contributes to gastric tumorigenesis induced by PTEN deficiency. Nat Commun. 2013; 4:2544. [DOI] [PMC free article] [PubMed] [Google Scholar]
- 18. Chen Z, Huang Z, Ye Q, et al. Prognostic significance and anti‐proliferation effect of microRNA‐365 in hepatocellular carcinoma. Int J Clin Exp Pathol. 2015; 8:1705–1711. [PMC free article] [PubMed] [Google Scholar]
- 19. Liu Y, Zhang W, Liu S, Liu K, Ji B, Wang Y. MiR‐365 targets ADAM10 and suppresses the cell growth and metastasis of hepatocellular carcinoma. Oncol Rep. 2017; 37:1857–1864. [DOI] [PubMed] [Google Scholar]
- 20. Li M, Yang Y, Kuang Y, et al. MiR‐365 induces hepatocellular carcinoma cell apoptosis through targeting Bcl‐2. Exp Ther Med. 2017; 13:2279–2285. [DOI] [PMC free article] [PubMed] [Google Scholar] [Retracted]
- 21. Xiang DM, Sun W, Ning BF, et al. The HLF/IL‐6/STAT3 feedforward circuit drives hepatic stellate cell activation to promote liver fibrosis. Gut. 2017; 67:1704–1715. [DOI] [PubMed] [Google Scholar]
- 22. Wu K, Ding J, Chen C, et al. Hepatic transforming growth factor beta gives rise to tumor‐initiating cells and promotes liver cancer development. Hepatology. 2012; 56:2255–2267. [DOI] [PubMed] [Google Scholar]
- 23. Yin S, Li J, Hu C, et al. CD133 positive hepatocellular carcinoma cells possess high capacity for tumorigenicity. Int J Cancer. 2007; 120:1444–1450. [DOI] [PubMed] [Google Scholar]
- 24. Yamashita T, Ji J, Budhu A, et al. EpCAM‐positive hepatocellular carcinoma cells are tumor‐initiating cells with stem/progenitor cell features. Gastroenterology. 2009; 136:1012–1024. [DOI] [PMC free article] [PubMed] [Google Scholar]
- 25. Abulaiti X, Zhang H, Wang A, et al. Phosphorylation of threonine(343) is crucial for OCT4 interaction with SOX2 in the maintenance of mouse embryonic stem cell pluripotency. Stem Cell Reports. 2017; 9:1630–1641. [DOI] [PMC free article] [PubMed] [Google Scholar]
- 26. van Schaijik B, Davis PF, Wickremesekera AC, Tan ST, Itinteang T. Subcellular localisation of the stem cell markers OCT4, SOX2, NANOG, KLF4 and c‐MYC in cancer: a review. J Clin Pathol. 2018; 71:88–91. [DOI] [PubMed] [Google Scholar]
- 27. You L, Guo X, Huang Y. Correlation of cancer stem‐cell markers OCT4, SOX2, and NANOG with clinicopathological features and prognosis in operative patients with rectal cancer. Yonsei Med J. 2018; 59:35–42. [DOI] [PMC free article] [PubMed] [Google Scholar]
- 28. Ma S, Lee TK, Zheng BJ, Chan KW, Guan XY. CD133+ HCC cancer stem cells confer chemoresistance by preferential expression of the Akt/PKB survival pathway. Oncogene. 2008; 27:1749–1758. [DOI] [PubMed] [Google Scholar]
- 29. Montalvo‐Ortiz BL, Castillo‐Pichardo L, Hernandez E, et al. Characterization of EHop‐016, novel small molecule inhibitor of Rac GTPase. J Biol Chem. 2012; 287:13228–13238. [DOI] [PMC free article] [PubMed] [Google Scholar]
- 30. Siegel R, Naishadham D, Jemal A. Cancer statistics, 2012. CA Cancer J Clin. 2012; 62:10–29. [DOI] [PubMed] [Google Scholar]
- 31. Kudo M. Systemic therapy for hepatocellular carcinoma: 2017 update. Oncology. 2017; 93:135–146. [DOI] [PubMed] [Google Scholar]
- 32. Xiao Y, Lin M, Jiang X, et al. The recent advances on liver cancer stem cells: biomarkers, separation, and therapy. Anal Cell Pathol (Amst). 2017; 2017:5108653. [DOI] [PMC free article] [PubMed] [Google Scholar]
- 33. Lim LP, Lau NC, Garrett‐Engele P, et al. Microarray analysis shows that some microRNAs downregulate large numbers of target mRNAs. Nature. 2005; 433:769–773. [DOI] [PubMed] [Google Scholar]
- 34. Xu Y, Chu H, Zhou Y, Wang J, Dong C, Yin R. MiR‐365 functions as a tumor suppressor by directly targeting CYR61 in osteosarcoma. Biomed Pharmacother. 2017; 98:531–537. [DOI] [PubMed] [Google Scholar]
- 35. Tao J, Ji J, Li X, et al. Distinct anti‐oncogenic effect of various microRNAs in different mouse models of liver cancer. Oncotarget. 2015; 6:6977–6988. [DOI] [PMC free article] [PubMed] [Google Scholar]
- 36. Qu L, Wu Z, Li Y, et al. A feed‐forward loop between lncARSR and YAP activity promotes expansion of renal tumour‐initiating cells. Nat Commun. 2016; 7:12692. [DOI] [PMC free article] [PubMed] [Google Scholar]
- 37. Didsbury J, Weber RF, Bokoch GM, Evans T, Snyderman R. Rac, a novel ras‐related family of proteins that are botulinum toxin substrates. J Biol Chem. 1989; 264:16378–16382. [PubMed] [Google Scholar]
- 38. Li S, Yan T, Deng R, et al. Low dose of kaempferol suppresses the migration and invasion of triple‐negative breast cancer cells by downregulating the activities of RhoA and Rac1. Onco Targets Ther. 2017; 10:4809–4819. [DOI] [PMC free article] [PubMed] [Google Scholar]
- 39. Araiza‐Olivera D, Feng Y, Semenova G, Prudnikova TY, Rhodes J, Chernoff J. Suppression of RAC1‐driven malignant melanoma by group A PAK inhibitors. Oncogene. 2017; 37:944–952. [DOI] [PMC free article] [PubMed] [Google Scholar]
- 40. Li J, Zhang S, Hu Q, et al. The NKD1/Rac1 feedback loop regulates the invasion and migration ability of hepatocarcinoma cells. Sci Rep. 2016; 6:26971. [DOI] [PMC free article] [PubMed] [Google Scholar]
- 41. Humphries‐Bickley T, Castillo‐Pichardo L, Corujo‐Carro F, et al. Pharmacokinetics of Rac inhibitor EHop‐016 in mice by ultra‐performance liquid chromatography tandem mass spectrometry. J Chromatogr B Analyt Technol Biomed Life Sci. 2015; 981‐982:19–26. [DOI] [PMC free article] [PubMed] [Google Scholar]


