

Abstract
Sex/gender differences in health are a function of social and biological factors, and their interplay over the life course. Despite a large body of research documenting sex/gender as a determinant of health behavior and outcomes, far less scholarship examines how these differences are reflected in physiologic function—an important mediator through which social experiences “get under the skin”—in young adulthood. Using nationally representative, longitudinal data from the National Longitudinal Study of Adolescent to Adult Health (Add Health), we examine the relationship between gender and biological function (inflammation and immunosuppression) in young adulthood. Second, we examine the contribution of social and economic circumstances in childhood and early adulthood to gender differences in health. The findings reveal strong gender differences in physiologic function, which are robust to the inclusion of many indicators of the social environment, in both inflammation and immune function.
Keywords: gender, biomarkers, life course
INTRODUCTION
Sex and gender differences in health and longevity are well established (Read and Gorman 2010; Rieker and Bird 2005). Female advantages in survival and life expectancy exist across time and place (Austad 2004). The factors that contribute to these patterns are multifaceted, but sex and gender differences in patterns of acute and chronic illnesses are pervasive (Crimmins et al. 2010). In the U.S., for example, women report higher rates of chronic illness, while men report higher rates of acute illness. Further, men are more likely to die from cardiovascular disease and cancer at younger ages, and experience greater vulnerability to illness and death once gender-differentiated social and behavioral factors are taken into account (Case and Paxson 2005). Nonetheless, while these patterns provide a logic, the underlying mechanisms remain elusive.
Sex and gender differences in health and longevity are understood to be a function of social and biological factors, and their interplay over the life course (Bird and Rieker 2002; National Research Council 2001; Yang and Kozloski 2011; Short et al. 2013). Notably, scholarship on sex and gender differentiated aging tends to focus on middle and late adulthood, when ill health and death are more frequent, rather than on the early adulthood period, a time that is formative in shaping long term health trajectories (Harris 2010). Moreover, despite a large body of research documenting the importance of sex and gender as a determinant of health behavior and health outcomes, far less scholarship examines how these differences are reflected in physiologic function, especially in young adulthood. Yet, physiologic function is an important mediator through which social experiences, such as health behaviors, may “get under the skin” with consequence for later life health.
A life course perspective leads us to expect that physiologic function in young adulthood is shaped by circumstances during childhood (Hayward and Gorman 2004; Heckman 2006; Jackson 2010; McDade et al. 2014). The adoption of behaviors begins early in life, when morbidity risk is low but when youth decide whether to initiate behaviors that “track” into adulthood, such as smoking, exercise and health-seeking behavior (e.g., Chen and Kandel 1995). While research on socioeconomic status and health has long adopted a life course perspective, research on gender and health has less systematically incorporated early life experiences, though many health behaviors and social circumstances are shaped by gender. One result is that we know little about whether we should attribute differences in health between men and women to experiences during adulthood, to the cumulative and persistent effect of earlier behaviors and circumstances, or to other factors.
Using nationally representative, longitudinal data from the National Longitudinal Study of Adolescent to Adult Health (Add Health), we have two goals. First, we examine the relationship between gender and biological function in young adulthood, considering biomarkers of inflammation and immunosuppression, two markers associated with later life morbidities. Second, we examine the contribution of social and economic circumstances in childhood and early adulthood to the size of any gender differences in health, as indicated by levels of EBV and CRP. Examining health within a cohort of young men and women in early adulthood will reveal the emergence of gender differences in both biological and clinical markers of health, as well as differences both within and across women and men according to profiles of childhood and adulthood environments. Understanding the intra-generational process by which gender specific variation in health is produced will inform our broader understanding of the emergence of gender differences in health over the life course.
BACKGROUND
Gender Differences in Health and Biological Function
Sex and gender differences in health vary across contexts and change over time. On average, for example, U.S. women live 4.8 years longer than men, down from a peak gap of 7.8 years in the late 1970s (Arias 2010). Explanations for the gender gap in health and mortality, as well as changes in the degree of the gap over time, have focused on health behaviors among adults, have revealed variation in the size of gender differences across educational groups, and have documented differences in the social and economic pressures faced by men and women (Arias 2010; Berkman 2012; Meara, Richard and Cutler 2008; Montez and Zajacova 2013; Pampel 2001), underscoring the role of social experiences in shaping sex and gender patterns of health.
At the same time, sex-specific variation in biology has promoted biologically anchored explanations for differences in health and survival (Bird and Rieker 2002; Short et al. 2013). These include differences that are tied to immune competence, which is related to reproductive biology and shaped by hormones; differences in insulin-like growth factor 1, signaling, and oxidative stress production; and genomic differences that stem from the presence of X and Y chromosomes, and processes such a cell mosaicism (Fish 2008).
Previous research indicates that disease exposure and susceptibility, immune response, and markers of inflammation vary with sex and gender (Lleo et al. 2008; Markle and Fish 2014; Ordaz and Luna 2012). The prevalence, onset, and severity of autoimmune diseases and allergic diseases provide one example. Generally, women are two to three times as likely to develop an autoimmune disease as men, but disease severity can be worse in men (Shames 2002). Research points to a role for “sex” steroids and hypothalamic-pituitary hormones in immune system development and immune response, but the associated mechanisms and models are not well- specified (Fish 2008; Shames 2002). Evidence that puberty, pregnancy, and hormonal contraceptive use are associated with variation in immune system response is well documented (Shames 2002). For example, asthma severity is affected by menstruation, pregnancy, and menopause (Shames 2002). Likewise, inflammation varies by sex and gender, with patterns indicating differences in prevalence, severity, and onset that are not well-understood (Fish 2008). Overall, data from the NHANES indicates that inflammation is higher among women than men, with the difference diminishing with age, and especially so in late adulthood (Yang and Kozloski 2011). Notably, numerous exposures shape levels, and sometimes in gender-differentiated ways. Existing research, based on clinic and population samples, claims adiposity, smoking, and sleep is related to inflammation levels differently in women and men (Cartier et al. 2009; Le-Ha et al. 2014; Miller et. al. 2009).
A Life Course Perspective
Despite a robust body of research documenting the association between gender and health among adults, limited scholarship to date examines gender differences in physiologic function at a relatively young age. While there is evidence that young women are more likely than young men to demonstrate high levels of CRP (Ishii et al. 2012; Shanahan, Freeman and Bauldry 2014), and that gender-specific HPA-axis reactivity is observed in adolescence (Oldehinkel and Bouma 2011), we know less about the extent of gender differences in young adults’ biologic function across the full distribution of risk, or about the intra-generational process by which these patterns are produced. The behaviors and health outcomes we observe among adult men and women are generated from behaviors and exposures occurring earlier in life, given ample evidence that health behaviors, as well as biomarkers of health, track from adolescence into adulthood (e.g., Chen and Kandel 1995; McDade, Williams and Snodgrass 2007).
Studying biomarkers of health is particularly useful among young adults because these measures offer insight into future disease risk among a population in which clinically defined disease is low, but predictive power for future disease prevalence is high. Life course theory emphasizes the possibility that circumstances across ages may have differing and combined effects on childhood and adulthood outcomes, pointing to the importance of the timing, duration and stability of a circumstance (Ben-Schlomo and Kuh 2002; Ferraro et al. 2009; Schoon et al. 2002). This perspective enables consideration of whether we should attribute differences between men and women to experiences during adulthood, to the cumulative and persistent effect of earlier behaviors and circumstances, or to something else.
Circumstances during Adulthood
Ample evidence documents a strong relationship between individuals’ social and economic environments and health, whether health is self-reported or defined by particular acute, chronic or disabling conditions, and a growing literature also documents the ways in which health affects social and economic processes over the life course (e.g., Kitagawa and Hauser 1973; Jackson 2015; Lynch 2003; Marmot 2001; Moore and Hayward 1990; Morenoff 2003; Palloni 2006). The gender gap in life expectancy is particularly pronounced among women with low levels of education and, relatedly, some dimensions of SES (e.g., education and employment status) are increasing across historical time in their predictive power for health, suggesting that circumstances during adulthood remain strongly linked to health (e.g., Kunst et al. 2005; Lynch 2003; Meara, Richard and Cutler 2008; Montez and Zajacova 2013; Smith et al. 2000). Studies that bridge two literatures—that on the socioeconomic determinants of health, and that on links among biological markers and morbidity/mortality—have also yielded important findings about the role of the social environment in predicting physiologic functioning among adults (e.g., McDade et al. 2014). Poverty is associated with elevated levels of C-reactive protein, an inflammatory marker related to cardiovascular disease (Alley et al. 2006; Kanjilal et al. 2006), as well as elevated blood pressure and cholesterol (Karlamangla et al. 2005). In addition, data from national health surveys (e.g., NHANES) or disease-specific surveys (e.g., CARDIA) show how biological measures of health are unequally distributed by race/ethnicity and socioeconomic indices.
Circumstances during Childhood and Adolescence
Exclusively considering adulthood circumstances, however, only partially accounts for the environments that may produce gender differences in health. Circumstances during childhood are have far-reaching effects and are key to understanding outcomes during adulthood (Hayward and Gorman 2004; Heckman 2006; Jackson 2010). There is compelling evidence that the socioeconomic “gradient” in health has origins in childhood—education is strongly related to health even before birth, and that relationship grows with age (Case, Lubotsky and Paxson 2002; Finch 2003). Similarly, behavior and mortality during adulthood are strongly predicted by childhood socioeconomic status (Duncan, Ziol-Guest and Kalil 2010; Hayward and Gorman 2004), and there is growing evidence that childhood socioeconomic status produces differences in physiologic functioning (e.g., Epstein-Barr virus and C-reactive protein) before adulthood (Dowd et al. 2014; McDade, Stallings and Worthman 2000). Whether youth decide to adopt particular behaviors also depends in part on their family socioeconomic circumstances (e.g., Duncan, Ziol-Guest and Kalil 2010). Youth in low-resource families are more likely to be exposed to unhealthy behaviors and living circumstances, less likely to pursue higher education, and more likely to experience financial instability and unemployment (Duncan, Ziol-Guest and Kalil 2010; Wagmiller et al. 2006).
Socioeconomic Pathways Linking Gender to Biological Function
Given evidence that socioeconomic circumstances during childhood, adolescence and adulthood are strongly related to health and biological function, biological risk should be greater among both men and women who experience low-resource environments during childhood and the transition to adulthood. To the extent that socioeconomic circumstances, or the meaning of such differences, at different points in the early life course are gender-differentiated, then gender differences in biological function may be partially explained by differential exposures and experiences. If women are especially likely to experience persistently low, or declining, SES environments through early adulthood, greater and/or cumulative exposure to stressful and unhealthy circumstances might contribute to gender differences in biological function.
Evidence of gender differences in exposures and socioeconomic circumstances that are plausibly linked to health is stronger among adults than among children and adolescents. For example, in the U.S., adult women on average earn lower wages than men and have lower incomes (Jacobson 2016). Occupational segregation leads women and men to experience different workplace environments (Read and Gorman 2010). Social integration, and behaviors such as smoking and exercising, vary by gender (Pampel 2001; Umberson et al. 2010; Yang et al. 2013). Men and women experience differences in family responsibilities and different forms of gender-specific harassment, both of which also shape health (Bianchi et al. 2006; Rieker 2010). Many of these patterns implicate social structures that shape health through constraining choices in gender-differentiated ways (Rieker et al. 2010).
Though there is little evidence to date, youth circumstances can also differ by gender, and such differences may well vary with family resources (Williams 2002). A growing literature, for example, demonstrates a more favorable environment for girls with respect to the development and sanctioning of social and behavioral skills. Girls are less likely than boys to exhibit aggressive behavior, as indicated by externalizing behaviors, and there is some evidence that they are less likely than boys to be penalized in school for the same problematic behaviors (DiPrete and Jennings 2012; Entwisle et al. 2007; Farkas 1990). At the same time, increasing social pressure to conform to gender expectations may reduce girls’ perceived or real opportunities as they enter adolescence, and may contribute to higher levels of depression among girls (Nolen-Hoeksema 2001; Pomeranz, Altermatt and Saxon 2002). In sum, experiences vary in gendered ways over the life course, and these experiences may reasonably be related to health and aging (Short et al. 2013). Our goal in this paper is to investigate whether gender differences in physiological function are evident among young adults, and to describe the social and demographic correlates over the life course associated with these patterns.
DATA
Our analyses are based on data from waves 1–4 of the National Longitudinal Study of Adolescent to Adult Health (Add Health), a longitudinal study of adolescents’ health and its determinants. The first wave of this nationally representative, school-based sample of about 20,000 adolescents was conducted in 1994–1995, when students were in grades 7–12, ranging in age from 11–21; mean age at the first wave is 16. Information was gathered from schools, adolescents and parents. Data collection has resulted in three subsequent waves to date: 1–2 years after baseline (1996), seven and 14 years after baseline (2001 and 2008). In line with the survey’s goal of understanding the transition into adulthood, information is collected from respondents about their health, relationships, educational experiences and labor market participation. At wave one, information about family background was also collected from parents. Add Health data are useful for this research in that they offer detailed information on socioeconomic background, behaviors, health and social and economic transitions during the period of the life course when behaviors are initiated and key transitions are made.
MEASURES
Biomarkers.
Key for this analysis is measures of inflammatory and immune functioning, available at wave four. We examine high sensitivity C-reactive protein (hsCRP) and Epstein-Barr virus (EBV) antibodies. CRP is a commonly used indicator of inflammation that is highly correlated with cardiovascular disease, type 2 diabetes, and mortality (Fahdi et al. 2003; Ridker et al. 1998). EBV is a commonly used measure of immune function. While EBV is extremely common, with approximately 90 percent of the human population estimated to be infected (Dowd et al. 2013a), the virus is usually latent unless reactivated. Higher levels of EBV antibodies indicate greater difficulty in the immune system’s ability to regulate the virus, and have been linked to diseases such as cancer, lupus, and multiple sclerosis (Esen et al. 2012; Hsu and Glaser 2000; James and Robertson 2012; Levin et al. 2010; Thompson and Kurzrock 2004). EBV antibody levels indicate reduced cell-mediated immune function and are associated with social stressors (McDade, Stallings and Worthman 2000).
In the Add Health, both CRP and EBV were measured via dried blood spot samples, and results are reported as milligrams per liter for CRP, and as arbitrary units per milliliter for EBV. Both measures have been used in previous research with Add Health data (e.g., Everett et al. 2014; McDade et al. 2014). We represent CRP and EBV using logged measures in final analyses. We considered representing CRP and EBV using sex-standardized measures, but did not find sufficient rationale in the existing literature for adopting this approach. In particular, CRP and EBV are not uniformly patterned by sex across populations. Further, a given level of CRP or EBV does not translate consistently into a clear level of risk across populations. Explanations for sex and gender differences in both patterns and risks note the complicated interaction of social, behavioral, and biological factors in producing patterns. Taken together, our overall approach is guided by a desire to impose as few assumptions as possible on the measurement of CRP and EBV. As described in more detail below, rather than computing risk thresholds that may impose arbitrary cutoffs between individuals, or constructing sex-specific measures, we examine variation across the full distribution of each measure, without sex-specific standardization, using quantile regression techniques.
Social and Demographic Characteristics.
We measure several socio-demographic variables, some of which are of primary interest and all of which are potentially correlated with both gender and biologic function. Gender is a dichotomous variable based on respondents’ identification as either male or female (reference category). Race/ethnicity distinguishes among those who identify as non-Hispanic and white (reference category), non-Hispanic and black, Hispanic, Asian, and other (including Native Americans). Respondents who identify within multiple race/ethnic categories are represented by the one that they report to best reflect their identity. Nativity status distinguishes among first-generation (immigrant, reference), second- generation (one or both immigrant parents), and third-generation (both parents U.S.-born) youth.
Childhood/Adolescent Characteristics.
Parental education is measured categorically at wave 1 through responding parents’ reports: less than high school (reference), high school completion, some college, and college diploma or higher. In the vast majority of cases (94 percent) the responding parent is the mother. We take the natural log of family income at wave 1; income coefficients can therefore be interpreted as a percentage change. Parental marital status is also measured at wave 1 and separates those whose parents are currently married from all other union statuses (reference). We use these three measures as our focal indicators of socioeconomic circumstances in childhood and adolescence.
We also control for measures of parental obesity and respondent birthweight. Parental obesity captures both genetic and environmental sources of weight and height. We combine mothers’ and fathers’ reports at wave 1 into a measure indicating whether either parent has ever been told by a doctor that he or she is obese. Birthweight is a continuous measure indicating respondents’ weight (in pounds) at birth. Finally, we include a continuous measure of age.
Early Adulthood Characteristics.
At waves three and four, we measure several important indicators of respondents’ social and economic environments. To capture socioeconomic status in early adulthood, we measure respondents’ educational attainment by wave four, differentiating some college and college-plus relative to those with a high school education or less. We measure household income at wave four with a continuous measure that uses the midpoint of each income band. A binary measure indicates whether respondents have ever been married at wave four. We measure current employment status, as well as a measure indicating how often respondents have had to reduce work hours in the past year because of family responsibilities. Finally, we measure the number of live births resulting from pregnancies up to and including wave four.
We also control for several health behaviors, including an indicator of daily smoking (yes/no) and physical activity (yes/no) at wave four. We control for obesity (yes/no) at wave four—results are not sensitive to using a three-category measure of normal weight, overweight or obesity, or to measuring BMI/overweight at wave three. Finally, we control for pregnancy status at wave 4, and test the sensitivity of the results to excluding women who are currently pregnant; we include all women because the results do not change.
Health Measures.
In all analyses, we examine the sensitivity of our results to the inclusion of measures of morbidity, in order to understand the extent to which our biomarkers are affected by preexisting and contemporaneous health. These include several wave 3 and 4 measures of health: self-rated health (on a five-point scale ranging from excellent to poor) at wave 3, and self-reports of a physician diagnosis of high blood pressure (waves ¾), high cholesterol (wave 3), and asthma (wave 3). We control for recent acute illness and infection, for whether respondents have an inflammatory disease, and for respondents’ anti-inflammatory and immune-suppression medication use at wave 4. Finally, we control for women’s use of hormonal contraception at wave four.
ANALYSIS
We use quantile regression to consider variation in the effects of gender across the observed distributions of CRP/EBV. Typical regression approaches identify group differences in the mean of the dependent variable. While this approach is often a sensible one, it assumes that the determinants of the center of a distribution are the same as those at the extremes. This assumption may lead researchers to obscure important variation among respondents, or to unnecessarily exclude cases in an effort to avoid undue influence from extreme observations. In the case of CRP levels, for example, respondents with very high levels of CRP (typically considered to be above 10 mg/L) are often excluded from analyses because of the possibility that these levels reflect acute (vs. chronic or systemic) inflammation (O’Connor et al. 2009). At the same time, however, there is evidence that high CRP levels are not just a proxy for recent illness, but that they also more strongly predict future cardiovascular and mortality risk than low levels, and that women are more likely to have very high CRP levels (e.g., Shanahan, Freeman and Bauldry 2014). These findings suggest that understanding variation in biological function across the distribution is equally important to understanding average variation. Quantile regression estimates conditional differences in the median and other quantiles (10th, 25th, 50th, 75th and 90th percentile) using least-absolute-value estimation. Differences between men and women are estimated at each percentile, given their other characteristics. For models with covariates other than gender, the gender coefficient can be interpreted as differences in CRP and EBV levels between men and women, for those with otherwise identical characteristics on observed covariates. We consider differences among women across the distribution, and between men and women at and across percentiles.
We begin with a baseline model that only includes gender, and successively incorporate childhood/adolescent, and then early adulthood characteristics. In addition to identifying gender differences in inflammation and immune function, this strategy allows us to examine the contribution of social and economic environments at different points of the early life course to gender differences observed in adulthood. We compare quantile regression estimates to those from OLS regression models that incorporate the same childhood/adolescent and early adulthood factors.
RESULTS
Establishing Differences in Biological Function
Table 1 shows weighted characteristics of the analytic sample by gender. Male and female respondents have highly equivalent sociodemographic characteristics during childhood/adolescence. About two-thirds of each group identifies as non-Hispanic white, and about 15 percent of respondents are from immigrant families, either immigrants themselves or the child of an immigrant parent (16 percent of men, 15 percent of women). Almost 25 percent of respondents lived in families with a college-educated parent (23 percent of males, 22 percent of females). By early adulthood, women are more likely to have received a college degree, at 34 percent of women vs. 28 percent of men. Women are also more likely to have ever been married by wave four (55 percent of women relative to 45 percent of men).
Table 1:
Weighted Characteristics of Sample by Gender, Add Health
| Male (49%) |
Female (51%) |
|
|---|---|---|
| Race/Ethnicity | ||
| Non-Hispanic White (ref.) | 69 | 69 |
| Hispanic | 12 | 11 |
| Black | 14 | 16 |
| Asian | 4 | 3 |
| Other | 1 | 1 |
| Nativity | ||
| First Generation (ref.) | 6 | 5 |
| Second Generation | 10 | 10 |
| Third-Plus Generation | 84 | 85 |
| Parental Education, Wave 1 | ||
| Less HS (ref.) | 16 | 17 |
| HS | 32 | 33 |
| Some College | 29 | 28 |
| College + | 23 | 22 |
| Logged Family Income, Wave 1 | 3.16 | 3.12 |
| Parents Married, Wave 1 | 73 | 73 |
| Age (years) | 30 | 29.8 |
| Education, Wave 4 | ||
| HS or less | 40 | 31 |
| Some College | 32 | 35 |
| College + | 28 | 34 |
| Ever Married, Wave 4 | 45 | 55 |
| Employed Part or Full-Time, Wave 4 | 86 | 67 |
| Work Hours Affected by Family Duties, Wave 4 | ||
| Frequently | 3 | 9 |
| Sometimes | 15 | 20 |
| Rarely | 23 | 19 |
| Never | 60 | 52 |
| Health | ||
| CRP (mg/L) | 3.3 | 6.2 |
| EBV (AU/L) | 138.4 | 164.2 |
| Parent Obese, Wave 1 | 23 | 24 |
| Birthweight | 7.75 | 7.47 |
| Smoke Daily, Wave 4 | 28 | 22 |
| Exercise Daily, Wave 4 | 13 | 17 |
| Obese, Wave 4 | 37 | 36 |
| Self-Rated Health, Wave 3 | 1.9 | 2.1 |
| Asthma, Wave 3 | 15 | 18 |
| High Blood Pressure, Wave 3 | 5 | 7 |
| High Cholesterol, Wave 3 | 4 | 4 |
| N | 6,451 | 6,715 |
Male and female respondents also experience generally similar early health environments, with almost 25 percent of respondents having an obese parent at baseline, and with mean birthweight about 7.5 pounds (7.75 for men, 7.47 for women). By wave three, young women are slightly more likely to have been diagnosed by a doctor with high blood pressure and asthma. By wave four, men and women are equally likely to be obese (37 percent vs. 36 percent), and women are slightly less likely to be regular smokers than men (22 percent vs. 28 percent). Despite their shared environments with respect to parental circumstances and sociodemographic characteristics, women have higher measured CRP and EBV levels at wave four. Mean CRP is 3.3 for men and 6.3 for women, while mean EBV is 138.4 for men and 164.2 for women. These descriptive patterns suggest that, by early adulthood (approximately age 30), women in Add Health demonstrate more inflammation and lower immune function than their male peers.
Table 2 shows results from an OLS regression of logged CRP and EBV (respectively) on gender and the other covariates. Net of respondents’ childhood/adolescent and early adulthood social, economic and health environments, men and women have significantly different levels of inflammation and immune function in young adulthood. Levels of CRP in men are over 50 percent lower than among women, and EBV levels are 19 percent lower among men. Higher levels of CRP in women as compared to men is consistent with other examinations at of the Add Health, as well as MESA and NHANES (Lakoski et al. 2006; Yang and Kozloski 2011), but this pattern is not found universally across populations (Oksuzyan et al. 2015). Similarly, EBV is higher in women than men in analyses of the NHANES (ages 6–19), and a national population- based sample in Taiwan (Chen et al. 2015; Dowd et al. 2013), and in heterosexual respondents in the Add Health, but analyses of gay and bisexual respondents in the Add Health find little evidence of difference between and men and women (Everett et al. 2014).
Table 2:
OLS Regression of Logged CRP (mg/L) and EBV (AU/L), Add Health
| Log CRP | Log EBV | |
|---|---|---|
| Male | −0.524*** | −0.190*** |
| (−21.58) | (−14.52) | |
| Race/Ethnicity | ||
| Hispanic | 0.131** | 0.0786*** |
| (3.25) | (3.62) | |
| Black | −0.00982 | 0.200*** |
| (−0.31) | (11.61) | |
| Asian | −0.313*** | 0.0448 |
| (−5.69) | (1.52) | |
| Other Race | −0.129 | 0.133 |
| (−1.01) | (1.93) | |
| Nativity | ||
| Second Generation | 0.00164 | 0.0504 |
| (0.03) | (1.74) | |
| Third-Plus Generation | 0.0520 | 0.0525 |
| (0.96) | (1.80) | |
| Parental Education | ||
| High School | −0.0591 | −0.0190 |
| (−1.60) | (−0.95) | |
| Some College | −0.115** | −0.0266 |
| (−3.03) | (−1.30) | |
| College + | −0.139*** | −0.0718** |
| (−3.34) | (−3.21) | |
| Logged Family Income | −0.00104 | 0.0109*** |
| (−0.18) | (3.48) | |
| Parent Obese | 0.137*** | 0.0228 |
| (4.90) | (1.51) | |
| Birth Weight | −0.0328*** | 0.00212 |
| (−4.00) | (0.48) | |
| Parents Married | −0.0116 | −0.0192 |
| (−0.43) | (−1.31) | |
| Age (Wave 1) | −0.000455 | 0.0118** |
| (−0.07) | (3.16) | |
| Obese, Wave 4 | 0.157*** | 0 |
| (21.63) | (0.03) | |
| Smoke Daily, Wave 4 | −0.0325 | 0.0569*** |
| (−1.10) | (3.56) | |
| Exercise Daily, Wave 4 | 0.182*** | −0.0111 |
| (5.66) | (−0.64) | |
| Ever Married, Wave 4 | 0.0772** | 0.0450*** |
| (3.15) | (3.41) | |
| Some College, Wave 4 | −0.0583* | −0.0321* |
| (−2.03) | (−2.07) | |
| College +, Wave 4 | −0.133*** | −0.0159 |
| (−4.38) | (−0.98) | |
| Household Income, Wave 4 | 8.81e-08 | 2.89e-08 |
| (1.73) | (1.05) | |
| Employed Part/Full Time | −0.0828* | −0.0204 |
| (−2.09) | (−0.98) | |
| Work/Family Conflict | −0.00185 | −0.0045 |
| (−0.11) | (−0.49) | |
| Constant | 0.908*** | 4.569*** |
| (6.24) | (58.38) | |
| N | 13166 | 13238 |
Models also control for pregnancy status at wave 4, and parity at wave 4.
p<0.05
p<0.01
p<0.00
Consistent with previous research, the findings also reveal higher CRP levels among Hispanic respondents. Compared to non-Hispanic whites, CRP levels are 13 percent higher among Hispanics, while EBV levels are 8 percent higher among Hispanics and 20 percent higher among blacks. Asian respondents have CRP levels that are 31 percent lower than among non-Hispanic whites, on average, with no difference observed for EBV levels. After controlling for socioeconomic factors, there are no significant nativity-based differences in CRP and EBV. With respect to education, there is an educational gradient in CRP and EBV, whereby respondents with college-educated parents have 13 percent lower CRP levels and 7 percent lower EBV levels, on average, than their peers from the most poorly educated families. By early adulthood, respondents who attain a college education experience a similarly lower risk of inflammation, with a 13 percent difference between college-educated respondents than their peers with a high school education or less. There is also a “disadvantage” associated with marriage, on average, whereby respondents who have ever been married by wave four have CRP levels that are 7 percent higher, and EBV levels that are 5 percent higher, than their peers.
Finally, respondents’ family health environments and early health characteristics are associated with inflammation—respondents with an obese parent have 13 percent higher CRP levels and 3 percent higher EBV levels, on average, while each additional pound at birth is associated with a 3 percent decrease in CRP in adulthood. In general, the covariates are more consistently and strongly associated with inflammation than with immune function, though there is certainly evidence of meaningful gender differences in immune function.
Gender Differences in Biological Function across the Distribution
The results from OLS analyses establish gender differences in biological function at the center of the distribution. This approach establishes a useful benchmark against which to examine variation across the distribution of CRP and EBV. Given evidence that young adult women are more likely than men to have very high levels of CRP, and that it is common to exclude such cases from analyses despite their strong relationship with future morbidity and mortality, it is important to understand the degree of risk at extreme values of the distribution.
Table 3 shows results from the quantile regression of CRP on gender and the other covariates. The results show that, for those with identical observed characteristics, the size of gender differences in inflammation increases significantly across the distribution. Model 1, which shows the bivariate relationship between gender and CRP, shows that men at the 10th percentile have CRP levels that are approximately 17 percent lower than women, and that this difference rises to 36 percent at the 25th percentile, 60 percent at the median, 66 percent at the 75th percentile, and 69 percent at the 90th percentile. Coefficient equality tests across percentiles show that these differences are significant at the 0.01 level. Results for EBV, shown in Table 4, are somewhat different. There is no evidence of a monotonic gradient—instead, gender differences are most pronounced in the middle of the distribution, with women at the median having EBV levels about 21 percent lower than their similar male peers. The size of the gender difference is 16 percent at the 10th percentile, and 16 percent at the 95th percentile.
Table 3:
Quantile Regression of Logged CRP (mg/L) on Gender, Add Health
| Percentile |
|||||||||||||||
|---|---|---|---|---|---|---|---|---|---|---|---|---|---|---|---|
| 0.1 | 0.25 | 0.5 | 0.75 | 0.9 | |||||||||||
| (1) | (2) | (3) | (1) | (2) | (3) | (1) | (2) | (3) | (1) | (2) | (3) | (1) | (2) | (3) | |
| Male | −0.190*** | −0.173*** | −0.214*** | −0.358*** | −0.354*** | −0.444*** | −0.616*** | −0.573*** | −0.606*** | −0.674*** | −0.645*** | −0.663*** | −0.695*** | −0.694*** | −0.695*** |
|
Race/Ethnicity |
(−6.95) | (−4.14) | (−4.27) | (−16.39) | (−11.25) | (−11.28) | (−27.20) | (−20.27) | (−17.44) | (−21.08) | (−21.10) | (−19.12) | (−24.94) | (−21.75) | (−12.49) |
| Hispanic | 0.201*** | 0.133* | 0.269*** | 0.127* | 0.247*** | 0.131* | 0.215*** | 0.162*** | 0.193*** | 0.159* | |||||
| (3.53) | (1.99) | (3.87) | (2.31) | (5.00) | (2.17) | (4.58) | (3.52) | (3.68) | (2.07) | ||||||
| Black | −0.0725 | −0.137** | 0.00530 | −0.0627 | 0.110** | 0.0177 | 0.154*** | 0.0430 | 0.192*** | 0.0865 | |||||
| (−1.74) | (−2.68) | (0.13) | (−1.18) | (2.60) | (0.50) | (3.75) | (0.79) | (6.26) | (1.81) | ||||||
| Asian | −0.329*** | −0.303*** | −0.319*** | −0.338*** | −0.272*** | −0.304*** | −0.182** | −0.266** | −0.204 | −0.334*** | |||||
| (−3.71) | (−4.72) | (−4.44) | (−3.94) | (−4.95) | (−3.86) | (−2.76) | (−3.02) | (−1.82) | (−4.63) | ||||||
| Other Race | 0.118 | 0.123 | 0.379* | 0.0509 | 0.402* | 0.268 | 0.505*** | 0.532*** | 0.605*** | 0.369* | |||||
|
Nativity |
(0.94) | (0.57) | (2.03) | (0.31) | (2.40) | (1.82) | (5.81) | (4.53) | (4.71) | (2.04) | |||||
| Second Gen. | −0.0190 | −0.0468 | 0.179** | 0.0335 | 0.159* | −0.0163 | 0.145** | −0.0121 | 0.0648 | −0.0670 | |||||
| (−0.31) | (−0.60) | (2.89) | (0.40) | (2.46) | (−0.23) | (2.65) | (−0.17) | (1.01) | (−0.77) | ||||||
| Third-Plus Gen. | 0.0620 | 0.0199 | 0.223*** | 0.0706 | 0.213*** | −0.0289 | 0.244*** | 0.101 | 0.184* | 0.0166 | |||||
|
Parental Education |
(1.20) | (0.26) | (3.29) | (0.93) | (4.06) | (−0.49) | (5.99) | (1.25) | (2.02) | (0.17) | |||||
| High School | −0.104* | −0.0800 | −0.189*** | −0.0904 | −0.148*** | −0.0573 | −0.119** | −0.0583 | −0.0812 | −0.0142 | |||||
| (−2.09) | (−1.15) | (−5.29) | (−1.59) | (−3.67) | (−1.28) | (−2.76) | (−1.48) | (−1.59) | (−0.29) | ||||||
| Some College | −0.148** | −0.143* | −0.284*** | −0.152** | −0.271*** | −0.151** | −0.240*** | −0.128** | −0.133 | −0.0215 | |||||
| (−2.97) | (−2.07) | (−4.26) | (−3.02) | (−5.29) | (−3.14) | (−4.35) | (−2.77) | (−1.87) | (−0.31) | ||||||
| College + | −0.263*** | −0.147* | −0.387*** | −0.136 | −0.403*** | −0.149* | −0.332*** | −0.144*** | −0.229*** | −0.0558 | |||||
| (−4.98) | (−1.99) | (−7.94) | (−1.84) | (−11.04) | (−2.56) | (−6.40) | (−3.60) | (−3.44) | (−0.75) | ||||||
| Logged Family Income | −0.00207 | −0.00780 | 0.000830 | −0.00465 | −0.000617 | 0.00101 | −0.00670 | −0.000577 | 0.00247 | 0.0112 | |||||
| (−0.34) | (−0.96) | (0.15) | (−0.47) | (−0.08) | (0.13) | (−0.93) | (−0.06) | (0.33) | (1.24) | ||||||
| Parents Married | −0.0485 | −0.0127 | −0.0246 | −0.0483 | −0.0345 | −0.0129 | −0.00435 | 0.00748 | −0.00452 | 0.0116 | |||||
| (−1.38) | (−0.29) | (−0.74) | (−1.29) | (−1.19) | (−0.46) | (−0.12) | (0.31) | (−0.13) | (0.35) | ||||||
| Ever Married, Wave 4 | 0.0520 | 0.0658* | 0.103** | 0.0706* | 0.0614* | ||||||||||
| (1.55) | (2.02) | (2.87) | (2.12) | (1.98) | |||||||||||
| Some College, Wave 4 | 0.0478 | −0.0243 | −0.0583 | −0.0819* | −0.112 | ||||||||||
| (0.98) | (−0.54) | (−1.83) | (−2.36) | (−1.86) | |||||||||||
| College +, Wave 4 | −0.162** | −0.204*** | −0.157*** | −0.0931** | −0.0954 | ||||||||||
| (−3.17) | (−4.93) | (−4.01) | (−2.62) | (−1.74) | |||||||||||
| Household Inc., Wave 4 | 7.88e-08 | 6.70e-08 | 0.000000141* | 0.000000172** | 1.78e-08 | ||||||||||
| (0.85) | (0.67) | (2.16) | (2.89) | (0.30) | |||||||||||
| Employed Part/Full Time | −0.0421 | −0.172* | −0.0859 | −0.117 | −0.0190 | ||||||||||
| (−0.69) | (−2.19) | (−1.36) | (−1.84) | (−0.25) | |||||||||||
| Work/Family Conflict | −0.0229 | 0.0212 | 0.00342 | −0.017 | −0.0198 | ||||||||||
| (−0.60) | −0.8 | −0.12 | (−0.64) | (−0.62) | |||||||||||
| Constant | −0.949*** | −1.174*** | −0.778*** | −0.0471* | −0.413 | 0.0558 | 1.066*** | 0.762*** | 0.903*** | 2.003*** | 1.650*** | 2.051*** | 2.729*** | 2.428*** | 2.615*** |
| (−45.07) | (−5.17) | (−3.53) | (−2.07) | (−1.94) | (0.25) | (45.27) | (5.32) | (4.73) | (105.83) | (7.21) | (10.17) | (116.94) | (8.47) | (10.81) | |
| N | 13600 | 13600 | 11359 | ||||||||||||
Models also control for measures listed in Table 1, pregnancy status at wave 4, and parity at wave 4 t statistics in parentheses
p<0.05
p<0.01
p<0.001”
Table 4:
Quantile Regression of Logged EBV (AU/L) on Gender, Add Health
| Percentile | |||||||||||||||
|---|---|---|---|---|---|---|---|---|---|---|---|---|---|---|---|
| 0.1 | 0.25 | 0.5 | 0.75 | 0.9 | |||||||||||
| (1) | (2) | (3) | (1) | (2) | (3) | (1) | (2) | (3) | (1) | (2) | (3) | (1) | (2) | (3) | |
| Male | −0.164*** | −0.176*** | −0.180*** | −0.209*** | −0.199*** | −0.197*** | −0.211*** | −0.207*** | −0.218*** | −0.169*** | −0.172*** | −0.184*** | −0.158*** | −0.135*** | −0.157*** |
| Race/Ethnicity | (−5.26) | (−7.54) | (−6.17) | (−7.58) | (−12.01) | (−11.45) | (−9.06) | (−11.80) | (−11.45) | (−8.36) | (−12.30) | (−15.31) | (−9.32) | (−7.65) | (−12.13) |
| Hispanic | 0.161*** | 0.197*** | 0.0929*** | 0.124*** | 0.0361 | 0.0620 | 0.0736* | 0.0576* | 0.0220 | 0.00382 | |||||
| (4.22) | (6.67) | (4.73) | (4.38) | (1.25) | (1.87) | (2.17) | (1.98) | (0.68) | (0.11) | ||||||
| Black | 0.219*** | 0.248*** | 0.244*** | 0.254*** | 0.213*** | 0.198*** | 0.182*** | 0.156*** | 0.197*** | 0.175*** | |||||
| (8.04) | (7.38) | (9.74) | (10.93) | (15.19) | (9.77) | (11.09) | (6.92) | (9.86) | (5.09) | ||||||
| Asian | 0.145* | 0.203*** | 0.0229 | 0.0688 | −0.0264 | 0.00500 | 0.0205 | 0.0110 | 0.0536 | 0.0350 | |||||
| (2.51) | (4.38) | (0.79) | (1.84) | (−0.59) | (0.09) | (0.59) | (0.24) | (1.40) | (1.27) | ||||||
| Other | 0.0994 | 0.0997 | −0.000739 | −0.0895 | 0.0798 | 0.0536 | −0.0190 | 0.00478 | −0.0655 | −0.0160 | |||||
| Nativity | (1.46) | (1.64) | (−0.01) | (−1.01) | (1.03) | (0.73) | (−0.48) | (0.07) | (−0.90) | (−0.26) | |||||
| Second Gen. | 0.0152 | 0.0563 | 0.0819 | 0.0792 | 0.0531 | 0.0792 | 0.0644 | 0.0607 | 0.0142 | −0.0315 | |||||
| (0.26) | (1.31) | (1.89) | (1.91) | (1.31) | (1.53) | (1.80) | (1.23) | (0.48) | (−0.65) | ||||||
| Third-Plus Gen. | 0.0534 | 0.105* | 0.0879* | 0.113* | 0.0445 | 0.0922 | 0.0417 | 0.0306 | −0.00744 | −0.0520 | |||||
| Parental Education | (1.09) | (2.34) | (2.47) | (2.50) | (1.45) | (1.71) | (1.46) | (0.75) | (−0.25) | (−1.03) | |||||
| High School | 0.0127 | −0.00129 | −0.0333 | −0.0156 | −0.0370 | −0.0287 | 0.0133 | 0.00392 | −0.0263 | −0.0255 | |||||
| (0.40) | (−0.03) | (−1.14) | (−0.52) | (−1.48) | (−0.92) | (0.66) | (0.23) | (−1.26) | (−0.88) | ||||||
| Some College | 0.0268 | 0.0269 | −0.0351 | −0.0153 | −0.0379 | −0.0367 | −0.00181 | −0.00905 | −0.0567* | −0.0499* | |||||
| (0.86) | (0.65) | (−1.25) | (−0.46) | (−1.82) | (−1.22) | (−0.10) | (−0.42) | (−2.17) | (−1.97) | ||||||
| College + | −0.0867** | −0.0795 | −0.104** | −0.0832* | −0.0978*** | −0.0899** | −0.0593* | −0.0589* | −0.102** | −0.0869*** | |||||
| (−2.85) | (−1.93) | (−3.27) | (−2.00) | (−4.25) | (−2.79) | (−2.42) | (−2.26) | (−2.79) | (−3.57) | ||||||
| Logged Family Income | 0.0133* | 0.0170 | 0.0148*** | 0.0149** | 0.00607 | 0.00755 | 0.00133 | 0.00530 | 0.00659* | 0.00852 | |||||
| (2.00) | (1.77) | (4.44) | (2.63) | (1.46) | (1.50) | (0.26) | (0.86) | (2.55) | (1.95) | ||||||
| Parents Married | −0.0134 | 0.00155 | −0.0172 | −0.0165 | 0.00113 | −0.00721 | −0.00540 | −0.0361* | −0.0266 | −0.0433* | |||||
| (−0.51) | (0.05) | (−0.75) | (−0.69) | (0.06) | (−0.31) | (−0.25) | (−2.25) | (−1.26) | (−2.24) | ||||||
| Ever Married, Wave 4 | 0.127*** | 0.0781*** | 0.0317 | 0.0189 | 0.00252 | ||||||||||
| (4.20) | (3.31) | (1.79) | (0.95) | (0.15) | |||||||||||
| Some College, Wave 4 | 0.00445 | −0.0113 | −0.0437 | −0.0492* | −0.0388 | ||||||||||
| (0.19) | (−0.74) | (−1.62) | (−2.27) | (−1.70) | |||||||||||
| College +, Wave 4 | −0.0451* | −0.00775 | 0.0123 | −0.00428 | −0.0151 | ||||||||||
| (−1.96) | (−0.33) | (0.63) | (−0.20) | (−0.74) | |||||||||||
| Household Inc., Wave 4 | 9.29e-08 | 8.82e-08* | 2.73e-08 | 1.74e-08 | −1.96e-08 | ||||||||||
| (1.83) | (2.10) | (0.98) | (0.50) | (−0.48) | |||||||||||
| Employed Part/Full Time | −0.0139 | 0.0185 | 0.0067 | −0.052* | −0.0486 | ||||||||||
| (−0.33) | (0.64) | (0.34) | (−2.27) | (−1.40) | |||||||||||
| Work/Family Conflict | −0.0128 | 0.0129 | −0.0017 | −0.0245* | −0.0036 | ||||||||||
| Constant | 3.970*** | 3.302*** | (−0.78)3.217*** | 4.443*** | 3.916*** | (0.60)3.935*** | 4.956*** | 4.593*** | (−.20)4.526*** | 5.389*** | 5.080*** | (−2.50)5.167*** | ****** | 5.615*** | (−0.27)5.736*** |
| (169.27) | (24.46) | (24.21) | (237.19) | (34.20) | (38.71) | (520.53) | (41.91) | (37.75) | (482.49) | (49.22) | (56.21) | (443.19) | (48.30) | (49.86) | |
| N | 13679 | 13679 | 11428 | ||||||||||||
Models also control for measures listed in Table 1, pregnancy status at wave 4, and parity at wave 4 t statistics in parentheses
p<0.05
p<0.01
p<0.001”
Exploring the contribution of childhood/adolescent and early adulthood factors in explaining gender differences in CRP and EBV reveals differences that are quite robust. After controlling for demographic factors and for variation in earlier-life circumstances such as parental education, family income, and family structure, the magnitude and significance of gender differences in both biomarkers are essentially identical. Similarly, controlling for variation in early adulthood characteristics—health behaviors, educational attainment and family formation—does not reduce, and in some cases slightly increases, gender differences. This pattern is similar across both outcomes and across the distribution, suggesting that variation in the socioeconomic environments of young adult men and women is not sufficiently large—at least among the overall population—to contribute meaningfully to pronounced differences in biological function.
Tables 3 and 4 also show the extent to which the relationship between other social categories and biomarkers is explained by differences circumstances over the early life course, and whether patterns vary across the distribution. While differences between Hispanic and non-Hispanic white respondents, and between Asians and non-Hispanic whites, are similarly robust to the inclusion of socioeconomic and health measures, black-white differences in CRP (but not EBV) are more substantially reduced by the inclusion of early adulthood circumstances, especially at higher points in the distribution. Early adulthood characteristics also go further in explaining the relationship between high parental education (college or more) and inflammation than for immune function. Finally, there are pronounced differences in inflammation according to respondents’ own education, with lower levels of inflammation (but not immune function) among college-educated respondents, especially at lower levels of the distribution.
Figures 1 and 2 visualize gender differences in CRP and EBV, respectively. The x-axis on each graph is the percentile and the y-axis is the coefficient size. Each graph, therefore, shows the degree of gender differences in CRP/EBV at different percentiles. The line with shading around it is the gender coefficient from the quantile regression (from the full model, Model 3) at a particular percentile, while the grey shading graphs the 90 percent confidence interval. The dark horizontal line shows the OLS regression coefficient from the CRP or EBV regression, respectively. The figures confirm the findings displayed in Tables 3 and 4, and show that gender differences at the extremes of the distribution vary from those at the mean. This variation is especially pronounced for the case of inflammation. That these differences are so large at a young age is striking, given evidence that those with high levels of CRP have significantly higher risk for cardiovascular disease and premature mortality.
Figure 1:
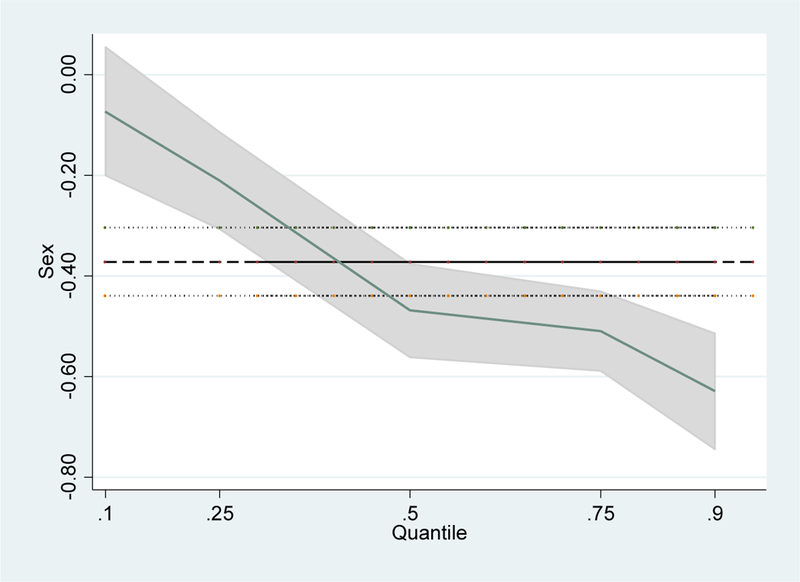
Gender Coefficient for CRP across the Distribution
Figure 2:

Gender Coefficient for EBV across the Distribution
Sensitivity Analyses
We conduct several additional analyses to test the sensitivity of our results to sample restrictions. First, we limit CRP analyses to those with levels at or below 10 mg/L. Because results are nearly identical, we retain these observations in final models. Second, we limit EBV analyses to those who are seropositive, in order to prevent seronegative respondents from biasing coefficients, given evidence that seropositivity is predicted by sociodemographic factors. We use Dowd et al.’s (2013b) method of establishing seronegativity as the bottom 10 percent of continuous EBV antibody values. Coefficients are nearly identical, so we retain seronegative respondents. Finally, we estimate sibling fixed effects models in order to better control for childhood family environments among siblings. These models, which are identified from siblings who differ in gender, also show a significant gender gap in inflammation and immune function. These results suggest that results from quantile regression analyses are not unduly biased by unmeasured childhood circumstances that are shared by siblings.
DISCUSSION
We use nationally representative, longitudinal data from the National Longitudinal Study of Adolescent Health (Add Health) to better understand the relationship between gender and biological function in young adulthood, and to begin to consider the extent to which social and economic circumstances in childhood, adolescence and young adulthood contribute to differences between men and women. We focus on biologic function—specifically, inflammation and immune function—because their predictive power for future disease risk is high, and because there is a relative lack of research on gender differences in physiologic risk at young ages.
Results from OLS and quantile regression reveal strong gender differences in both inflammation and immune function among this sample of young adults. While OLS results offer a useful benchmark, examining variation across the distribution reveals that women are disproportionately disadvantaged relative to their male peers at the top of the distribution. In the case of immune function, gender differences are most pronounced in the middle of the distribution, though women have also lower immune function than their male peers at both extremes. These results suggest that gender differences in physiologic function appear relatively early in the life course, and that substantial differences exist in the early part of individuals’ adult trajectories. Considering the contribution of childhood/adolescent and early adulthood circumstances—including demographic factors, family socioeconomic background, health behaviors, and respondents’ own family formation and socioeconomic attainment—to the magnitude and significance of gender differences yields little evidence of a strong explanatory role for these factors.
Our findings, particularly for the robustness of gender differences in biological function to the inclusion of many indicators of the social environment in our model, inform the debate about how gender differences in health over the life course reflect biological and social differences. Biological explanations for gender differences in health and mortality are well-established, as is evidence for variation in the social and economic environments of young adult men and women. By measuring the individual and family-level circumstances and behaviors that may give rise to gender differences in health, our analysis provides a more comprehensive test of the importance of social and economic factors over the life course in explaining gender differences observed in early adulthood. The stability of gender differences in the presence of these factors suggests, at minimum, that variation in the social and economic environments of young men and women in the U.S.—at least among the overall population—is not sufficiently large to produce the pronounced differences in biological function that are observed by early adulthood.
While we do not find evidence for a primary role of early life social environments in explaining gender differences in CRP and EBV in the overall population, we caution against the conclusion that observed gender differences in these biomarkers are only a function of biology. First, such a conclusion would be inconsistent with evidence from other settings that indicates no mean difference CRP or EBV by sex/gender. Second, our measures of social and economic environments are limited. For example, we are not able to measure cumulative environments as comprehensively as we would like, given that parent-reported data are only available during the first wave. While Add Health data permit us to test a more comprehensive life course model than has been the case in previous research, it is possible that a more cumulative measure of socioeconomic status—one that captures early childhood SES in addition to adolescent and young adulthood SES, for example—would yield a larger contribution of the social environment to gender differences in young adulthood. For this to be the case, however, girls and boys would need to experience significantly different childhood environments, and we find little evidence of meaningful variation with our available data (see Table 1). Moreover, the results are robust to the inclusion of sibling fixed effects, which capture unobserved, shared family circumstances of male and female respondents. The results are also insensitive to alternative coding and measurement strategies for CRP and EBV, to the exclusion of potential outlier respondents (e.g., pregnant women and recently ill respondents), and to controls for health conditions and medication use. Third, this analysis focuses on additive effects and not interactions. While such an approach is a necessary first step, real-world complexity suggests that effects of social environments might be masked if biomarker levels are a function of interactive relationships.
Further, while higher levels of CRP and EBV are associated with risk of chronic disease, including cancer, cardiovascular and metabolic disease, whether a given level in these biomarkers translates into similar risk for men and women is difficult to discern from current studies. Existing research is based on different samples and populations, investigates different health outcomes, and produces results that show both equivalent and different risks (Cushman et al. 2005; Han et al 2002; Pai et al. 2004; Yamada et al. 2001). Further, existing practice guidelines do not offer guidance. For example, in 2003, a statement from the Centers for Disease Control and Prevention and the American Heart Association identified over 3 mg/L of CRP as high risk for cardiovascular disease for both men and women, but also noted the need for additional high-quality evidence (Pearson et al. 2003). In short, we emphasize that though we document difference in physiologic function by gender, and patterns and correlates of such difference, the implications for differences in risk are unclear. In future research it will be useful to examine a more comprehensive life model that includes the critical and sensitive early childhood years. In addition, it will be useful to consider gender variation in the effects of social and economic circumstances during adulthood on biological function. Variation in patterns of family formation between men and women, such as the high prevalence of single motherhood in the U.S., mean that adult men and women experience different social stressors that may condition the influence of gender on biological function. Conversely, contemporary patterns of higher educational attainment among women may offset some of the physiologic and health disadvantages associated with low socioeconomic status. Further, additional work on the implications of differences in physiologic function for risk is needed. Examining health within a cohort of young men and women in early adulthood advances our understanding of the intragenerational predictors of pronounced gender differences in biological function, highlights the robustness of those differences, and describes patterns that can be further explored.
Contributor Information
Margot Jackson, Associate Professor of Sociology at Brown University.
Susan E. Short, Professor of Sociology at Brown University
References
- Arias Elizabeth. 2014. “United States Life Tables, 2010.” National Vital Statistics Reports 63(7): 1–62. [PubMed] [Google Scholar]
- Alley Dawn E., Seeman Teresa E., Kim Jung Ki, Karlamangla Arun, Hu Peifeng and Crimmins Eileen M. 2006. “Socioeconomic Status and C-Reactive Protein Levels in the US Population: NHANES IV.” Brain, Behavior, and Immunity 20:498–504. [DOI] [PubMed] [Google Scholar]
- Austad SN. 2006. “Why women live longer than men: sex differences in longevity.” Gender Medicine. 3(2):79–92. [DOI] [PubMed] [Google Scholar]
- Berkman Lisa. 2012. “United States—Challenges of Economic and Demographic Trends.” Social Science and Medicine 74(5): 656–657. [DOI] [PubMed] [Google Scholar]
- Bianchi SM, Robinson JP and Milke MA, 2006. The changing rhythms of American family life. Russell Sage Foundation. [Google Scholar]
- Bird Chloe E., and Rieker Patricia P. 2002. “Integrating social and biological research to improve men’s and women’s health.” Women’s Health Issues, 12(3): 113–115. [DOI] [PubMed] [Google Scholar]
- Cartier Amélie, Mélanie Côté, Pérusse Louis, Louis Pérusse Angelo Tremblay, Bouchard Claude, and Jean-Pierre Després. 2009. “Sex differences in inflammatory markers: what is the contribution of visceral adiposity?.” The American journal of clinical nutrition 89(5): 1307–1314. [DOI] [PubMed] [Google Scholar]
- Case Anne, and Paxson Christina. 2005. “Sex differences in morbidity and Mortality.” Demography 42: 189–214. [DOI] [PubMed] [Google Scholar]
- Case Anne, Lubotsky Darren, and Paxson Christina. 2002. “Economic status and health in childhood: The origins of the gradient.” The American Economic Review 92(5): 1308–1334. [DOI] [PubMed] [Google Scholar]
- Chen Kevin and Kandel Denise B. 1995. “The Natural History of Drug use from Adolescence to the Mid-Thirties in a General Population Sample.” American Journal of Public Health 85:41–7. [DOI] [PMC free article] [PubMed] [Google Scholar]
- Chen Chao-Yu, Huang Kuan-Ying A., Shen Jen-Hsiang, Tsao Kuo-Chien, and Huang Yhu-Chering. 2015. “A large-scale seroprevalence of Epstein-Barr virus in Taiwan.” PLoS One. [DOI] [PMC free article] [PubMed] [Google Scholar]
- Cohen Jeffrey I. 2000. “Epstein-Barr virus infection.” New England Journal of Medicine 343: 481–492. [DOI] [PubMed] [Google Scholar]
- Crimmins, Eileen et al. 2010. “Gender differences in health: results from SHARE, ELSA and HRS.” European Journal of Public Health 21(1):81–91. [DOI] [PMC free article] [PubMed] [Google Scholar]
- Cushman M, Arnold AM, Psaty BM, Manolio TA, Kuller LH, Burke GL, Polak JF, and Tracy RP 2005. “C-reactive protein and the 10-year incidence of coronary heart disease in older men and women: the cardiovascular health study.” Circulation 112(1): 25–31. [DOI] [PubMed] [Google Scholar]
- DiPrete Thomas A. and Jennings Jennifer L. 2012. “Social and Behavioral Skills and the Gender Gap in Early Educational Achievement.” Social Science Research 41(1): 1–15. [DOI] [PubMed] [Google Scholar]
- Dowd Jennifer Beam, et al. 2013a. “Seroprevalence of Epstein-Barr virus infection in US children ages 6–19, 2003–2010.” PloS one 8(5). [DOI] [PMC free article] [PubMed] [Google Scholar]
- Dowd Jennifer B., et al. 2013b. “Re: Childhood adversity and cell-mediated immunity in young adulthood.” Brain Behavior and Immunity 34: 176. [DOI] [PubMed] [Google Scholar]
- Dowd Jennifer B., Palermo Tia, Chyu Laura, Adam Emma, and McDade Thomas W. 2014. “Race/Ethnic and Socioeconomic Differences in Stress and Immune Function in the National Longitudinal Study of Adolescent Health.” Social Science and Medicine 115: 49–55. [DOI] [PubMed] [Google Scholar]
- Duncan Greg J., Ziol-Guest Kathleen M. and Kalil Ariel. 2010. “Early-Childhood Poverty and Adult Attainment, Behavior, and Health.” Child Development 81:306–25. [DOI] [PubMed] [Google Scholar]
- Entwisle Doris R., Alexander Karl L., and Olson Linda Steffle. 2007. “Early Schooling: The Handicap of Being Poor and Male.” Sociology of Education 80: 114–138. [Google Scholar]
- Esen Bahar Artim, Yilmaz Guldin, Uzun Sami, Ozdamar Melda, Aksozek Alper, Kamali Sevil, Turkoglu Salih, Gul Ahmet, Ocal Lale, Aral Orhan, and Inanc Murat. 2012. “Serologic response to Epstein-Barr virus antigens in patients with systemic lupus erythematosus: A controlled study.” Rheumatology International 32(1): 79–83. [DOI] [PubMed] [Google Scholar]
- Everett Bethany G. 2013. “Sexual orientation disparities in sexually transmitted infections: examining the intersection between sexual identity and sexual behavior.” Archives of sexual behavior 42(2): 225–236. [DOI] [PMC free article] [PubMed] [Google Scholar]
- Everett Bethany G., Rosario Margaret, McLaughlin Katie A., and Bryn Austin S 2014. “Sexual orientation and gender differences in markers of inflammation and immune functioning.” Annals of Behavioral Medicine 47: 57–70. [DOI] [PMC free article] [PubMed] [Google Scholar]
- Fahdi Ibrahim E., Gaddam Venkat, Garza Luis, Romeo Francesco and Mehta Jawahar L. 2003. “Inflammation, Infection, and Atherosclerosis.” Brain, Behavior, and Immunity 17:238–44. [DOI] [PubMed] [Google Scholar]
- Farkas George, Grobe Robert, Sheehan David, and Shuan Yuan. 1990. “Cultural Resources and School Success: Gender, Ethnicity and Poverty Groups Within an Urban School District.” American Sociological Review 55: 127–142. [Google Scholar]
- Finch Brian K. 2003. “Early Origins of the Gradient: The Relationship between Socioeconomic Status and Infant Mortality in the United States.” Demography 40:675–99. [DOI] [PubMed] [Google Scholar]
- Fish EN 2008. The X-files in immunity: sex-based differences predispose immune responses. Nature Reviews Immunology 8(9), 737–744. [DOI] [PMC free article] [PubMed] [Google Scholar]
- Gorman Bridget K., and Jen’nan Ghazal Read. 2006. “Gender disparities in adult health: an examination of three measures of morbidity.” Journal of Health and Social Behavior 47: 95–110. [DOI] [PubMed] [Google Scholar]
- Ishii Shinya, et al. 2012. “Gender, obesity and repeated elevation of C-reactive protein: data from the CARDIA cohort.” PLoS One 7(4). [DOI] [PMC free article] [PubMed] [Google Scholar]
- Han Thang S., Sattar Naveed, Williams Ken, Gonzalez-Villalpando Clicerio, Lean Michael E.J., and Haffner Steven M. 2002. “Prospective study of C-reactive protein in relation to the development of diabetes and metabolic syndrome in the Mexico City Diabetes Study.” Diabetes Care 25(11): 2016–2021. [DOI] [PubMed] [Google Scholar]
- Harris Kathleen M. (2010). “An Integrative Approach to Health.” Demography, 47: 1–22. [DOI] [PMC free article] [PubMed] [Google Scholar]
- Hayward Mark D. and Gorman Bridget K. 2004. “The Long Arm of Childhood: The Influence of Early-Life Social Conditions on Men’s Mortality.” Demography 41(1): 87–107. [DOI] [PubMed] [Google Scholar]
- Heckman James J. 2006. “Skill Formation and the Economics of Investing in Young Children.” Science 312(5782): 1900–1902. [DOI] [PubMed] [Google Scholar]
- Hsu Joe L., and Glaser Sally L. 2000. “Epstein-Barr virus-associated malignancies: Epidemiologic patterns and etiologic implications.” Critical Reviews in Oncology/Hematology 34(1): 27–53. [DOI] [PubMed] [Google Scholar]
- Jackson Margot I. 2010. “A Life Course Perspective on Child Health, Cognition and Occupational Skill Qualifications in Adulthood: Evidence from a British Cohort.” Social Forces 89:89–116. [DOI] [PMC free article] [PubMed] [Google Scholar]
- Jackson Margot I. 2015. “Cumulative Inequality in Child Health and Academic Achievement.” Journal of Health and Social Behavior 56(2): 262–280. [DOI] [PMC free article] [PubMed] [Google Scholar]
- Jacobsen Joyce. 2016. “Gender Wage Gap.” The Wiley Blackwell Encyclopedia of Gender and Sexuality Studies. [Google Scholar]
- James JA, and Robertson JM 2012. Lupus and Epstein-Barr. Curr Opin Rheumatol 24: 383–388. [DOI] [PMC free article] [PubMed] [Google Scholar]
- Kanjilal Sanjat, Gregg Edward W., Cheng Yiling J., Zhang Ping, Nelson David E., Mensah George and Beckles Gloria L. A. 2006. “Socioeconomic Status and Trends in Disparities in 4 Major Risk Factors for Cardiovascular Disease among US Adults, 1971–2002.” Archives of Internal Medicine 166:2348–55. [DOI] [PubMed] [Google Scholar]
- Karlamangla Arun S., Singer Burton H., Williams David R., Schwartz Joseph E., Matthews Karen A., Kiefe Catarina I. and Seeman Teresa E. 2005. “Impact of Socioeconomic Status on Longitudinal Accumulation of Cardiovascular Risk in Young Adults: The CARDIA Study (USA).” Social Science & Medicine 60:999–1015. [DOI] [PubMed] [Google Scholar]
- Kitagawa EM, and Hauser PM 1973. Differential mortality in the United States: A study in socioeconomic epidemiology. Harvard University Press: Cambridge. [Google Scholar]
- Kunst Anton E., et al. 2005. “Trends in socioeconomic inequalities in self-assessed health in 10 European countries.” International Journal of Epidemiology 34(2): 295–305. [DOI] [PubMed] [Google Scholar]
- Lakoski Susan G., Cushman Mary, Criqui Michael, Rundek Tatjana, Blumenthal Roger S., D’Agostino Ralph B., and Herrington David M. 2006. “Gender and C-reactive protein: data from the Multiethnic Study of Atherosclerosis (MESA) cohort.” American Heart Journal 152(3): 593–598. [DOI] [PubMed] [Google Scholar]
- Le-Ha Chi, Beilin Lawrence J., Burrows Sally, Oddy Wendy H., Hands Beth, and Mori Trevor A. 2014. “Gender and the active smoking and high-sensitivity C-reactive protein relation in late adolescence.” Journal of Lipid Research 55(4): 758–764. [DOI] [PMC free article] [PubMed] [Google Scholar]
- Levin Lynn I., Munger Kassandra L., O’Reilly Eilis J., Falk Kerstin I., and Ascherio Alberto. 2010. “Primary infection with the Epstein-Barr virus and risk of multiple sclerosis.” Ann Neurol. 67(6): 824–830. [DOI] [PMC free article] [PubMed] [Google Scholar]
- Lleo Ana, Pier Maria Battezzati, Selmi Carlo, M. Eric Gershwin, and Podda Mauro. 2008. “Is autoimmunity a matter of sex?.” Autoimmunity reviews 7(8): 626–630. [DOI] [PubMed] [Google Scholar]
- Lynch Scott M. 2003. “Cohort and Life-Course Patterns in the Relationship between Education and Health: A Hierarchical Approach.” Demography 40:309–31. [DOI] [PubMed] [Google Scholar]
- Markle JG, and Fish Eleanor N. “SeXX matters in immunity.” Trends in immunology 35, no. 3 (2014): 97–104. [DOI] [PubMed] [Google Scholar]
- Marmot Michael. 2001. “Inequalities in health.” New England Journal of Medicine 345(2): 134–135. [DOI] [PubMed] [Google Scholar]
- Meara Ellen R., Richards Seth and Cutler David M. 2008. “The Gap Gets Bigger: Changes in Mortality and Life Expectancy, by Education: 1981–2000.” Health Affairs 27(2): 350–360. [DOI] [PMC free article] [PubMed] [Google Scholar]
- McDade Thomas W., Stallings Joy F. and Worthman Carol M. 2000. “Culture Change and Stress in Western Samoan Youth: Methodological Issues in the Cross-Cultural Study of Stress and Immune Function.” American Journal of Human Biology 12:792–802. [DOI] [PubMed] [Google Scholar]
- McDade Thomas W., Williams Sharon and Snodgrass JJ 2007. “What a Drop can do: Dried Blood Spots as a Minimally Invasive Method for Integrating Biomarkers into Population-Based Research.” Demography 44:899–925. [DOI] [PubMed] [Google Scholar]
- McDade Thomas W., Metzger Molly W., Chyu Laura, Duncan Greg J., Garfield Craig, and Adam Emma K. 2014. “Long-term effects of birth weight and breastfeeding duration on inflammation in early adulthood.” Proceedings of the Royal Society of London B: Biological Sciences 281(784): 20133116. [DOI] [PMC free article] [PubMed] [Google Scholar]
- Miller Michelle A., Kandala Ngianga-Bakwin, Kivimaki Mika, Kumari Meena, Brunner Eric J., Lowe GD, Marmot Michael G., and Cappuccio Francesco P. 2009. “Gender differences in the cross-sectional relationships between sleep duration and markers of inflammation: Whitehall II study.” Sleep, 32(7): 857–864. [PMC free article] [PubMed] [Google Scholar]
- Montez Jennifer K. and Zajacova Anna. 2013. “Explaining the Widening Education Gap in Mortality among U.S. White Women.” Journal of Health and Social Behavior 54(2): 166–182. [DOI] [PMC free article] [PubMed] [Google Scholar]
- Moore David E., and Hayward Mark D. 1990. “Occupational careers and mortality of elderly men.” Demography 27(1): 31–53. [PubMed] [Google Scholar]
- Morenoff Jeffrey D. 2003. “Neighborhood mechanisms and the spatial dynamics of birth weight1.” American Journal of Sociology 108(5):976–1017. [DOI] [PubMed] [Google Scholar]
- National Research Council 2001. Exploring the Biological Contributions to Human Health: Does Sex Matter? Washington, DC: The National Academies Press. [PubMed] [Google Scholar]
- Nolen-Hoeksema Susan. 2001. “Gender Differences in Depression.” Current Directions in Psychological Science 10(5): 173–176. [Google Scholar]
- Ockene Ira S., et al. 2001. “Variability and classification accuracy of serial high-sensitivity C-reactive protein measurements in healthy adults.” Clinical chemistry 47(3): 444–450. [PubMed] [Google Scholar]
- Oldehinkel AJ and Bouma EM 2011. “Sensitivity to the depressogenic effect of stress and HPA-axis reactivity in adolescence: a review of gender differences.” Neuroscience & Biobehavioral Reviews, 35(8):1757–1770. [DOI] [PubMed] [Google Scholar]
- Oksuzyan Anna, Shkolnikova Maria, Vaupel James W., Christensen Kaare, and Shkolnikov Vladimir M. 2015. “Sex Differences in Biological Markers of Health in the Study of Stress, Aging and Health in Russia.” PloS one 10(6): e0131691. [DOI] [PMC free article] [PubMed] [Google Scholar]
- Ordaz S and Luna B, 2012. Sex differences in physiological reactivity to acute psychosocial stress in adolescence. Psychoneuroendocrinology, 37(8), pp.1135–1157. [DOI] [PMC free article] [PubMed] [Google Scholar]
- Pai Jennifer K., Pischon Tobias, Ma Jing, Manson JoAnn E., Hankinson Susan E., Joshipura Kaumudi, Curhan Gary C., Rifai Nader, Cannuscio Carolyn C., Stampfer Meir J., and Rimm Eric B. 2004. “Inflammatory markers and the risk of coronary heart disease in men and women.” New England Journal of Medicine 351: 2599–2610. [DOI] [PubMed] [Google Scholar]
- Pampel Fred C. 2001. “Cigarette Diffusion and Sex Differences in Smoking.” Journal of Health and Social Behavior 32(4): 388–404. [PubMed] [Google Scholar]
- Palloni Alberto. 2006. “Reproducing inequalities: Luck, wallets, and the enduring effects of childhood health.” Demography 43(4): 587–615. [DOI] [PubMed] [Google Scholar]
- Pearson Thomas A., Mensah George A., R. Wayne Alexander, Anderson Jeffrey L., Cannon Richard O., Criqui Michael, Fadl Yazid Y., Fortmann Stephen P., Hong Yuling, Myers Gary L., Rifai Nader, Smith Sidney C., Kathryn Taubert, Tracy Russell P., and Frank Vinicor. 2003. “Markers of inflammation and cardiovascular disease: Application to clinical and public health practice - A statement for heathcare professionals from the Centers for Disease Control and Prevention and the American Heart Association.” Circulation 107: 499–511. [DOI] [PubMed] [Google Scholar]
- Pomerantz Eva M., Altermatt Ellen R., Rydell Ellen and Saxson Jill L. 2002. “Making the Grade but Feeling Distressed: Gender Differences in Academic Performance and Internal Distress.” Journal of Educational Psychology 94(2): 396–404. [Google Scholar]
- Jen’nan Ghazal Readand Gorman Bridget K. 2010. “Gender and Health Inequality.” Annual Review of Sociology 36: 371–386. [Google Scholar]
- Ridker Paul M., et al. 1998. “Prospective study of C-reactive protein and the risk of future cardiovascular events among apparently healthy women.”Circulation 98(8): 731–733. [DOI] [PubMed] [Google Scholar]
- Rieker Patricia P., Bird Chloe E., and Lang Martha E. 2010. “Understanding Gender and Health.” Handbook of Medical Sociology pp.52–74 in Bird CE, Conrad P, Fremont AM, Timmermans S, eds. Understanding Gender and Health: Old Patterns, New Trends and Future Directions. 6th ed Nashville, TN: Vanderbilt University Press. [Google Scholar]
- Shames Richard S. “Gender differences in the development and function of the immune system.” Journal of Adolescent Health 30, no. 4 (2002): 59–70. [DOI] [PubMed] [Google Scholar]
- Shanahan Lilly, Freeman Jason, and Bauldry Shawn. 2014. “Is very high C-reactive protein in young adults associated with indicators of chronic disease risk?” Psychoneuroendocrinology 40: 76–85. [DOI] [PMC free article] [PubMed] [Google Scholar]
- Short Susan E., Y. Claire Yang, and Jenkins Tania M. 2013. “Sex, Gender, Genetics, and Health.” American Journal of Public Health 103(S1):S93–S 101. [DOI] [PMC free article] [PubMed] [Google Scholar]
- Smith G Davey, et al. 2000. “Physical activity and cause-specific mortality in the Whitehall study.” Public health 114(5): 308–315. [DOI] [PubMed] [Google Scholar]
- Thompson Matthew P., and Kurzrock Razelle. 2004. “Epstein-Barr virus and cancer.” Clinical Cancer Research 10(3): 803–821. [DOI] [PubMed] [Google Scholar]
- Umberson Debra, Crosnoe Robert, and Reczek Corinne. 2010. “Social relationships and health behavior across life course.” Annual review of sociology 36:139. [DOI] [PMC free article] [PubMed] [Google Scholar]
- Wagmiller Robert L. Jr., et al. 2006. “The Dynamics of Economic Disadvantage and Children’s Life Chances.” American Sociological Review 71(5):847–866. [Google Scholar]
- Williams L. Susan. 2002. Trying on Gender, Gender Regimes, and the Process of Becoming Women. Gender & Society 16(1): 29–52. [Google Scholar]
- Yamada Seishi, Gotoh Tadao, Nakashima Yoshiyki, Kayaba Kazunori, Ishikawa Shizukiyo, Nago Naoki, Nakamura Yosikazu, Itoh Yoshihisa, and Kajii Eiji. 2001. “Distribution of serum C-reactive protein and its association with atherosclerotic risk factors in a Japanese population.” American Journal of Epidemiology 153(12): 1183–1190. [DOI] [PubMed] [Google Scholar]
- Yang Yang Claire, McClintock Martha K., Michael Kozloski, and Li Ting 2013. “Social Isolation and Adult Mortality The Role of Chronic Inflammation and Sex Differences.” Journal of Health and Social Behavior 54(2): 183–203. [DOI] [PMC free article] [PubMed] [Google Scholar]
- Yang Yang, and Kozloski Michael. 2011. “Sex differences in age trajectories of physiological dysregulation: inflammation, metabolic syndrome, and allostatic load.” The Journals of Gerontology Series A: Biological Sciences and Medical Sciences 66(5): 493–500. [DOI] [PMC free article] [PubMed] [Google Scholar]