

Abstract:
Optimal oxygen delivery during cardiopulmonary bypass (CPB) for open heart surgery is crucial to protect organ function, improve outcomes, and reduce hospital stay. Effective preparation for optimal oxygen delivery during CPB is dependent on a reliable estimation of total blood volume (TBV) to accurately predict dilutional hematocrit (Hct) and calculate indexed oxygen delivery (iDO2). Unreliable estimation of TBV is a major reason for inaccurate prediction of dilutional Hct and iDO2. We performed a retrospective study of 113 patients who underwent cardiac surgery to compare the accuracy of predicted versus measured Hct and iDO2. We used four conventional methods of TBV estimation: 1) weight based A; 70 mL/kg for all patients, 2) weight based B; 70 mL/kg for males and 65 mL/kg for females, 3) Allen’s formula, and 4) Nadler’s formula. We found that TBV estimated by Allen’s formula predicted dilutional Hct better than the other three. However, all four methods overestimate TBV when Hct is low and underestimate when Hct is high, suggesting that TBV is dependent on Hct in addition to body size and gender. Our analysis indicates that two individuals with the same body size and gender can have different TBV depending on Hct. We revised Allen’s formula by adding a component that adjusts TBV depending on Hct to provide a more accurate prediction of dilutional Hct and iDO2.
Keywords: improved total blood volume estimation, prediction of accurate hematocrit, prediction of indexed oxygen delivery, cardiopulmonary bypass
Optimal oxygen delivery during cardiopulmonary bypass (CPB) is critical to protect function of organs and have better outcomes post surgery. For example, acute kidney injury (AKI) has been shown to have a strong correlation with insufficient oxygen delivery, which results in significant morbidity, mortality, and longer intensive care unit and hospital stays (1–5). Indexed oxygen delivery (iDO2) of 260–270 mL/min/m2 or lower is shown to be strongly associated with AKI and increased lactate production, likely because of a hypoxic insult to the kidney and other organs (1,5–8).
Hematocrit (Hct) and pump flow rate determine iDO2 during CPB (5,7,9). At the initiation of CPB, significant hemodilution occurs compared with pre-operation (pre-OP) because of 1) anesthesia pre-CPB crystalloid usage, 2) the prime volume of the circuit on bypass, and 3) induction cardioplegia volume. After initiation of CBP, the lowest Hct and iDO2 likely occurs after the delivery of induction cardioplegia (10). To prepare for optimal oxygen delivery during CPB, it is important to predict dilutional Hct and iDO2 accurately. Prediction of dilutional Hct is mostly dependent on the reliable estimation of total blood volume (TBV) (11). If the estimation of TBV is unreliable, prediction of dilutional Hct and iDO2 will be inaccurate, which can result in sub-optimal oxygen delivery, particularly in the first 20–30 minutes of CPB.
At Massachusetts General Hospital (MGH), perfusionists predict dilutional Hct and iDO2 for each patient during routine patient workup and use this information to prepare CPB circuit for optimal perfusion. Currently, we calculate dilutional Hct and iDO2 using the patient weight, pre-op Hct, two dilution factors (estimated anesthesia pre-CPB crystalloid usage and CPB prime volume), and 2.4 indexed flow rate (see Materials and Methods). However, we often found that the predicted dilutional Hct and corresponding iDO2 do not agree with the measured ones, which can create an unexpected low oxygen delivery at the beginning of CPB until proper actions take place (i.e., hemoconcentration, high flow rate if volume allows, or red blood cells (RBC) transfusion). We decided to study how accurate our prediction of dilutional Hct and iDO2 is compared with the measured ones. If predicted values do not correlate with measured ones, we should be able to identify the source of inaccuracy and make an improvement in our prediction.
In this retrospective study, we compared predicted dilutional Hct using four conventional methods of estimating TBV undergoing cardiac surgery with CPB: 1) weight based A; 70 mL/kg, 2) weight based B; 70 mL/kg for males and 65 mL/kg for females, 3) Allen’s formula (12), and 4) Nadler’s formula (13) to measure Hct and their effect on the predicted and measured iDO2. We found that all four methods overestimated TBV when the patient’s pre-OP Hct was low, whereas underestimated TBV when the pre-OP Hct was high.
We developed a revised formula to estimate a more reliable TBV, which includes Hct-dependent difference in TBV to predict a reliable dilutional Hct and iDO2 on CPB. The formula indicates that two individuals with the same body size and gender have different TBV depending on Hct (6% of TBV/Hct) and helps predict accurate dilutional Hct and iDO2. However, we also found that this modified formula does not work well with severely anemic patients who have pre-OP Hct of 32% or below.
MATERIALS AND METHODS
Patients Population
We reviewed the anesthesia and perfusion records of 183 patients from July 1, 2015 to September 9, 2015, who had cardiac surgery with CPB at MGH. We excluded patients with the following criteria for accurate analysis: blood transfusion, retrograde autologous priming (RAP)/venous autologous priming (VAP), and/or hemoconcentration between arterial blood samplings of pre-OP and 10–20 minutes after cardioplegia delivery because data such as RAP/VAP volume and volume removed by hemoconcentration were often missing. Patients with CDI calibration not performed before 10–20 minutes after cardioplegia delivery, heart transplant, left ventricular assist device (LVAD) insertion, or deceased were also excluded. We excluded 70 patients, leaving 113 patients to be analyzed.
 |
 |
TBV, total blood volume; PHct, pre-operative (OP) Hct (the first Hct in operating room [OR]); PV, CPB prime volume (1,300 mL for body surface area [BSA] ≥1.8; 1,100 mL for BSA <1.8); AV, anesthesia pre-CPB fluid (1,000 mL); ICV, induction cardioplegia volume (200 mL for standard 4:1; 800 mL for del Nido); PRBC, number of packed RBC units used in blood prime; RAP/VAP, RAP and/or VAP volume (mL).
Measured Hct
On initiation of CPB, an arterial blood sample was drawn for blood gas analysis and used to calibrate the CDI System 500 (Terumo Medical Corporation, Somerset, NJ). Hct reading from CDI, 10–20 minutes post cardioplegia delivery before any maintenance delivery, was used as the measured Hct.
TBV Estimation
Weight based A = patient weight (kg) × 70 mL/kg;
Weight based B = patient weight (kg) × 70 mL/kg for male or patient weight (kg) × 65 mL/kg for female;
Allen’s formula = aH3 + bW + c;
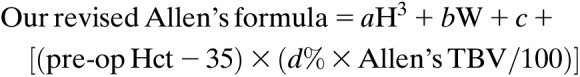
Our modified Allen’s formula = aH3 + bW + c + [(pre-op Hct−35) × (6% × Allen’s TBV/100)];
 |
Nadler’s formula = a`H3 + b`W + c`;
Indexed Oxygen Delivery
iDO2 (mL O2/min/m2) = CI × CaO2 × 10;
CI, cardiac index (L/min/m2); CaO2, arterial oxygen content (mL/dL) = Hb (g/dL) × 1.34 (mL O2/g) × SaO2 (%)/100.
Data Analysis
We used Microsoft Excel Office 365 (Microsoft Corporation, Redmond, WA) to perform data input, calculations, scattered plot, fitted linear regression, and statistical analysis (square of the correlation coefficient, R2 and Student’s t-test, p).
RESULTS
How Reliable is Our Prediction of the Dilutional Hct and iDO2 on CPB?
We retrospectively collected data from 183 patients and excluded 70 patients with the criteria described in Materials and Methods, resulting in 113 patients for further analysis. Because lowest intraoperative Hct likely occurs after the delivery of induction cardioplegia (10), we decided to compare the dilutional vs. measured Hct and iDO2 based on the predicted dilutional and measured Hct with 2.4 indexed flow at 10–20 minutes after the delivery of cardioplegia.
Calculations of dilutional Hct are mostly dependent on TBV estimation, and no consensus exists among several conventional methods of TBV estimation. So, we examined four conventional methods of TBV estimation (see Introduction and Materials and Methods) and their effect on dilutional Hct compared with measured Hct. After calculating the predicted dilutional Hct using four methods of TBV estimation, we put them on an XY scattered plot where the X-axis is the measured Hct and the Y-axis is the predicted dilutional Hct. We then drew fitted linear regression lines for all four predicted dilutional Hct (Figure 1 and Table 1). If dilutional Hct perfectly correlates with the measured Hct, the slope of the line would be 1 and Y-intercept would be 0 (black dotted ideal line in Figure 1).
Figure 1.

Predicted dilutional Hct using four conventional methods of TBV estimation have a significant difference with the measured Hct. Predicted dilutional Hct (Y-axis) from 113 patients were calculated using four conventional methods of TBV estimation and compared with the measured Hct (X-axis) by putting the data on an XY scattered plot. Fitted linear regression lines were drawn for all four predicted dilutional Hct  ; ideal line,
  ; Weight based A,
  ; Weight based B,
  ; Allen’s formula,
  ; Nadler’s formula. All data points are deleted for clarity of presentation. Only ideal and fitted linear lines are shown. Slope, Y-intercept, and R2 are shown in Table 1.
Table 1.
Predicted dilutional Hct using four conventional methods of TBV estimation does not correlate with measured Hct on CPB.
| TBV Method | Slope | Y-Intercept | R2 |
|---|---|---|---|
| Ideal | 1.0 | 0 | n/a |
| Weight based A | .66 | 8.5 | .63 |
| Weight based B | .68 | 7.9 | .63 |
| Allen’s formula | .70 | 6.9 | .66 |
| Nadler’s formula | .65 | 7.6 | .67 |
We found that Allen’s formula estimates TBV slightly better than the other three methods as the slope of .70 is closest to 1 and the Y-intercept of 6.9 is closest to 0, resulting in a slightly better prediction of dilutional Hct (Figure 1 and Table 1). However, not enough statistically significant difference exists among weight based A, B, and Allen’s formula (p values are .08 or higher, data not shown), whereas Nadler’s formula is significantly different from the other three methods (p values are .00, data not shown). Nadler’s formula consistently underpredicts TBV compared with the other three methods, suggesting that Nadler’s formula may not be a good choice to use in the calculation of predicted dilutional Hct in CPB.
All four fitted linear regression lines are above the black dotted ideal line when the measured dilutional Hct is lower than 24% and below the black dotted ideal line when higher than 24% approximately, which is statistically significant (p values of the measured Hct vs. predicted Hct are .01 or lower, data not shown). It suggests that all four conventional methods overestimate TBV when the patient’s pre-OP Hct is low, whereas underestimate TBV when the pre-OP Hct is high (Figure 1). We calculated the average drop of Hct to be 11% from the pre-OP to 10–20 minutes after the delivery of cardioplegia. Thus, it indicates that conventional TBV methods overestimate when the patient’s pre-OP Hct is lower than 35%, whereas underestimate TBV when the pre-OP Hct is higher than 35% approximately. The most important implication is TBV is not only dependent on body size and gender but also on Hct.
How Can We Improve the TBV Estimation?
Unreliable estimation of TBV contributes to the inaccurate prediction of dilutional Hct, and our analysis suggests that we should be able to improve the estimation by adjusting TBV depending on Hct. Because Allen’s formula provided the most accurate prediction of dilutional Hct compared with measured one (Figure 1 and Table 1), we decided to modify Allen’s formula as the foundation for our improved calculation. We added a component, [(pre-op Hct − 35) × (d% × Allen’s TBV/100)] to Allen’s formula. This component incorporates our finding that conventional TBV methods overestimate when the patient’s pre-OP Hct is lower than 35%, whereas underestimate TBV when the pre-OP Hct is higher than 35% approximately. “d” indicates difference in the percentage of TBV per Hct difference.
 |
According to our findings, Allen’s formula will provide the most accurate estimation when patient’s pre-op Hct is 35%. However, if Hct is higher than 35%, TBV will increase and if lower than 35%, it will decrease, both by (d% × Allen’s TBV/100) mL/Hct. What should be d% to have the most accurate formula?
We found that when d is 6%, the slope becomes 1.0 and the Y-intercept becomes .26, which essentially overlaps with the ideal dotted line with an increase in R2 from .662 to .672 (Figure 2 and Table 2). It indicates that 6% of TBV difference per Hct difference with the same body size and gender likely exists. With the addition of Hct-based difference in TBV estimation, we can predict more reliable dilutional Hct and thus iDO2 on CPB to prepare for optimal perfusion. However, we also found that all patients with pre-OP Hct of 32% or below (7/7) have a worse estimation of TBV with the modified formula than with Allen’s formula, suggesting that Hct-based difference of TBV does not apply to severely anemic patients.
Figure 2.

Estimated TBV using our revised Allen’s formula provides a reliable prediction of dilutional Hct. Predicted dilutional Hct (Y-axis) from 113 patients was calculated using TBV estimation from Allen’s and our modified Allen’s formula (d = 6%) and compared with the measured Hct (X-axis) by putting the data on an XY scattered plot. Fitted linear regression lines were drawn for two predicted dilutional Hct  ; ideal line,
  ; modified Allen’s,
  ; Allen’s formula. Only ideal and fitted linear lines are shown for clarity. Slope, Y-intercept, and R2 are shown in Table 2.
Table 2.
Six percentage of TBV adjustment per Hct gives a reliable prediction of predicted dilutional Hct on CPB.
| d (%) | Slope | Y-Intercept | R2 |
|---|---|---|---|
| 0 | .70 | 6.9 | .662 |
| 5.0 | .95 | 1.2 | .674 |
| 5.5 | .97 | .8 | .673 |
| 6.0 | 1.00 | .27 | .672 |
| 6.5 | 1.02 | −.21 | .671 |
| 7.0 | 1.04 | −.70 | .669 |
Effects of Improved TBV Estimation on the Prediction of Oxygen Delivery
Prediction of iDO2 assumes that CPB pump flow would be at a 2.4 index with the predicted dilutional Hct. If it flows at a 2.4 index for every patient, predicted iDO2 is directly proportional to predicted Hct, which is mainly determined by estimated TBV. Thus, the accuracy of predicted iDO2 is also dependent on reliable estimation of TBV.
First, we compared the predicted iDO2 based on Allen’s and our revised Allen’s formula with iDO2 at 2.4-indexed flow with the measured Hct (Figure 3). We expected that the slopes of two linear regression lines of the predicted iDO2 should be the same as ones in the predicted dilutional vs. measured Hct because the only difference between two analysis is converting predicted dilutional Hct into predicted iDO2 where only variable is the predicted dilutional Hct. As expected, the slopes are the same, .70 and 1.0 for the predicted iDO2 based on Allen’s and our revised Allen’s formula with the same R2, respectively (Table 3). It indicates that if it consistently flows at a 2.4 index, our revised formula will give us the most reliable prediction of iDO2 at 10–20 minutes post cardioplegia delivery. It also confirms that the reliable prediction of iDO2 is mostly determined by good estimation of TBV, which can be provided by our revised Allen’s formula including Hct-dependent change of TBV.
Figure 3.

Our revised Allen’s formula gives us the most reliable prediction of iDO2. Predicted iDO2 (Y-axis) from 113 patients was calculated using TBV estimation from Allen’s and our modified Allen’s formula (d = 6%) and compared with iDO2 with the measured Hct at a flow of 2.4 index (X-axis) by putting the data on an XY scattered plot. Fitted linear regression lines were drawn for two predicted dilutional Hct. For comparison, measured iDO2 at the real flow rate (Y-axis) versus iDO2 with measured Hct at the 2.4 index (X-axis) are shown.  ; Ideal line,
  ; modified Allen’s,
  ; Allen’s formula,
  ; measured with real flow. Only ideal and fitted linear lines are shown for clarity. Slope, Y-intercept, and R2 are shown in Table 3.
Table 3.
Our modified Allen’s formula provides a reliable prediction of iDO2.
| Slope | Y-Intercept | R2 | |
|---|---|---|---|
| Allen’s | .70 | 74 | .66 |
| Modified Allen’s | 1.00 | 2.9 | .67 |
| Measured flow | .90 | 20 | .75 |
On review of the pump data, we found that the actual flow in our practice is 2.3 ± .2 index on average at 10–20 minutes after the delivery of cardioplegia (data not shown). When we compared measured iDO2 at a real flow rate to iDO2 at a 2.4 index with measured Hct 10–20 minutes after the delivery of cardioplegia, the slope becomes .90 (double dotted dashed line, Figure 3 and Table 3). Interestingly, this line is more deviant from the ideal line at the right side (with higher oxygen delivery) and almost overlaps with the ideal line at the left side (with lower oxygen delivery). This indicates that the average indexed flow was near or at 2.4 when dilutional Hct and oxygen delivery was low. Meanwhile, it was lower when oxygen delivery was higher than recommended. This finding suggests that we are aware of the importance of oxygen delivery and try to meet the oxygen requirement with patients who have low dilutional Hct.
DISCUSSION
Cardiac surgery with CPB is notable for significant hemodilution via anesthesia pre-CPB crystalloid usage, CPB prime volume, and delivery of cardioplegia. This hemodilution causes a significant drop in oxygen delivery at the onset of CPB (10,14). Because it has been shown that optimal oxygen delivery during CPB is critical to protect organ functions and have better outcome (1,5–8), it is crucial to have an accurate prediction of the dilutional Hct and subsequent iDO2 on initiation of CPB and delivery of cardioplegia for appropriate preparation of CPB circuit and plan.
A reliable prediction of iDO2 is directly dependent on the accurate prediction of the dilutional Hct. The prediction of dilutional Hct is dependent on TBV estimation, pre-CPB crystalloid usage, CPB prime volume, and cardioplegia delivery. Among them, TBV estimation is critical because it is a calculated estimation, not a measurement. Thus, it is crucial to find a way to have a reliable estimation of TBV, which will provide an accurate prediction of dilutional Hct.
In this study, we found that the predicted dilutional Hct using any of the four conventional methods to estimate TBV was significantly different from the measured Hct on CPB (Figure 1 and Table 1). Interestingly, the difference is dependent on the pre-OP Hct of patients. Our analysis showed that Allen’s formula gives a reliable estimation of TBV to predict dilutional Hct and iDO2 accurately compared with the measured Hct when the pre-Op Hct of patient is about 35%. However, when it is more than 35%, TBV likely increases by 6% per Hct, whereas when less than 35%, TBV likely decreases by 6% per Hct (Figure 2 and Table 2). Our data indicate that two individuals with the same gender, height, and weight will have different TBV depending on Hct (6% TBV per Hct).
Two recent studies of goal-directed perfusion (GDP), focusing on maintaining iDO2 above 280–300 mL/min/m2 throughout CPB, showed significant reduction of stage 1 AKI (3,15). It confirms that GDP strategy to maintain iDO2 is an effective way to reduce stage 1 AKI. Our adjustment of TBV based on Hct results in more accurate prediction of dilutional Hct and iDO2, which can be a valuable adjunct to achieve GDP particularly in the first 20–30 minutes of CPB when a real-time monitoring of Hct and iDO2 is not likely established yet. We also added a formula to predict dilutional Hct including RAP/VAP and/or blood prime in Materials and Methods to make our finding more applicable in real practice.
We corrected the inaccuracy of the predicted dilutional Hct by adjusting TBV based on the pre-OP Hct, which also improved statistical significance (Table 2). An intriguing question is whether the difference in TBV based on Hct is real, or we have to change TBV to reflect deviation in other variables such as anesthesia pre-CBP crystalloid usage, urine production, and degree of retention of prime and cardioplegia volume in the blood system. If our vascular system is completely closed, the difference is likely real. However, fluid exchange occurs between the vascular system and interstitial space. It has been shown that a significant portion of rapidly administered crystalloid can move out of the blood vessel into the interstitial space quickly, possibly because of a decrease in colloid osmotic pressure and damage in the endothelial glycocalyx layer (14,16–18). The difficulty is to predict how much of the rapidly added volumes at the initiation of CPB and cardioplegia delivery would stay in the vascular system, which could be different in each patient and likely add complexity in the prediction of dilutional Hct. In practice, [6% TBV change/(Hct − 35)] likely accounts for some real difference in TBV based on Hct as well as requirements to adjust for other variables. Even though it is not easy to examine the real difference in TBV based on Hct, our study shows that changing TBV based on Hct can provide a reliable prediction of dilutional Hct than conventional methods on CPB.
ACKNOWLEDGMENTS
This project was undertaken as a quality improvement initiative at MGH and as such was not formally supervised by the Institutional Review Board per their policies. The authors would like to thank William Riley, MS, CCP, for critically reviewing the manuscript.
REFERENCES
- 1.De Somer F, Mulholland JW, Bryan MR, et al. O2 delivery and CO2 production during cardiopulmonary bypass as determinants of acute kidney injury: Time for a goal-directed perfusion management? Crit Care. 2011;15:R192. [DOI] [PMC free article] [PubMed] [Google Scholar]
- 2.Long DM, Jenkins E, Griffith K. Perfusionist techniques of reducing acute kidney injury following cardiopulmonary bypass: An evidence-based review. Perfusion. 2015;30:25–32. [DOI] [PubMed] [Google Scholar]
- 3.Magruder JT, Crawford TC, Harness HL, et al. A pilot goal-directed perfusion initiative is associated with less acute kidney injury after cardiac surgery. J Thorac Cardiovasc Surg. 2017;153:118–25. [DOI] [PMC free article] [PubMed] [Google Scholar]
- 4.Murphy GS, Hessel EA, Groom RC. Optimal perfusion during cardiopulmonary bypass: An evidence-based approach. Anesth Analg. 2009;108:1394–417. [DOI] [PubMed] [Google Scholar]
- 5.Ranucci M, Romitti F, Isgrò G, et al. Oxygen delivery during cardiopulmonary bypass and acute renal failure after coronary operations. Ann Thorac Surg. 2005;80:2213–20. [DOI] [PubMed] [Google Scholar]
- 6.Magruder JT, Dungan SP, Grimm JC, et al. Nadir oxygen delivery on bypass and hypotension increase acute kidney injury risk after cardiac operations. Ann Thorac Surg. 2015;100:1697–703. [DOI] [PubMed] [Google Scholar]
- 7.Newland RF, Baker RA. Low oxygen delivery as a predictor of acute kidney injury during cardiopulmonary bypass. J Extra Corpor Technol. 2017;49:224–30. [PMC free article] [PubMed] [Google Scholar]
- 8.Ranucci M, De Toffol B, Isgrò G, et al. Hyperlactatemia during cardiopulmonary bypass: Determinants and impact on postoperative outcome. Crit Care. 2006;10:R167. [DOI] [PMC free article] [PubMed] [Google Scholar]
- 9.Baker RA. Variation in measurement and reporting of goal directed perfusion parameters. J Extra Corpor Technol. 2017;49:P2–7. [PMC free article] [PubMed] [Google Scholar]
- 10.Stammers AH, Tesdahl EA, Mongero LB, et al. Does the type of cardioplegic technique influence hemodilution and transfusion requirements in adult patients undergoing cardiac surgery? J Extra Corpor Technol. 2017;49:231–40. [PMC free article] [PubMed] [Google Scholar]
- 11.Hilberath JN, Smith T, Jara C, et al. Blood volumes in cardiac surgery with cardiopulmonary bypass. Perfusion. 2015;30:395–9. [DOI] [PubMed] [Google Scholar]
- 12.Allen TH, Peng MT, Chen KP, et al. Prediction of blood volume and adiposity in man from body weight and cube of height. Metabolism. 1956;5:328–45. [PubMed] [Google Scholar]
- 13.Nadler SB, Hidalgo JU, Bloch T. Prediction of blood volume in normal human adults. Surgery. 1962;51:224–32. [PubMed] [Google Scholar]
- 14.Myers GJ. Predictive Hemodilution: The Principles and Practice of Hemodilution during Cardiac Surgery. Mirandola, Italy: Sorin Perfusion Books, Sorin Group; 2013;13–16, 79–80. [Google Scholar]
- 15.Ranucci M, Johnson I, Willcox T, et al. Goal-directed perfusion to reduce acute kidney injury: A randomized trial. J Thorac Cardiovasc Surg. 2018;156:1918–27. [DOI] [PubMed] [Google Scholar]
- 16.Andrijauskas A, Svensen C, Ivaskevicius J, et al. Goal directed fluid therapy revised: Indirect monitoring of interstitial fluid accumulation during mini fluid challenges with crystalloids. Open Conf Proc J. 2012;3:42–51. [Google Scholar]
- 17.McIlroy DR, Kharasch ED. Acute intravascular volume expansion with rapidly administered crystalloid or colloid in the setting of moderate hypovolemia. Anesth Analg. 2003;96:1572–7. [DOI] [PubMed] [Google Scholar]
- 18.Rehm M, Bruegger D, Christ F, et al. Shedding of the endothelial glycocalyx in patients undergoing major vascular surgery with global and regional ischemia. Circulation. 2007;116:1896–906. [DOI] [PubMed] [Google Scholar]