

Abstract
Background:
Body fat distribution is an emerging prognostic indicator in patients treated with anti-angiogenic (AA) therapy. We sought to evaluate the association of visceral and subcutaneous fat with progression free survival (PFS) and overall survival (OS) in patients with metastatic melanoma treated with AA therapy.
Methods:
Stage IV melanoma patients received bevacizumab ± interferon-alpha. Total abdominal fat, visceral fat area (VFA) and subcutaneous fat area (SFA) were measured at L3-L4 on CT images (cm2). PFS and OS were estimated by the Kaplan-Meier method. Cox proportional hazards model was used to assess the association of fat and clinical variables with PFS and OS. Prediction accuracy was evaluated using receiver operating characteristic curve with area under the curve (AUC).
Results:
Forty-two patients were evaluated. Median VFA/SFA and body mass index (BMI) were used to group patients into high and low cohorts. PFS and OS were significantly decreased in patients with high VFA/SFA versus low (PFS, p=0.009; OS, p=0.007), but not for BMI (PFS, p=0.774; OS, p=0.881). VFA/SFA, LDH and liver metastasis (LM) were predictors of PFS and OS on multivariate analysis. A prognostic score combining VFA/SFA, LDH, and presence or absence of LM had a higher accuracy for predicting PFS at 3 months (AUC 0.759) and OS at 24 months (AUC 0.846) than LDH and LM alone (PFS, AUC 0.705; OS, AUC 0.786).
Conclusion:
Increased VFA/SFA is associated with decreased PFS and OS in patients with metastatic melanoma treated with AA therapy, indicating body fat distribution is an important prognostic factor.
Keywords: melanoma, visceral fat, anti-angiogenic therapy, abdominal fat
INTRODUCTION
Obesity has been identified as a risk factor for the development of many cancers including melanoma1–3. Several cytokines and hormones associated with adipose tissue have been implicated in the obesity-cancer connection. One hypothesis for the contribution of obesity to tumor growth is that adipocytes produce high levels of vascular endothelial growth factor (VEGF)4. VEGF is a well-known factor in tumor growth and angiogenesis, and its production is strongly associated with visceral fat versus subcutaneous fat5.
The use of targeted anti-angiogenic therapy has shown favorable results in multiple tumor types. However the identification of a biomarker to select patients for these treatments is still being investigated. Computed tomography (CT) can be used to measure abdominal fat distribution using measurements of subcutaneous fat and visceral fat6. Studies in colorectal and renal cell carcinoma have shown a strong association between increased visceral fat and decreased progression free survival (PFS) and overall survival (OS) in patients receiving anti-angiogenic therapy7–8.
Melanoma metastases are highly vascular tumors. Recent studies have shown response to anti-angiogenic therapy as well as an improvement in PFS and OS in patients with metastatic melanoma9–14. However, predicting response to therapy with these new agents remains a challenge. We hypothesized that patients with increased visceral fat treated with bevacizumab and interferon-alpha (IFN-α) would have decreased survival. Therefore, our objective was to evaluate the association of visceral and subcutaneous fat measurements with PFS and OS in patients with metastatic melanoma treated with bevacizumab ± IFN-α.
METHODS
IRB approval was obtained and informed consent was waived for this retrospective analysis of a randomized phase II clinical trial. In that trial patients with metastatic melanoma were treated with bevacizumab with or without IFN-α. The trial was conducted between December 2001 and April 2012. In the first two treatment arms patients were randomized to receive bevacizumab with or without low dose IFN-α (1 MU/m2). A third arm was added in which patients received bevacizumab with high dose IFN-α (10 MU/m2). Eligible patients (N = 62) had histologically confirmed malignant melanoma, evidence of metastatic disease and met the following criteria: age ≥ 18 years, life expectancy ≥ 6 months, ECOG status ≤ 1, normal organ function and ability to provide informed consent. The aim of the trial was to access objective response rate to the combination of bevacizumab +/− IFN-α, as well as PFS and OS. Patients were staged every 3 months by CT scan and patients with progressive disease were removed from the trial. For inclusion in this retrospective analysis, patients had to have pre-therapy CT imaging of the abdomen that included at least the junction of the third and fourth lumbar regions (L3-L4). Patients with unavailable CT imaging (N=13), insufficient clinical and laboratory data (N=3), and CT imaging that did not include the L3-L4 area (N=4) were excluded from our secondary analysis. A total of 42 patients were included in this post-hoc secondary analysis study.
Clinical and Imaging Data Transfer
Baseline clinical data and CT images were de-identified and coded for analysis. Clinical data evaluated included the following patient characteristics: age, gender, body mass index (BMI), ECOG performance status, time from diagnosis to start of therapy, type of melanoma, specific therapeutic regimen, duration of PFS and OS, reason for termination of therapy, and baseline laboratory measures including serum lactate dehydrogenase (LDH), hemoglobin, platelets, corrected calcium, absolute neutrophils, and serum alkaline phosphatase levels. All patients were followed for a period of two years after completion of treatment in this study. Progression free survival was defined as the time from start of therapy until progressive disease (PD) by RECIST or death. Patients who did not progress or expire (N = 2) were censored at the last available assessment. Overall survival was defined as the time from start of therapy until death from any cause or censored at the date the patient was last known to be alive.
CT Imaging
CT imaging of the chest, abdomen, and pelvis was conducted at baseline with multi-detector row helical acquisitions. The slice thickness for the CT examinations ranged from 3.0 to 7.5 mm; with 88% (37/42) having 5 mm slice thickness. Only one patient had non-.contrast CT imaging, while the remaining 41 patients had CT imaging with intravenous contrast. The digital imaging and communication of medicine (DICOM) format CT images were uploaded to Tera Recon iNtuition Cloud for measurement of abdominal fat.
Fat and abdominal circumference measurements utilizing CT images were performed by an imaging research fellow with final review of all images and measurements by a fellowship-trained abdominal radiologist with 7 years of experience in advanced image processing and volumetric analysis. A single slice at the L3-L4 level was used to make all measurements. The software automatically measures the abdominal circumference in centimeters (cm) at the chosen level. Standard attenuation threshold technique with manual image segmentation of anatomic regions was used to quantify fat area, with fat defined by attenuation thresholds between −30 and −190 Hounsfield Units (HU). Total abdominal fat (TAF) included all fat measured in the slice. Subcutaneous abdominal fat (SAF) segmentation included fat external to the abdominal wall and paravertebral muscles. Visceral abdominal fat (VAF) segmentation included fat deep to the abdominal wall and paravertebral muscles.
Statistical Analysis
The PFS and OS were estimated by the Kaplan-Meier method. Comparison of PFS and OS between subgroups was evaluated by the log-rank test. Univariate Cox proportional hazards models of PFS and OS were repeatedly constructed by including only one demographic, laboratory, clinical or fat variable in each model. The most significant fat variable in the univariate analysis was included in the final multivariate Cox models on PFS and OS. The demographic, laboratory and clinical variables were selected using the backward selection method. The time-dependent variables were created and temporarily included in the Cox models to test the proportional hazards assumption. To assess the prediction accuracy attributable to the fat variable, the reduced models were obtained by removing the fat variable from the final models on PFS and OS. The prediction accuracy of two multivariate Cox models was evaluated by computing the area under the receiver operating characteristic curve (AUC) based on the PFS status at 3 months and OS status at 24 months after initiation of therapy. The difference in AUC was calculated between the final model on PFS or OS and the corresponding reduced model. The bootstrap method was used to find the p value associated with AUC comparison. The Spearman correlation coefficient was used to determine association between VEGF and VFA, SFA and VFA/SFA. All p values were two-sided and p values less than 0.05 being considered significant.
RESULTS
Forty-two patients had adequate imaging for evaluation of visceral and subcutaneous fat area. Patient demographics and characteristics are presented in Table 1. The average body mass index was 27 (range 17–39). The majority of patients had two sites of metastatic disease (40%). The most common sites of disease were lymph node and subcutaneous metastasis (64%) followed by lung (52%). LDH levels ranged from 71–608 U/L (mean = 215 ± 134 U/L). Most patients (30/42) received the combination of bevacizumab and high dose IFN-Α (5–10MU/m2), as this arm of the trial had an overall response rate of 44% (24% PR, 20% SD) and met the full accrual.
Table 1.
Patient Characteristics
| Sex | ||
| Male | 27 (64%) | |
| Female | 15 (36%) | |
| Age (y) [Mean, range] | 59 (31–80) | |
| BMI [Mean, range] | 27 (17–39) | |
| ECOG | ||
| 0 | 33 (79%) | |
| 1 | 9 (21%) | |
| Number of metastatic sites | ||
| 1 | 13 (31%) | |
| 2 | 17 (40%) | |
| 3 | 6 (14%) | |
| ≥4 | 6 (14%) | |
| Sites of metastasis | ||
| Lung | 22 (52%) | |
| Liver | 14 (33%) | |
| Lymph node/Subcutaneous | 27 (64%) | |
| Visceral | 13 (36%) | |
| Treatment | ||
| Bevacizumab | 6 (14%) | |
| Bevacizumab + Low Dose IFN-a | 6 (14%) | |
| Bevacizumab + High Dose IFN-a | 30 (71%) | |
| LDH (U/L) [Mean, range] | 215 (71–608) | |
| Visceral Fat Area cm2(L3–4) [Mean, St Dev] | 187.6 (±104.5) | |
| Subcutaneous Fat Area cm2(L3–4) [Mean, St Dev] | 205.6 (±103.7) | |
| Visceral Fat/Subcuatenous Fat (L3–4) [Mean, St Dev] | 1.01 (±0.54) | |
Note-Data are number for clinical characteristics and treatment.
A single slice at L3–4 was used to make measurements of abdominal fat (Figure 1). Mean total abdominal fat area was 400 cm2 (±170 cm2), subcutaneous fat area (SFA) was 205.6 cm2 (±103.7) and visceral fat area (VFA) was 187.6 cm2 (±104.5 cm2). The ratio of VFA/SFA was 1.01 (± 0.54). Using the median VFA/SFA (0.91) and BMI (27) patients were grouped into high and low VFA/SFA or BMI cohorts. A significant decrease in PFS was observed for patients with high VFA/SFA versus low (p=0.009) but not in patients with high BMI versus low (p=0.881; Figure 2 a,b). Similarly OS was significantly decreased in patients with high VFA/SFA vs low (p=0.007) and no difference was observed for BMI (p=0.774; Figure 2 c,d). Median PFS was 3.25 months and OS was 14.5 months. Cox models were used to evaluate the effects of patient demographics, LDH, site of metastasis, treatment type, VFA, SFA, and the ratio of VFA/SFA on PFS and OS. In the univariate analysis LDH (HR 1.38, 95% CI 1.08–1.76, p=0.009) and liver metastasis (HR 2.82, 95% CI 1.35–5.92, p=0.006), were significant predictors of PFS (Table 2A). When overall survival was analyzed VFA/SFA (HR 1.38, 95% CI 1.04–1.82, p=0.023) was a significant predictor of OS in addition to LDH (HR 1.36, 95% CI 1.07–1.74, p=0.014) and liver metastasis (HR 3.58, 95% CI 1.66–7.72, p=0.001; Table 2B). BMI and treatment type (bevacizumab alone vs combination with low or high dose IFN-α) were not predictive of either PFS or OS. Due to the significance of VFA/SFA on survival in the Kaplan-Meier estimates this factor was included in the multivariate analysis for PFS in addition to the other significant variables. Interestingly, VFA/SFA approached significance (HR 1.32, 95% CI 0.99–1.74, p=0.056) in the multivariate analysis for PFS. LDH and liver metastasis remained significant (HR 1.38, 95% CI 1.05–1.81, p=0.019 and HR 2.41, 95% CI 1.12,−5.18, p=0.025) in the multivariate analysis for PFS. The multivariate analysis confirmed that VFA/SFA (HR 1.60, 95% CI 1.18–2.19, p=0.003), LDH (HR 1.4, 95% CI 1.05–1.86, p=0.021), and liver metastasis (HR 3.52, 95% CI 1.58–7.83, p=0.002) were predictors of OS.
Figure 1.
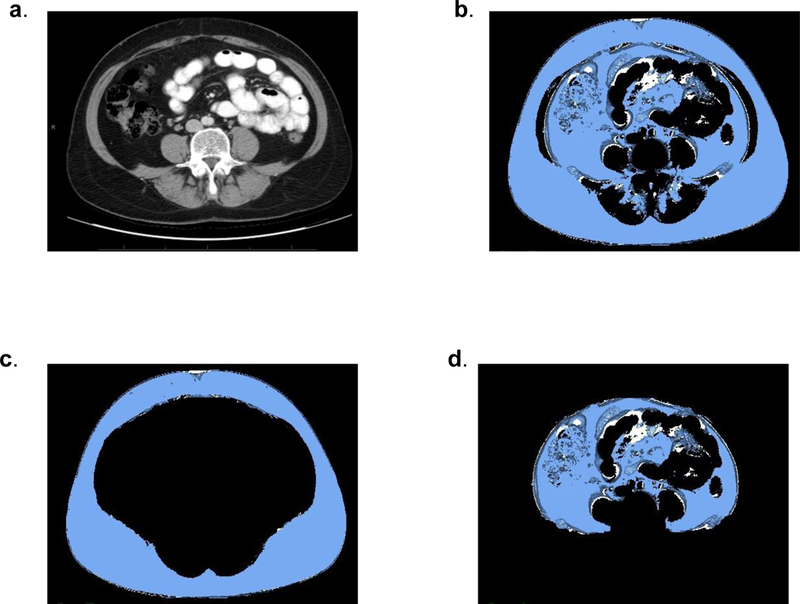
CT imaging of patient with SFA 208 cm2 and VFA 199 cm 2 (VFA/SFA = 1.0). a) A single slice at the L3-L4 level was used to make all measurements. b) Total abdominal fat (TAF) included all fat measured in the slice. c) Subcutaneous abdominal fat (SAF) segmentation included fat external to the abdominal wall and paravertebral muscles. d) Visceral abdominal fat (VAF) segmentation included fat deep to the abdominal wall and paravertebral muscles.
Figure 2.
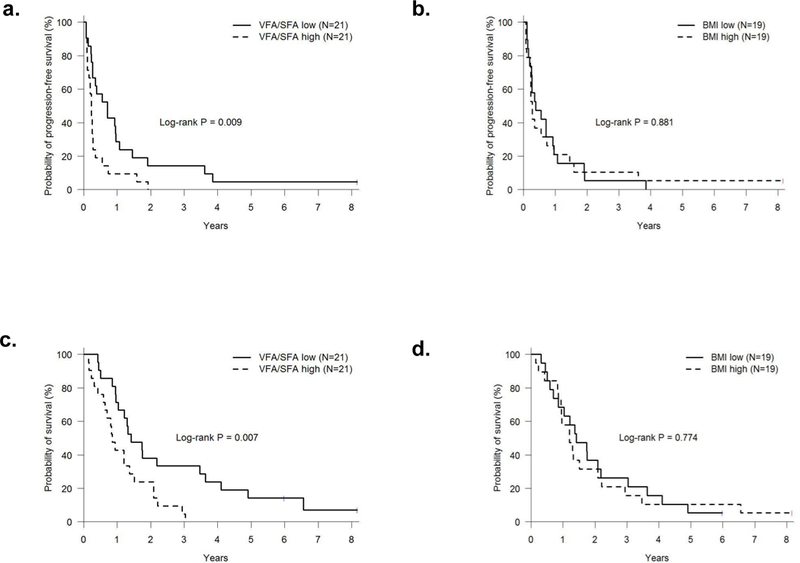
Kaplan-Meier estimated PFS and OS in patients with (a,c) high VFA/SFA versus low and (b,d) high BMI vs low. Significantly worse PFS and OS were observed for those with VFA/SFA above the median. No difference was seen for BMI.
Table 2.
Univariate Analysis of Clinical Characteristics and Fat Variables Associated with Progression Free and Overall Survival
| A. Progression Free Survival | |||
|---|---|---|---|
| HR | 95% CI | p | |
| BMI (each increment of 5) | 1.04 | (0.76, 1.41) | 0.822 |
| Age (each increment of 10 years) | 1.27 | (0.97, 1.67) | 0.087 |
| LDH (each increment of 100 IU/L) | 1.38 | (1.08, 1.76) | 0.009 |
| Gender | 1.33 | (0.70, 2.53) | 0.389 |
| ECOG | 0.72 | (0.34, 1.52) | 0.385 |
| Treatment | |||
| Bevacizumab vs Low Dose IFN + Bevacizumab | 2.35 | (0.72, 7.67) | 0.1 55 |
| Bevacizumab vs High Dose IFN + Bevacizumab | 1.51 | (0.61, 3.76) | 0.375 |
| Lung Metastasis | 1.13 | (0.60, 2.11) | 0.709 |
| Liver Metastasis | 2.82 | (1.35, 5.92) | 0.006 |
| Lymph node metastasis | 0.75 | (0.39, 1.46) | 0.398 |
| Visceral Fat Area (each increment of 100) | 1.13 | (0.85, 1.49) | 0.397 |
| Subcutaneous Fat Area (each increment of 100) | 0.89 | (0.68, 1.18) | 0.421 |
| Ratio Visceral Fat Area/Subcutaenous Fat Area (each increment of 0.5) | 1.19 | (0.91, 1.54) | 0.200 |
| B. Overall Survival | |||
| HR | 95% CI | p | |
| BMI (each increment of 5) | 1.15 | (0.81, 1.63) | 0.442 |
| Age (each increment of 10 years) | 1.24 | (0.95, 1.61) | 0.114 |
| LDH (each increment of 100 IU/L) | 1.36 | (1.07, 1.74) | 0.014 |
| Gender | 1.65 | (0.86, 3.20) | 0.134 |
| ECOG | 0.93 | (0.44, 1.98) | 0.852 |
| Treatment | |||
| Bevacizumab vs Low Dose IFN + Bevacizumab | 2.04 | (0.63, 6.61) | 0.233 |
| Bevacizumab vs High Dose IFN + Bevacizumab | 1.09 | (0.44, 2.72) | 0.854 |
| Lung Metastasis | 1.05 | (0.56, 1.97) | 0.879 |
| Liver Metastasis | 3.58 | (1.66, 7.72 | 0.001 |
| Lymph node metastasis | 0.52 | (0.27, 1.01) | 0.055 |
| Visceral Fat Area (each increment of 100) | 1.24 | (0.94, 1.64) | 0.133 |
| Subcutaneous Fat Area (each increment of 100) | 0.92 | (0.70, 1.20) | 0.523 |
| Ratio Visceral Fat Area/Subcutaenous Fat Area (each increment of 0.5) | 1.38 | (1.04, 1.82) | 0.023 |
HR; Hazard Ration, CI; Confidence Interval
To determine the accuracy of the Cox models for predicting PFS at 3 months and OS at 24 months (Table 3), AUC estimates were calculated using LDH and liver metastasis with or without VFA/SFA. For predicting PFS at 3 months the AUC for LDH and liver metastasis was moderate (AUC = 0.705), this was improved by adding VFA/SFA to the model (AUC = 0.759, Δ AUC 0.054, p=0.373; Figure 2a). AUC for LDH and liver metastasis was also moderate (AUC = 0.786) for predicting OS at 24 months. An improved accuracy was seen with the addition of VFA/SFA to the model for predicting OS at 24 months (AUC = 0.859), however the difference in AUC was not significant (Δ AUC 0.073, p=0.326) (Figure 2b).
Table 3.
Multivariate Analysis of Clinical Characteristicsand Fat Variables Associated with Progression Free Survival and Overall Survival
| A. Progression Free Survival | |||
|---|---|---|---|
| Model 1 | |||
| HR | 95% CI | p | |
| LDH (each increment of 100 IU/L) | 1.30 | (1.00, 1.70) | 0.053 |
| Liver Metastasis | 2.35 | (1.09, 5.05) | 0.029 |
| Model 2 | |||
| HR | 95% CI | p | |
| LDH (each increment of 100 IU/L) | 1.38 | (1.05, 1.81) | 0.019 |
| Liver Metastasis | 2.41 | (1.12, 5.18) | 0.025 |
| Visceral Fat/Subcutaneous Fat Ratio (each increment of 0.5) | 1.32 | (0.99, 1.74) | 0.056 |
| B. Overall Survival | |||
| Model 1 | |||
| HR | 95% CI | p | |
| LDH (each increment of 100 IU/L) | 1.30 | (0.98, 1.71) | 0.070 |
| Liver Metastasis | 3.10 | (1.42, 6.76) | 0.005 |
| Model 2 | |||
| HR | 95% CI | p | |
| LDH (each increment of 100 IU/L) | 1.40 | (1.05, 1.86) | 0.021 |
| Liver Metastasis | 3.52 | (1.58, 7.83) | 0.002 |
| Visceral Fat/Subcutaneous Fat Ratio (each increment of 0.5) | 1.60 | (1.18, 2.19) | 0.003 |
HR; Hazard Ration, CI; Confidence Interval
In a subset (n=17) of the study population, baseline VEGF was measured as previously described (9). The mean baseline VEGF was 95.9 (0–139). On univariate analysis, VEGF levels were not significantly associated with overall survival (HR 1.0, 95% CI 0.99–1.0, p=0.598). Baseline VEGF levels were compared to VFA, as visceral fat is known to produce high levels of VEGF. There was a weak correlation between baseline VEGF and VFA (r=0.33). SFA and VFA/SFA were also compared to VEGF, and no correlation was identified (r= 0.048 and r=0.011, respectively).
DISCUSSION
In this study we found VFA/SFA to be a significant predictor of OS, in addition to LDH and liver metastasis. LDH has been established as a predictive biomarker in metastatic melanoma. Specifically, we have shown it to be predictor of PFS and OS in this study population17. Melanoma metastasis to visceral organs other than lung has the worst prognosis with a 1 year overall survival of 33% as compared to subcutaneous or lung metastasis (62% and 53% respectively)18. The addition of VFA/SFA improved the accuracy of predicting PFS at 3 months and OS at 24 months over LDH and liver metastasis alone in this group of patients treated with bevacziumab ± IFN-α.
There has long been a link between obesity and cancer; however, BMI has not been able to be specifically linked to outcomes. Abdominal fat can be measured on CT and accurately discerns the contribution of visceral fat and subcutaneous fat6. In colorectal cancer patients increased VFA/SFA is associated with decreased disease-free survival and a trend towards decreased OS. In rectal cancer, it has been postulated that chemotherapy doses may be better calculated based on visceral adiposity than BMI19,20. In patients with colorectal cancer treated with bevacizumab, increased VFA was associated with worse response, time to progression (TTP) and OS. There was no association between VFA and response, TTP or OS in the chemotherapy group. This suggests that VFA may be a specific biomarker for patients treated with antiangiogenic therapy7. Similarly in a study of renal cell carcinoma patients that were treated with anti-angiogenic versus cytokine therapy, VFA was associated with shorter TTP and OS.
Visceral fat appears to be the major contributor to the cytokine derangements that are associated with obesity and cancer. The cytokine profile of adipose tissue includes specific adipocytokines; adiponectin, leptin, resistin and visfatin. It also produces cytokines that can be generated at multiple sites in the body such as TNF, IL-6, IL-1 and CCL221. Adiponectin is anti-inflammatory and levels of this cytokine are decreased in persons with a large visceral fat component. Notably, adiponectin has been shown to be anti-angiogenic and have anti-tumor effects22. Conversely, leptin exerts pro-inflammatory and pro-angiogenic effects and has been shown to promote tumor growth in melanoma and upregulate the secretion of VEGF21,23. Visceral fat has been shown to be a greater source of VEGF as compared to subcutaneous fat24. We found a weak association between serum VEGF levels and VFA, though our samples size was small (N = 17), making it difficult to draw conclusions regarding this data.
Survival in metastatic melanoma is improving with the use of new targeted agents. In metastatic melanoma, anti-angiogenic therapy has provided stability of disease but has not had a large treatment effect. As the use of target therapies such as anti-angiogenic therapies increases, the need for biomarkers to predict response and aid in choosing therapies is needed. In this study, VFA/SFA was a predictor of OS in addition to other well-known factors in melanoma. Taken together with other studies of body fat distribution, it appears that measurements of abdominal fat compartments are emerging as a potential biomarker for predicting response to anti-angiogenic therapy.
Figure 3.
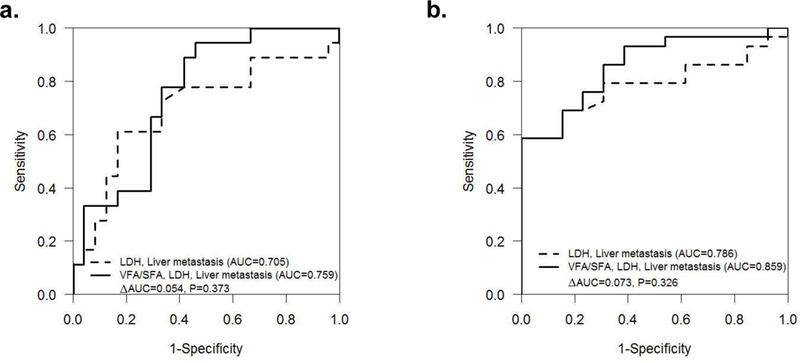
Receiver operating characteristics analysis shows accuracy (AUC) of various models for predicting (a) PFS at 3 months and (b) OS at 24 months.
Abbreviations:
- VFA
Visceral fat area
- SFA
Subcutaneous fat area
References
- 1.Calle EE, Kaaks R. Overweight, obesity and cancer: epidemiological evidence and proposed mechanisms. Nat Rev Cancer. 2004. August; 4(8):579–91. [DOI] [PubMed] [Google Scholar]
- 2.Samanic C, Gridley G, Chow WH, Lubin J, Hoover RN, Fraumeni JF Jr. Obesity and cancer risk among white and black United States veterans. Cancer Causes Control. 2004. February; 15(1):35–43. [DOI] [PubMed] [Google Scholar]
- 3.Renehan AG, Tyson M, Egger M, Heller RF, Zwahlen M. Body-mass index and incidence of cancer: a systematic review and meta-analysis of prospective observational studies. Lancet. 2008. February 16; 371(9612):569–78. [DOI] [PubMed] [Google Scholar]
- 4.Cao Y Angiogenesis modulates adipogenesis and obesity. J Clin Invest. 2007. September; 117(9):2362–8. [DOI] [PMC free article] [PubMed] [Google Scholar]
- 5.Miyazawa-Hoshimoto S, Takahashi K, Bujo H, Hashimoto N, Saito Y. Elevated serum vascular endothelial growth factor is associated with visceral fat accumulation in human obese subjects. Diabetologia. 2003. November; 46(11):1483–8. [DOI] [PubMed] [Google Scholar]
- 6.Yoshizumi T, Nakamura T, Yamane M, et al. Abdominal fat: standardized technique for measurement at CT. Radiology. 1999. April; 211(1):283–6. [DOI] [PubMed] [Google Scholar]
- 7.Guiu B, Petit JM, Bonnetain F, et al. Visceral fat area is an independent predictive biomarker of outcome after first-line bevacizumab-based treatment in metastatic colorectal cancer. Gut. 2010. March; 59(3):341–7. [DOI] [PubMed] [Google Scholar]
- 8.Ladoire S, Bonnetain F, Gauthier M, et al. Visceral fat area as a new independent predictive factor of survival in patients with metastatic renal cell carcinoma treated with antiangiogenic agents. Oncologist. 2011; 16(1):71–81. [DOI] [PMC free article] [PubMed] [Google Scholar]
- 9.Grignol VP, Olencki T, Relekar K, et al. A phase 2 trial of bevacizumab and high-dose interferon alpha 2B in metastatic melanoma. Immunother. 2011. Jul-Aug; 34(6):509–15. [DOI] [PMC free article] [PubMed] [Google Scholar]
- 10.Guenterberg KD, Grignol VP, Relekar KV, et al. A pilot study of bevacizumab and interferon-α2b in ocular melanoma. Am J Clin Oncol. 2011. February; 34(1):87–91. [DOI] [PMC free article] [PubMed] [Google Scholar]
- 11.Varker KA, Biber JE, Kefauver C, et al. A randomized phase 2 trial of bevacizumab with or without daily low-dose interferon alfa-2b in metastatic malignant melanoma. Ann Surg Oncol. 2007. August; 14(8):2367–76. [DOI] [PubMed] [Google Scholar]
- 12.Del Vecchio M, Mortarini R, Canova S, et al. Bevacizumab plus fotemustine as first-line treatment in metastatic melanoma patients: clinical activity and modulation of angiogenesis and lymphangiogenesis factors. Clin Cancer Res. 2010. December 1;16(23):5862–72. [DOI] [PubMed] [Google Scholar]
- 13.Kim KB, Sosman JA, Fruehauf JP, et al. BEAM: a randomized phase II study evaluating the activity of bevacizumab in combination with carboplatin plus paclitaxel in patients with previously untreated advanced melanoma. J Clin Oncol. 2012. January 1; 30(1):34–41. [DOI] [PMC free article] [PubMed] [Google Scholar]
- 14.Vihinen PP, Hernberg M, Vuoristo MS, et al. A phase II trial of bevacizumab with dacarbazine and daily low-dose interferon-alpha2a as first line treatment in metastatic melanoma. Melanoma Res. 2010; 20(4):318–25. [DOI] [PubMed] [Google Scholar]
- 15.Perez DG, Suman VJ, Fitch TR, et al. Phase 2 trial of carboplatin, weekly paclitaxel, and biweekly bevacizumab in patients with unresectable stage IV melanoma: a North Central Cancer Treatment Group study, N047A. Cancer. 2009;115(1):119–27. [DOI] [PMC free article] [PubMed] [Google Scholar]
- 16.Gonzalez-Cao M, Viteri S, Diaz-Lagares A, et al. Preliminary Results of the Combination of Bevacizumab and Weekly Paclitaxel in Advanced Melanoma. Oncology. 2008;74(1–2):12–16. [DOI] [PubMed] [Google Scholar]
- 17.Gray MR, Martin del Campo S, Zhang X, Zhang H, Souza FF, Carson WE 3rd, Smith AD. Metastatic melanoma: lactate dehydrogenase levels and CT imaging findings of tumor devascularization allow accurate prediction of survival in patients treated with bevacizumab. Radiology. 2014. February;270(2):425–34. [DOI] [PMC free article] [PubMed] [Google Scholar]
- 18.Balch CM, Gershenwald JE, Soong SJ, et al. Final version of 2009 AJCC melanoma staging and classification. J Clin Oncol. 2009. December 20; 27(36):6199–206. [DOI] [PMC free article] [PubMed] [Google Scholar]
- 19.Moon HG, Ju YT, Jeong CY, et al. Visceral obesity may affect oncologic outcome in patients with colorectal cancer. Ann Surg Oncol. 2008. July; 15(7):1918–22. [DOI] [PubMed] [Google Scholar]
- 20.Clark W, Siegel EM, Chen YA, et al. Quantitative measures of visceral adiposity and body mass index in predicting rectal cancer outcomes after neoadjuvant chemoradiation. J Am Coll Surg. 2013. June; 216(6):1070–81. [DOI] [PMC free article] [PubMed] [Google Scholar]
- 21.Tilg H, Moschen AR. Adipocytokines: mediators linking adipose tissue, inflammation and immunity. Nat Rev Immunol. 2006. October; 6(10):772–83. [DOI] [PubMed] [Google Scholar]
- 22.Bråkenhielm E, Veitonmäki N, Cao R, et al. Adiponectin-induced antiangiogenesis and antitumor activity involve caspase-mediated endothelial cell apoptosis. Proc Natl Acad Sci USA. 2004. February 24; 101(8):2476–81. [DOI] [PMC free article] [PubMed] [Google Scholar]
- 23.Brandon EL, Gu JW, Cantwell L, He Z, Wallace G, Hall JE. Obesity promotes melanoma tumor growth: role of leptin. Cancer Biol Ther. 2009. October; 8(19):1871–9. [DOI] [PMC free article] [PubMed] [Google Scholar]
- 24.Miyazawa-Hoshimoto S, Takahashi K, Bujo H, Hashimoto N, Yagui K, Saito Y. Roles of degree of fat deposition and its localization on VEGF expression in adipocytes. Am J Physiol Endocrinol Metab. 2005. June; 288(6):E1128–36. [DOI] [PubMed] [Google Scholar]