

Abstract
Objectives—
To assess performance of shear wave elastography for evaluation of fibrosis and the histologic stage in patients with autoimmune liver disease (ALD) and to validate previously established advanced fibrosis cutoff values in this cohort.
Methods—
Shear wave elastography was performed on patients with ALD with an Aixplorer ultrasound system (SuperSonic Imagine, Aix-en-Provence, France) using an SC6–1 transducer. The median estimated tissue Young modulus was calculated from sets of 8 to 10 elastograms. A blinded, subspecialty-trained pathologist reviewed biopsy specimens. The METAVIR classification was used to stage liver fibrosis and necroinflammation. Steatosis was graded from 0 to 4+. The Kendall τ-b correlation test was performed to identify the correlation between the estimated tissue Young modulus and fibrosis, steatosis, and the necroinflammatory score. The Spearman correlation test was performed to identify the correlation between the estimated tissue Young modulus and clinical data. The diagnostic performance of shear wave elastography for differentiating METAVIR stage F2 or higher from F0 and F1 fibrosis was evaluated by a receiver operating characteristic (ROC) curve analysis.
Results—
Fifty-one patients with ALD were analyzed. The estimated tissue Young modulus was positively correlated with the fibrosis stage and necroinflammation score (r = 0.386; P < .001; r = 0.338; P = .002, respectively) but not steatosis (r = −0.091; P = .527). Serum aspartate aminotransferase, alanine aminotransferase, and total bilirubin values were positively correlated with the estimated tissue Young modulus (r = 0.501; P < .001; r = 0.44; P = .001; r = 0.291; P = .038). The serum albumin value was negatively correlated (r = −0.309; P = .033). The area under the ROC curve was 0.781 (95% confidence interval, 0.641–0.921) for distinguishing F2 or greater fibrosis from F0 and F1 fibrosis. Based on the ROC curve, an optimal cutoff value of 9.15 kPa was identified (sensitivity, 83.3%; specificity, 72.7%).
Conclusions—
Shear wave elastography is a novel noninvasive adjunct to liver biopsy in evaluation and staging of patients with ALD, showing the potential for serial evaluations of disease progression and treatment responses.
Keywords: autoimmune liver disease, cutoff value, liver fibrosis, shear wave elastography, ultrasound
Autoimmune liver disease (ALD) includes a number of diseases: autoimmune hepatitis (AIH), primary biliary cirrhosis (PBC), primary sclerosing cholangitis (PSC), and the “overlap” syndromes in which more than 1 of these conditions is present.1 Autoimmune hepatitis is a chronic type of hepatitis characterized by interface hepatitis, hypergammaglobulinemia, and autoantibodies. It affects patients of all ages and is associated with substantial morbidity and mortality if not properly treated.2–4 Primary biliary cirrhosis is a chronic cholestatic liver disease characterized by the progressive destruction of the intrahepatic bile ducts.5 It most often affects middle-aged women.1 Primary sclerosing cholangitis is a cholestatic liver disease characterized by stricturing of larger intrahepatic or extrahepatic bile ducts. Among the overlap syndromes, AIH-PBC overlap syndrome is the most common. These diseases share a common progression pathway.6 Without timely and appropriate intervention, fibrosis may progress to cirrhosis, with an elevated risk of hepatocellular carcinoma and, ultimately, liver failure.7
The goal of management in these conditions is to prevent disease progression to irreversible liver failure.8 Early detection and staging of fibrosis are helpful for risk stratification and evaluating the therapeutic response. Therefore, the identification and classification of the stage of liver fibrosis are of value in the treatment of patients with ALD.
Nonfocal liver biopsy is considered the reference standard for evaluating hepatic fibrosis.9 However, liver biopsy is both invasive and expensive. In addition, it is susceptible to sampling errors as well as interobserver and intraobserver variability in fibrosis staging.10–12 Therefore, alternative noninvasive methods for diagnosing and stage liver fibrosis have been sought.13 Surrogate imaging techniques and blood markers have been shown to have varying accuracies in predicting liver fibrosis.8 A variety of imaging techniques have been applied, including morphologic analysis, computed tomographic perfusion, magnetic resonance perfusion, diffusion-weighted imaging, and magnetic resonance elastography.14–17 Recent studies have investigated the utility of transient elastography and magnetic resonance elastography in patients with AIH.18–20
Advances in ultrasound (US) technology have enabled noninvasive and quantitative measurements of liver stiffness with various US-based elastographic methods, including transient elastography, acoustic radiation force impulse imaging, and shear wave elastography (SWE). Both transient elastography and acoustic radiation force impulse imaging have been evaluated in several studies for their roles in staging liver fibrosis and have shown high accuracy for the diagnosis of cirrhosis and intermediate accuracy for differentiation between mild and moderate liver fibrosis.21–23
Shear wave elastography is a new real-time technique using measurements of acoustically generated tissue shear wave propagation speeds to derive liver stiffness estimates. This technique has been applied in the diagnosis of liver fibrosis in chronic liver disease caused by hepatitis virus B or C and in those with alcoholic liver disease or nonalcoholic fatty liver disease.8,24,25 In a previous study, we reported that a threshold value of 7.29 kPa differentiated METAVIR stage F2 or higher from F0 and F1 in patients with chronic liver disease with sensitivity and specificity of 91.4% and 52.5%, respectively.8 The aims of this study were to assess the performance of SWE in the evaluation of fibrosis in patients with ALD and to validate previously established estimated tissue Young modulus cutoff values for fibrosis in this cohort of patients.
Materials and Methods
Design Overview and Study Population
This pilot study was approved by the Institutional Review Board and compliant with the Health Insurance Portability and Accountability Act. Patients with known or suspected ALD on the basis of biochemical, serologic, or radiologic findings and scheduled for a US-guided nonfocal liver biopsy were eligible. Patients younger than 18 years and those who had transplantations were excluded. The Institutional Review Board waived the requirement to obtain informed consent for this study. All patients underwent an SWE examination performed by a single sonographer with 16 years of experience in assisting biopsy procedures in the interventional radiology US suite. This sonographer also had more than 5 years of experience in performing SWE. Nonfocal liver biopsies were subsequently performed under US guidance.
Shear Wave Elastography
Shear wave elastography was performed with an Aixplorer US system (SuperSonic Imagine, Aix-en-Provence, France) equipped with a convex broadband transducer (SC6–1). The technology measures the propagation velocity of acoustically generated tissue shear waves to estimate liver stiffness, expressed in kilopascals, and termed the Young modulus. The Aixplorer provides anatomic B-mode US images and elastographic color maps simultaneously, permitting selection of specific regions of liver parenchyma free of blood vessels or lesions for analysis. Shear wave elastographic measurements were obtained in the upper right hepatic lobe at the end of normal expiration via an intercostal acoustic window. By protocol, the SWE region of interest was placed at a depth of less than 6 cm from the skin surface and at least 1 cm deep to the liver capsule. Shear wave elastographic measurements were recorded only when the region of interest (with fixed dimension of 10 × 10 mm) was filled with color. Only regions that avoided blood vessels and portal tracts were used. Most examinations comprised 10 sequential measurements. In some cases, fewer measurements were made. If fewer than 8 measurements were made, the case was excluded from this study. The median value of the measurements was used for the analysis.
Shear Wave Elastographic Image Review
A review of all SWE images was performed by a research fellow (M.D.) with 3 years of elastography experience. The exclusion criteria for the SWE images were as follows: (1) if a minimum of 8 measurements was not obtained; (2) the region of interest had poor color fill-in; (3) the region of interest was placed just below the liver capsule or greater than 5 cm from the skin.
Liver Biopsy
Nonfocal liver biopsy was performed under US guidance in the Interventional Radiology Department of our hospital. Patients gave biopsy consent and were given local anesthesia and conscious sedation before the procedure. All liver biopsy specimens were obtained from the upper right lobe by using a 16-gauge biopsy instrument (Bio-Pince; Medical Device Technologies, Inc, Gainesville, FL). All specimens were fixed in formalin and then embedded in paraffin.
Histologic Examination
The liver biopsy specimens were reviewed by a single subspecialist pathologist (A.K.B.) with 29 years of experience, who was blinded to the clinical information and estimated tissue Young modulus. The length of each specimen and the number of portal tracts visualized were recorded. A biopsy sample at least 1 cm long with visualization of a minimum of 3 portal triads was considered adequate for the histologic examination. The METAVIR staging system was used to stage liver fibrosis and calculate the necroinflammation scores.26 In the METAVIR system, fibrosis is graded on a 5-point ordinal scale from 0 to 4: (F0, no fibrosis; F1, enlarged fibrotic portal tract; F2, few portal-portal septa but intact architecture; F3, numerous septa with architectural distortion but no obvious cirrhosis; and F4, cirrhosis). The necroinflammatory score was calculated based on the scores of piecemeal or interface hepatitis (score 0–3) and lobular hepatitis (score 0–2) to provide a total necroinflammatory activity score of 0 to 3 (also classified as A0–A3).26 Steatosis was independently classified as S0 (absent), S1 (<5%), S2 (5%–33%), S3 (34%–66%), and S4 (>66%). Independent of the research pathologic interpretation and reporting, clinical notes were reviewed, and the clinically reported PBC staging system, which was classified as S0 (normal), S1 (portal stage), S2 (periportal stage), S3 (septal stage), and S4 (biliary cirrhosis), was recorded when available.
Statistical Analyses
All statistical analyses were performed with SPSS version23.0 software (IBM Corporation, Armonk, NY). Data were expressed as mean ± standard deviation. The Kendall τ-b correlation test was performed to identify the correlation between the estimated tissue Young modulus and fibrosis, steatosis, and the METAVIR necroinflammatory score. The Spearman correlation test was performed to identify the correlation between the estimated tissue Young modulus and clinical data. The diagnostic performance of SWE in differentiating substantial fibrosis (F≥2) from lower fibrosis stages (F0 and F1) was evaluated by a receiver operating characteristic (ROC) curve analysis. The area under the receiver operating characteristic curve (AUROC) was calculated. A mathematically optimal cutoff value (by maximizing the You-den index) was computed by an online generator (http://vassarstats.net/clin1.html) to report the point sensitivity, specificity, positive predictive value (PPV), negative predictive value (NPV), positive likelihood ratio (LR), and negative LR. Confidence intervals (CIs) were calculated by an online CI generator (https://www2.ccrb.cuhk.edu.hk/stat/confidence%20interval/Diagnostic%20Statistic.htm). P < .05 was considered statistically significant.
Results
According to the histologic results, patients with other diffuse liver diseases such as hepatitis C viral disease, hepatitis B viral disease, nonalcoholic fatty liver disease, and alcoholic liver disease were excluded from this study. A total of 51 patients (11 women and 40 men; mean age, 50.80 ± 15.21 years) with autoimmune disease (PBC, n = 24; AIH, n = 20; PSC, n = 4; and overlap syndrome, n = 3) were enrolled and analyzed (Figure 1). The indication for liver biopsy was for follow-up of known ALD in 64.7% of patients (n = 33) and for tissue diagnosis in 35.3% of patients (n = 18; Table 1). Based on the results of pathologic examinations, 6 patients had no fibrosis; 27 patients had F1 fibrosis; 9 patients had F2 fibrosis; and 9 patients had F3 fibrosis. No patient had F4 fibrosis.
Figure 1.
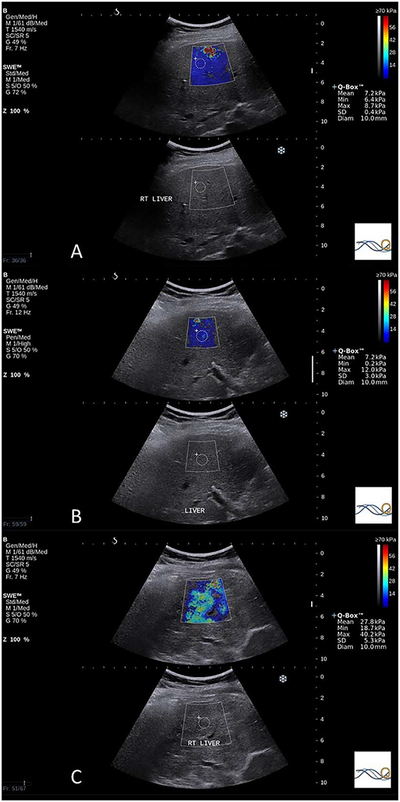
Examples of the estimated tissue Young modulus obtained from patients with ALD. A, Median estimated tissue Young modulus of 6.85 kPa in a patient with a METAVIR fibrosis grade of F0, necroinflammatory score of 0, steatosis grade of S2, and PBC stage of S0. B, Median estimated tissue Young modulus of 11.30 kPa in a patient with a METAVIR fibrosis grade of F1, necroinflammatory score of 2, steatosis grade of S1, and PBC stage of S0; C, Median estimated tissue Young modulus of 25.75 kPa in this patient with a METAVIR fibrosis grade of F3, necroinflammatory score of 2, steatosis grade of S2, and PBC stage of S3.
Table 1.
Patient Characteristics
| Characteristic | Value |
|---|---|
| Age, y | 50.80 ± 15.21 |
| Female/male | 11/40 |
| Race | |
| White | 41 |
| Asian | 1 |
| Black | 4 |
| Hispanic | 1 |
| Unknown/declinec | 4 |
| Clinical markers | |
| AST, IU/L | 99.94 ± 235.30 |
| ALT, IU/L | 153.33 ± 458.53 |
| ALP, IU/L | 146.80 ± 112.41 |
| Serum albumin, G/dL | 4.23 ± 0.43 |
| Platelet count, K/μL | 260.00 ± 71.86 |
| Total bilirubin, mg/dL | 0.86 ± 1.32 |
| Distribution of disease etiology | |
| PBC | 24 |
| AIH | 20 |
| PSC | 4 |
| Overlap syndrome | 3 |
| Reason for liver biopsy | |
| Follow-up of known ALD | 33 |
| Diagnostic | 18 |
Data are presented as mean ± SD where applicable.
For patients with chronic autoimmune diseases, the mean estimated tissue Young modulus values for stages of F0 to F3 were 7.58, 8.75, 12.35, and 16.49 kPa, respectively. Patients with F3 fibrosis had the largest variation (SD, 10.44 kPa), whereas patients with no fibrosis (F0) had the smallest variation (SD, 1.86 kPa; Table 2). According to the Kendall τ-b correlation analysis, the fibrosis stage and necroinflammation score were moderately correlated with the estimated tissue Young modulus (r = 0.386; P < .001; r = 0.338; P = .002, respectively). The PBC stage was also moderately correlated with the estimated tissue Young modulus (r = 0.482; P = .003). Steatosis did not correlate with the estimated tissue Young modulus (r = −0.066; P = .551). These parameters are summarized in Table 3.
Table 2.
Summary of Estimated Tissue Young Modulus in Patients With ALD
| Parameter | F0 | F1 | F2 | F3 |
|---|---|---|---|---|
| Total, n (%) | 6 (11.8) | 27 (53) | 9 (17.6) | 9 (17.6) |
| Mean | 7.58 | 8.75 | 12.35 | 16.49 |
| SD | 1.86 | 4.24 | 7.45 | 10.44 |
| Median | 6.975 | 7.7 | 9.8 | 13.2 |
| Minimum | 6.0 | 4.4 | 5.9 | 7.7 |
| Maximum | 10.85 | 27.75 | 28.3 | 40.15 |
Table 3.
Correlation Between Estimated Tissue Young Modulus and Fibrosis, Steatosis, and Necroinflammation
| Histopathologic Finding | Kendall τ-b Correlation With SWE Value | Patients (%) | ||||
|---|---|---|---|---|---|---|
| Fibrosis | P<.001; r = 0.386 | F0 | F1 | F2 | F3 | F4 |
| 6 (11.8) | 27 (53.0) | 9 (17.6) | 9 (17.6) | 0 (0) | ||
| Steatosis | P = .551; r = −0.066 | S0 | S1 | S2 | S3 | S4 |
| 28 (54.9) | 14 (27.5) | 5 (9.8) | 4 (7.8) | 0 (0) | ||
| Total activity score | P = .002; r = 0.338 | A0 | A1 | A2 | A3 | |
| 12 (23.5) | 24 (47.1) | 11 (21.6) | 4 (7.8) | |||
| PBC stage | P = .003; r = 0.482 | S0 | S1 | S2 | S3 | S4 |
| 1 | 9 | 7 | 5 | 2 | ||
The correlations between the clinical data of enrolled patients and estimated tissue Young modulus were also calculated. According to the results of the Spearman correlation analysis, for all of the included patients, the values of aspartate aminotransferase (AST), alanine aminotransferase (ALT), and total bilirubin had positive correlations with the estimated tissue Young modulus (r = 0.501; P < .001; r = 0.44; P = .001; r = 0.291; P = .038), whereas the serum albumin value was negatively correlated with the estimated tissue Young modulus (r = −0.309; P = .033). In patients with PBC, AST and ALT values were positively correlated with the estimated tissue Young modulus (r = 0.473; P = .020; r = 0.413; P = .045). For patients with AIH, the values of AST, ALT, alkaline phosphatase (ALP), and total bilirubin were positively correlated with the estimated tissue Young modulus (r = 0.579; P = .008; r = 0.489; P = .029; r = 0.600; P = .005; r = 0.519; P = .019). These results are summarized in Table 4.
Table 4.
Correlation Between Estimated Tissue Young Modulus and Clinical Data
| Clinical Data | Spearman Correlation With Median Estimated Tissue Young Modulus | ||
|---|---|---|---|
| All Patients | PBC | AIH | |
| AST | P<.001; r = 0.501 | P = .020; r = 0.473 | P = .008; r = 0.579 |
| ALT | P = .001; r = 0.440 | P = .045; r = 0.413 | P = .029; r = 0.489 |
| ALP | P = .160; r = 0.200 | P = .812; r = 0.051 | P = .005; r = 0.600 |
| Serum albumin | P = .033; r = −0.309 | P = .063; r = −0.403 | P = .114; r = −0.375 |
| Platelet count | P = .607; r = −0.074 | P = .687; r = −0.087 | P = .769; r = −0.070 |
| Total bilirubin | P = .038; r = 0.291 | P = .906; r = −0.026 | P = .019; r = 0.519 |
| Antimitochondrial antibody | P = .086; r = −0.278 | P = .215; r = −0.269 | Not applicable |
| Immunoglobulin M | P = .915; r = −0.019 | P = .517; r = 0.198 | P = .781; r = 0.079 |
| Anti-smooth muscle antibody | P = .233; r = −0.225 | P = .244; r = −0.406 | P = .207; r = −0.392 |
| Antinuclear antibody | P = .218; r = −0.187 | P = .101; r = −0.367 | P = .190; r = −0.324 |
| Immunoglobulin G | P = .057; r = 0.307 | P = .208; r = 0.358 | P = .358; r = 0.230 |
The ROC analysis of the ability of SWE to differentiate higher stages of fibrosis (F≥2) from lower stages of fibrosis (F0 and F1; Figure 2) yielded an AUROC of 0.781 (95% CI, 0.641–0.921). A mathematically optimal cutoff value of 9.15 kPa was obtained on the basis of the ROC curve, yielding 83.3% sensitivity and 72.7% specificity (Table 5).
Figure 2.

Receiver operating characteristic curve for differentiation of fibrosis stage F2 or higher from stages F0 and F1.
Table 5.
Diagnostic Performance of SWE in Patients With ALD
| Parameter | F0 and F1 vs F2 and F3 |
|---|---|
| AUROC (95% CI) | 0.781 (0.641–0.921) |
| Optimal cutoff value, kPa | 9.15 kPa |
| Sensitivity (95% CI), % | 83.3 (60.8–94.2) (15/18) |
| Specificity (95% CI), % | 72.7 (55.8–84.9) (24/33) |
| PPV (95% CI), % | 62.5 (42.7–78.8) (15/24) |
| NPV (95% CI), % | 88.9 (71.9–96.1) (24/27) |
| Positive LR (95% CI) | 3.06 (1.69–5.54) |
| Negative LR (95% CI) | 0.23 (0.08–0.66) |
We divided the patients into 2 subgroups based on biopsy indication: patients following known liver disease and patients undergoing initial diagnosis. The cutoff value of 9.15 kPa provided sensitivity of 84.6% and specificity of 75% in the follow-up group and sensitivity of 80.0% and specificity of 69.2% in the initial diagnosis group (Table 6).
Table 6.
Diagnostic Performance of SWE by Indication for Biopsy
| Parameter | Follow-up of Known ALD | Tissue Diagnosis |
|---|---|---|
| Patients | 33 | 18 |
| Optimal cutoff value, kPa | 9.15 | 9.15 |
| Sensitivity (95% CI), % | 84.6 (57.8–95.7) (11/13) | 80.0 (37.6–96.4) (4/5) |
| Specificity (95% CI), % | 75.0 (53.1–88.8) (15/20) | 69.2 (42.4–87.3) (9/13) |
| PPV (95% CI), % | 68.8 (44.4–85.8) (11/16) | 50.0 (21.5–78.5) (4/8) |
| NPV (95% CI), % | 88.2 (65.7–96.7) (15/17) | 90.0 (59.6–98.2) (9/10) |
| Positive LR (95% CI), % | 3.385 (1.53–7.485) | 2.6 (1.03–6.56) |
| Negative LR (95% CI), % | 0.205 (0.056–0.752) | 0.29 (0.048–1.73) |
In a prior study, we reported a cutoff value of 7.29 kPa to differentiate fibrosis stages F≥2 from F0 and F1 in patients with chronic liver disease, with sensitivity and specificity of 91.4% and 52.5%, respectively.8 In this new patient cohort, our previously established cutoff value yielded comparable sensitivity of 88.9% and specificity of 39.4% for the ALD group as a whole (Table 7). We also determined the diagnostic performance of this previously established cutoff value in the subgroups of patients with PBC and AIH (Table 7).
Table 7.
Comparison Between our Initial Data Set and This New Cohort of Patients With ALD
| Parameter | Initial Data Set | ALD | PBC | AIH |
|---|---|---|---|---|
| Patients | 136 | 51 | 24 | 20 |
| Cutoff for METAVIR F≥2 fibrosis, kPa | 7.29 | 7.29 | 7.29 | 7.29 |
| Sensitivity (95% CI), % | 91.4 (75.6–97.8) (32/35) | 88.9 (67.2–96.9) (16/18) | 87.5 (52.9–97.8) (7/8) | 85.7 (48.7–97.4) (6/7) |
| Specificity (95% CI), % | 52.5 (42.3–62.4) (53/101) | 39.4 (24.7–56.3) (13/33) | 43.8 (23.1–66.8) (7/16) | 38.5 (17.7–64.5) (5/13) |
| PPV (95% CI), % | 40.0 (29.4–51.6) (32/80) | 44.4 (29.5–60.4) (16/36) | 43.8 (23.1–66.8) (7/16) | 42.9 (21.4–67.4) (6/14) |
| NPV (95% CI), % | 94.6 (84.2–98.6) (53/56) | 86.7 (62.1–96.3) (13/15) | 87.5 (52.9–97.8) (7/8) | 83.3 (43.6–97.0) (5/6) |
| Positive LR (95% CI) | 1.92 (1.53–2.41) | 1.47 (1.07–2.02) | 1.56 (0.94–2.58) | 1.39 (0.82–2.36) |
| Negative LR (95% CI) | 0.16 (0.05–0.49) | 0.28 (0.07–1.11) | 0.29 (0.04–1.94) | 0.37 (0.05–2.59) |
Discussion
Autoimmune liver disease treatment and the prognosis depend on the disease stage. Given the risks and limitations of percutaneous liver biopsy, surrogate techniques, including imaging and serum markers, are being developed and examined for noninvasive assessment of ALD stages.27,28 Shear wave elastography is a promising US technique that has the potential to provide noninvasive and quantitative assessments of tissue stiffness. Previous studies have evaluated the diagnostic performance of SWE for liver fibrosis estimation in patients with chronic hepatitis C and chronic hepatitis B.24,25,29 Those studies suggest that SWE has the potential to measure hepatic fibrosis noninvasively and accurately. We aimed to assess SWE for fibrosis staging in patients with ALD.
Our results indicate a moderate correlation between the fibrosis stage, necroinflammation score, PBC stage, and estimated tissue Young modulus (r = 0.386; P < .001; r = 0.338; P = .002; r = 0.482; P = .003, respectively). These results are consistent with our prior study and the findings of other investigators.30,31 Similarly, the lack of a correlation with steatosis is concordant with the literature.32–34
Some serum markers have been proposed as alternatives to liver biopsy for the evaluation of fibrosis in chronic liver disease. The serum total bilirubin level, serum albumin level, ALP level, and platelet count have been reported to be individually linked with survival in patients with PSC.35,36 In our study, AST, ALT, and total bilirubin values were positively correlated with the estimated tissue Young modulus for all patients, whereas the serum albumin values was negatively correlated. Not surprisingly, serum autoantibodies were not significantly correlated with the estimated tissue Young modulus; their presence is neither necessary for the diagnosis of ALD, nor are they of prognostic value.37
Our previous study reported sensitivity of 91.4% and specificity of 52.5% for the differentiation of F2 or higher from lower fibrosis stages in a group of patients with a variety of chronic liver diseases at a cutoff value of7.29 kPa.8 We assessed this cutoff value in this study and obtained sensitivity of 88.9% and specificity of 39.4%, with a corresponding PPV and NPV of 44.4% and 86.7%, respectively. For the subgroup with PBC, the sensitivity, specificity, PPV, and NPV were 87.5%, 43.8%, 43.8%, and 87.5%. For the subgroup with AIH, the sensitivity, specificity, PPV, and NPV were 85.7%, 38.5%, 42.9%, and 83.3%. Although these values are comparable, they are also different, suggesting that underlying disease processes may differ in optimal SWE threshold values for fibrosis staging.
There were some limitations to our study, including the use of the METAVIR system to stage liver fibrosis. This system, although widely used for histologic evaluation of hepatic fibrosis, was based on patients with chronic viral hepatitis, and its applicability to other disease processes is not known. Second, only 51 patients were included in our study because ALD is a set of rare diseases, and the incidence is very low. Consequently, a larger series of patients can be reasonably expected in a future study. No patients in this study had F4 fibrosis (ie, cirrhosis), and the proportion of patients with advanced fibrosis is smaller than that of patients with early fibrosis. Most our patients were white. It is not clear whether people of different races have any differences in liver stiffness. Finally, in our study, only a small subset of the group had PSC or overlap syndrome compared with PBC and AIH.
Our study suggests that SWE may be useful for liver fibrosis staging in patients with ALD. However, larger studies are needed to validate these results and assist with computing optimal estimated Young modulus cutoff values in these patients.
Acknowledgment
Dr. Li’s work was supported by the National Natural Science Foundation of China under award number 81701693; Dr. Samir’s work was supported by the NIBIB of the National Institutes of Health under award number K23 EB020710. The authors are solely responsible for the content and the work does not represent the official views of the National Institutes of Health.
Abbreviations
- AIH
autoimmune hepatitis
- ALD
auto-immune liver disease
- ALP
alkaline phosphatase
- ALT
alanine aminotransferase
- AST
aspartate aminotransferase
- AUROC
area under the receiver operating characteristic curve
- CI
confidence interval
- LR
likelihood ratio
- NPV
negative predictive value
- PBC
primary biliary cirrhosis
- PPV
positive predictive value
- PSC
primary sclerosing cholangitis
- ROC
receiver operating characteristic
- SWE
shear wave elastography
- US
ultrasound
References
- 1.Muratori P, Granito A, Pappas G, Muratori L, Lenzi M, Bianchi FB. Autoimmune liver disease 2007. Mol Aspects Med 2008; 29:96–102. [DOI] [PubMed] [Google Scholar]
- 2.Krawitt EL. Autoimmune hepatitis. N Engl J Med 2006; 354:54–66. [DOI] [PubMed] [Google Scholar]
- 3.Jepsen P, Grønbæk L, Vilstrup H. Worldwide incidence of auto-immune liver disease. Dig Dis 2015; 33:2–12. [DOI] [PubMed] [Google Scholar]
- 4.Czaja AJ, Donaldson PT. Gender effects and synergisms with histocompatibility leukocyte antigens in type 1 autoimmune hepatitis. Am J Gastroenterol 2002; 97:2051–2057. [DOI] [PubMed] [Google Scholar]
- 5.Kaplan MM, Gershwin ME. Primary biliary cirrhosis. N Engl J Med 2005; 353:1261–1273. [DOI] [PubMed] [Google Scholar]
- 6.Sebastiani G, Castera L, Halfon P, et al. The impact of liver disease aetiology and the stages of hepatic fibrosis on the performance of noninvasive fibrosis biomarkers: an international study of 2411 cases. Aliment Pharmacol Ther 2011; 34:1202–1216. [DOI] [PubMed] [Google Scholar]
- 7.Mohd Hanafiah K, Groeger J, Flaxman AD, Wiersma ST. Global epidemiology of hepatitis C virus infection: new estimates of age-specific antibody to HCV seroprevalence. Hepatology 2013; 57:1333–1342. [DOI] [PubMed] [Google Scholar]
- 8.Samir AE, Dhyani M, Vij A, et al. Shear-wave elastography for the estimation of liver fibrosis in chronic liver disease: determining accuracy and ideal site for measurement. Radiology 2014; 274:888–896. [DOI] [PMC free article] [PubMed] [Google Scholar]
- 9.Dienstag JL. The role of liver biopsy in chronic hepatitis C. Hepatology 2002; 36(suppl 1):s152–s160. [DOI] [PubMed] [Google Scholar]
- 10.Bedossa P, Dargère D, Paradis V. Sampling variability of liver fibrosis in chronic hepatitis C. Hepatology 2003; 38:1449–1457. [DOI] [PubMed] [Google Scholar]
- 11.Cholongitas E, Senzolo M, Standish R, et al. A systematic review of the quality of liver biopsy specimens. Am J Clin Pathol 2006; 125:710–721. [DOI] [PubMed] [Google Scholar]
- 12.Ratziu V, Charlotte F, Heurtier A, et al. Sampling variability of liver biopsy in nonalcoholic fatty liver disease. Gastroenterology 2005; 128:1898–1906. [DOI] [PubMed] [Google Scholar]
- 13.Schmeltzer PA, Talwalkar JA. Noninvasive tools to assess hepatic fibrosis: ready for prime time? Gastroenterol Clin North Am 2011; 40:507–521. [DOI] [PMC free article] [PubMed] [Google Scholar]
- 14.Ronot M, Asselah T, Paradis V, et al. Liver fibrosis in chronic hepatitis C virus infection: differentiating minimal from intermediate fibrosis with perfusion CT. Radiology 2010; 256:135–142. [DOI] [PubMed] [Google Scholar]
- 15.Hagiwara M, Rusinek H, Lee VS, et al. Advanced liver fibrosis: diagnosis with 3D whole-liver perfusion MR imaging—initial experience. Radiology 2008; 246:926–934. [DOI] [PubMed] [Google Scholar]
- 16.Wang QB, Zhu H, Liu HL, Zhang B. Performance of magnetic resonance elastography and diffusion-weighted imaging for the staging of hepatic fibrosis: a meta-analysis. Hepatology 2012; 56:239–247. [DOI] [PubMed] [Google Scholar]
- 17.Bonekamp S, Torbenson MS, Kamel IR. Diffusion-weighted magnetic resonance imaging for the staging of liver fibrosis. J Clin Gastroenterol 2011; 45:885–892. [DOI] [PMC free article] [PubMed] [Google Scholar]
- 18.E Anastasio O, Büchter M, A Baba H, et al. Performance and utility of transient elastography and non-invasive markers of liver fiibrosis in patients with autoimmune hepatitis: a single centre experience. Hepat Mon 2016; 16:e40737. [DOI] [PMC free article] [PubMed] [Google Scholar]
- 19.Xu Q, Sheng L, Bao H, et al. Evaluation of transient elastography in assessing liver fibrosis in patients with autoimmune hepatitis. J Gastroenterol Hepatol 2017; 32:639–644. [DOI] [PubMed] [Google Scholar]
- 20.Jin W, Malik N, Meng Y, et al. Magnetic resonance elastography is accurate in detecting advanced fibrosis in autoimmune hepatitis. World J Gastroenterol 2017; 23:859–868. [DOI] [PMC free article] [PubMed] [Google Scholar]
- 21.Friedrich-Rust M, Ong MF, Martens S, et al. Performance of transient elastography for the staging of liver fibrosis: a meta-analysis. Gastroenterology 2008; 134:960–974. [DOI] [PubMed] [Google Scholar]
- 22.Friedrich-Rust M, Nierhoff J, Lupsor M, et al. Performance of acoustic radiation force impulse imaging for the staging of liver fibrosis: a pooled meta-analysis. J Viral Hepat 2012; 19:e212–e219. [DOI] [PubMed] [Google Scholar]
- 23.Hong H, Li J, Jin Y, et al. Performance of real-time elastography for the staging of hepatic fibrosis: a meta-analysis. PLoS One 2014; 9:e115702. [DOI] [PMC free article] [PubMed] [Google Scholar]
- 24.Ferraioli G, Tinelli C, Dal Bello B, Zicchetti M, Filice G, Filice C. Accuracy of real-time shear wave elastography for assessing liver fibrosis in chronic hepatitis C: a pilot study. Hepatology 2012; 56:2125–2133. [DOI] [PubMed] [Google Scholar]
- 25.Zeng J, Liu GJ, Huang ZP, et al. Diagnostic accuracy of two-dimensional shear wave elastography for the non-invasive staging of hepatic fibrosis in chronic hepatitis B: a cohort study with internal validation. Eur Radiol 2014; 24:2572–2581. [DOI] [PubMed] [Google Scholar]
- 26.Bedossa P, Poynard T. An algorithm for the grading of activity in chronic hepatitis C. The METAVIR Cooperative Study Group. Hepatology 1996; 24:289–293. [DOI] [PubMed] [Google Scholar]
- 27.Alempijevic T, Krstic M, Jesic R, et al. Biochemical markers for non-invasive assessment of disease stage in patients with primary biliary cirrhosis. World J Gastroenterol 2009; 15:591–594. [DOI] [PMC free article] [PubMed] [Google Scholar]
- 28.Nyblom H, Björnsson E, Simrén M, Aldenborg F, Almer S, Olsson R. The AST/ALT ratio as an indicator of cirrhosis in patients with PBC. Liver Int 2006; 26:840–845. [DOI] [PubMed] [Google Scholar]
- 29.Tada T, Kumada T, Toyoda H, et al. Utility of real-time shear wave elastography for assessing liver fibrosis in patients with chronic hepatitis C infection without cirrhosis: comparison of liver fibrosis indices. Hepatol Res 2015; 45:E122–E129. [DOI] [PubMed] [Google Scholar]
- 30.Ferraioli G, Tinelli C, Lissandrin R, et al. Point shear wave elastography method for assessing liver stiffness. World J Gastroenterol 2014; 20: 4787–4796. [DOI] [PMC free article] [PubMed] [Google Scholar]
- 31.Lim SG, Cho SW, Lee YC, et al. Changes in liver stiffness measurement during antiviral therapy in patients with chronic hepatitis B. Hepatogastroenterology 2011; 58:539–545. [PubMed] [Google Scholar]
- 32.Sande JA, Verjee S, Vinayak S, Amersi F, Ghesani M. Ultrasound shear wave elastography and liver fibrosis: a prospective multicenter study. World J Hepatology 2017; 9:38–47. [DOI] [PMC free article] [PubMed] [Google Scholar]
- 33.Ogawa S, Moriyasu F, Yoshida K, et al. Relationship between liver tissue stiffness and histopathological findings analyzed by shear wave elastography and compression testing in rats with non-alcoholic steatohepatitis. J Med Ultrason 2016; 43:355–360. [DOI] [PubMed] [Google Scholar]
- 34.Deffieux T, Gennisson JL, Bousquet L, et al. Investigating liver stiffness and viscosity for fibrosis, steatosis and activity staging using shear wave elastography. J Hepatol 2015; 62:317–324. [DOI] [PubMed] [Google Scholar]
- 35.Kim WR, Therneau TM, Wiesner RH, et al. A revised natural history model for primary sclerosing cholangitis. Mayo Clin Proc 2000: 75: 688–694. [DOI] [PubMed] [Google Scholar]
- 36.Al Mamari S, Djordjevic J, Halliday JS, Chapman RW. Improvement of serum alkaline phosphatase to <1.5 upper limit of normal predicts better outcome and reduced risk of cholangiocarcinoma in primary sclerosing cholangitis. J Hepatol 2013; 58:329–334. [DOI] [PubMed] [Google Scholar]
- 37.Trivedi P, Hirschfield G. Review article: overlap syndromes and auto-immune liver disease. Aliment Pharmacol Ther 2012; 36:517–533. [DOI] [PubMed] [Google Scholar]