eLife logoLink to eLife
. 2019 Jun 20;8:e44718. doi: 10.7554/eLife.44718

Comment on 'Valid molecular dynamics simulations of human hemoglobin require a surprisingly large box size'

Vytautas Gapsys 1, Bert L de Groot 1,
Editors: Yibing Shan2, John Kuriyan3
PMCID: PMC6586461  PMID: 31219782

Abstract

A recent molecular dynamics investigation into the stability of hemoglobin concluded that the unliganded protein is only stable in the T state when a solvent box is used in the simulations that is ten times larger than what is usually employed (El Hage et al., 2018). Here, we express three main concerns about that study. In addition, we find that with an order of magnitude more statistics, the reported box size dependence is not reproducible. Overall, no significant effects on the kinetics or thermodynamics of conformational transitions were observed.

Research organism: Human

Introduction

A surprising effect of the simulation box size was recently reported for spontaneous hemoglobin transitions from the T to the R state in molecular dynamics simulations of deoxy hemoglobin (El Hage et al., 2018). It was reported that the T state was stable for a period of 1 microsecond only in a relatively large simulation box with a cube edge length of 15 nm, whereas in smaller simulation boxes spontaneous transitions to the R state were observed on this timescale. Based on this, thermodynamic stabilization of the T state in the larger box was concluded, attributed to a change in the hydrophobic effect due to a change in the box size.

Here, we express three main concerns about the presented analyses. In addition, we present a systematic study of box size dependence in a variety of systems including hemoglobin, in which we observe no significant effect of the simulation box size on the kinetics or thermodynamics of conformational transitions.

Results

Statistics

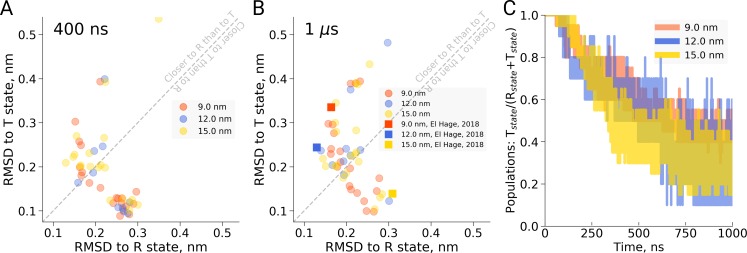
First, in the work by El Hage et al. for each of the four studied box sizes, a single MD simulation was carried out and a transition (or lack thereof) was reported. Based on the single data points, an estimate of the uncertainty in the reported transition times is lacking, impairing an assessment of the statistical significance of the observed differences. The statistical significance of the concluded box size dependence has thus not been shown. In redoing the simulations presented by El Hage et al. (2018) using multiple replicas (20 for the 9 and 15 nm setup, 10 for the 12 nm setup, we find that there is considerable scatter in the transition times obtained in single MD simulations (see Figure 1). For example, we find that in the 9 nm box a substantial fraction does not undergo the transition within 1 µs, rendering the absence of a transition in the single simulation of the 15 nm box in the El Hage et al. (2018) study statistically insignificantly different from those observed for the 9 nm box. This is further underscored by the fact that out of 20 simulations we set up for the 15 nm system, 11 made the transition within 400 ns and 14 within 1 µs (Figure 1C). Consistent with this result, we find that the distributions of RMSD values to the T and R state crystal structures monitored at 400 ns and 1 µs of simulation time are highly similar for the studied box sizes (Figure 1A,B). Based on the statistics from our multiple simulations, we can quantify the probability for a box size-effect on the transition kinetics of hemoglobin. Specifically, we have estimated the probability of a slowdown in the 15 nm box, as claimed by El Hage et al. (2018). For a relatively moderate effect of a factor of 2 slower kinetics, this amounts to a probability of 0.0026, for a factor of 10 it amounts to 4.7e-6. We can thus reject the box size dependence hypothesis with a relatively large statistical margin.

Figure 1. Hemoglobin simulation analysis.

(A) RMSD of the simulation snapshots after 400 ns to the crystallographic T (2dn2) and R (2dn3) states. (B) RMSD of the simulation snapshots after 1 µs. Note that the simulations reported by El Hage et al. (2018) (squares) scatter indistinguishably from the other replicas. (C) Fraction of trajectories remaining in T for simulations in the boxes of different size. Simulations were counted to have left the T state if more than half of the distance from the T state had been covered, as projected onto the difference vector between the T and R crystallographic states. Each simulation reached 1 µs and comprised the following replicas: 20 for 9 nm and 15 nm boxes, 10 for 12 nm box.

Figure 1—source data 1. Source files for RMSD and transition analysis.
The zip archive contains a README file describing which source files correspond to the different panels.
DOI: 10.7554/eLife.44718.005

Figure 1.

Figure 1—figure supplement 1. RMSD values for the snapshots of hemoglobin simulations in 9 nm (left), 12 nm (middle) and 15 nm (right) boxes.

Figure 1—figure supplement 1.

The simulations start from the T state and are marked by a down-pointing triangle symbol. The last frames of the trajectories are depicted as circles. The frames in every trajectory that approach the R state the closest are shown as up-pointing triangles. Connecting the frames that belong to the same trajectory (lines between triangles and circles) allows tracking the possible back transitions where hemoglobin approaches the R state and afterwards returns closer to the T state. These back transitions cross the diagonal line and are highlighted in darker gray.
Figure 1—figure supplement 1—source data 1. This figure is made from the same data as Figure 1.
DOI: 10.7554/eLife.44718.004

As an independent validation of this result, we have monitored possible back-transitions to the T state after a T to R transition using the El Hage et al. simulation setup. We have not observed a full back-transition in any of the simulated systems. We only observe occasional partial transitions back to the T state (see also Figure 1—figure supplement 1), independent of the box size. This is consistent with the finding above that there is no detectable stabilization of the T state over the R state in the 15 nm box.

Hydrophobic effect

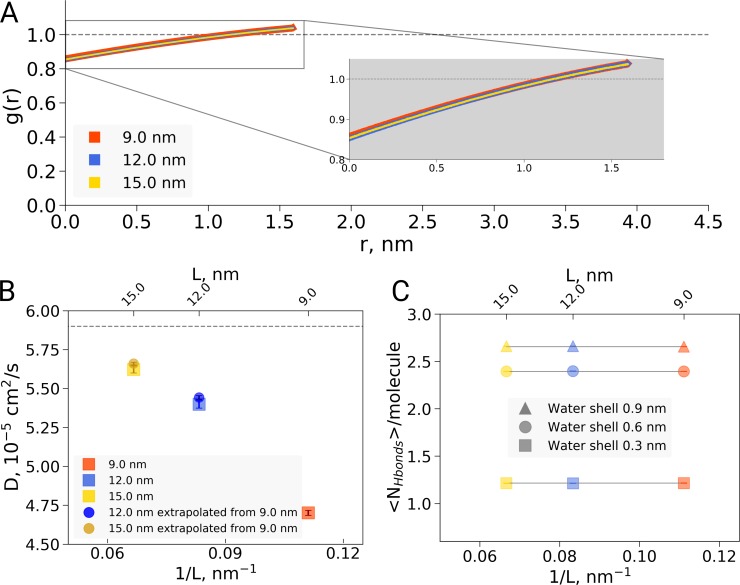
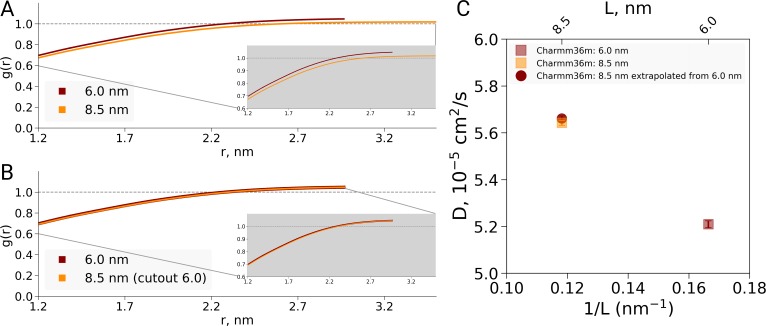
Second, the reported box size dependence was attributed to the hydrophobic effect, and analysed using solvent-solvent hydrogen bonds, solvent radial distribution function and water diffusion constants (El Hage et al., 2018). Here, we are concerned that the presented analyses report not only on a possible hydrophobic or hydrodynamic effect, but also on a dilution effect caused by the different ratio of protein to water in differently sized boxes. Indeed, if we reanalyze the solvent radial distribution function (Figure 2A) or water-water hydrogen bonds (Figure 2B) and normalize based on the analysis volume (which we keep constant for the differently sized boxes) rather than by the box volume as was done originally, we find no significant box size effect. A similar dilution effect is observed for the diffusion constant. Averaging over the complete box represents a weighted average over restricted and bulk waters. For larger boxes, more water molecules are unrestricted by the protein and therefore behave bulk-like, yielding a larger weight of bulk water to the average. To disentangle this dilution averaging effect from possible box size effects, we estimated average diffusion constants for the 12 and 15 nm boxes from that of the 9 nm box, reweighting solely with the additional number of water molecules in the larger boxes and applying the bulk value of 5.910-5cm2/s from El Hage et al. As can be seen in Figure 2C, the resulting diffusion constants obtained this way are remarkably close to the ones originally computed for the 12 and 15 nm sized boxes, indicating that the observed differences in average diffusion constant can be largely explained by the dilution effect and thus do not reflect a box size effect. This is consistent with earlier results from Yeh and Hummer, 2004 who showed that the box size dependence on water diffusion is small for box sizes larger than 4 nm. The dilution effect is evident in other systems as well: Figure 2—figure supplement 1 demonstrates the RDF and diffusion coefficient dependence on the protein-to-water ratio in ubiquitin simulations. Note that ubiquitin is significantly smaller than hemoglobin and therefore the hydrophobic effect should be expected to be significantly smaller, following the argumentation of El Hage et al. (2018). The fact that nevertheless we see a similar box size effect on the (unnormalized) RDF and diffusion constant confirms that the underlying cause is the dilution effect rather than a box size effect on the hydrophobic effect.

Figure 2. Radial distribution function (RDF), water diffusion and hydrogen bonds in hemoglobin simulations.

(A) RDF for water oxygen atoms was calculated for the simulations in the boxes of different sizes. An equivalent volume for estimating the RDFs was used for every box size by cutting out a cubic box with an edge of 9 nm around the protein. (B) The water diffusion coefficient is plotted as a function of the box edge length. The square symbols mark the results obtained directly from simulations. The circles denote diffusion coefficients calculated from the value obtained from the 9 nm box simulations by means of extrapolation by adding a corresponding number of bulk water molecules (see main text). (C) Average number of water-water hydrogen bonds (cutoff value for the donor-acceptor distance of 0.33 nm) for three solvation shells around the protein: 0.3, 0.6 and 0.9 nm.

Figure 2—source data 1. Source files for RDF, diffusion and hydrogen bond analysis.
The zip archive contains a README file describing which source files correspond to the different panels.
DOI: 10.7554/eLife.44718.009

Figure 2.

Figure 2—figure supplement 1. Radial distribution function (RDF) and water diffusion for ubiquitin simulations with the Charmm36m force field.

Figure 2—figure supplement 1.

(A) RDFs calculated using the approach by El Hage et al., that is the normalization over different box volumes. When changes in the protein-to-water ratio between 6.0 and 8.5 nm boxes are not taken into account, the RDF curves differ, similarly as observed by El Hage et al for hemoglobin. (B) RDFs normalized using equivalent volume. In this case protein-to-water ratio remains constant and the RDFs are equivalent. (C) The water diffusion coefficients depicted in squares were calculated directly from simulations. The diffusion coefficient shown as circle was extrapolated from the value calculated for the smaller 6.0 nm box and the bulk water diffusion constant. The correspondence between the directly determined and extrapolated results demonstrates that the dilution effect due to a modified protein-to-water ratio is sufficient to explain the data, as in the hemoglobin case.
Figure 2—figure supplement 1—source data 1. Source files for RDF, and diffusion analysis of ubiquitin.
The zip archive contains a README file describing which source files correspond to the different panels.
DOI: 10.7554/eLife.44718.008

As the inherent, unavoidable dilution effect associated with increasing the box size is sufficient to explain the observed data, this implies there is no evidence to justify assuming an additional effect on protein solvation or the hydrophobic effect. This thus removes the justification for Figures 3, 4 and 5 of El Hage et al. (2018). It is important to note that this does not preclude the hydrophobic effect hypothesis: however, the current data do not indicate that protein solvation or the hydrophobic effect changes significantly with the simulation box size for the studied range.

Kinetics rather than thermodynamics

Third, we argue that the readout of transition times from T to R as applied is insufficient to allow for conclusions on the thermodynamic stability of the T state. According to rate theory, the transition times are primarily related to the activation barrier and the attempt frequency of the transition. Therefore, longer transition times could either be caused by a lowering of the attempt frequency or an increased barrier. In turn, an increased barrier (e.g. to leave the T state) can be achieved by a higher thermodynamic stability (lowering the well of the T state) but equally well by solely increasing the barrier and thus leaving the thermodynamic equlibrium between T and R unaltered. Without addressing the barrier and the attempt frequency, transition times to leave a state are thus insufficient to draw conclusions about the thermodynamic stability of that state. We thus argue that the presented transition times report primarily on the kinetics of the T to R transition rather than the thermodynamic difference between the T and R states.

Kinetics as a function of box size

To investigate if the box size may affect transition kinetics for other systems, we have systematically investigated conformational transitions for a variety of additional systems including alternative setups of deoxy hemoglobin, each based on multiple independent trajectories.

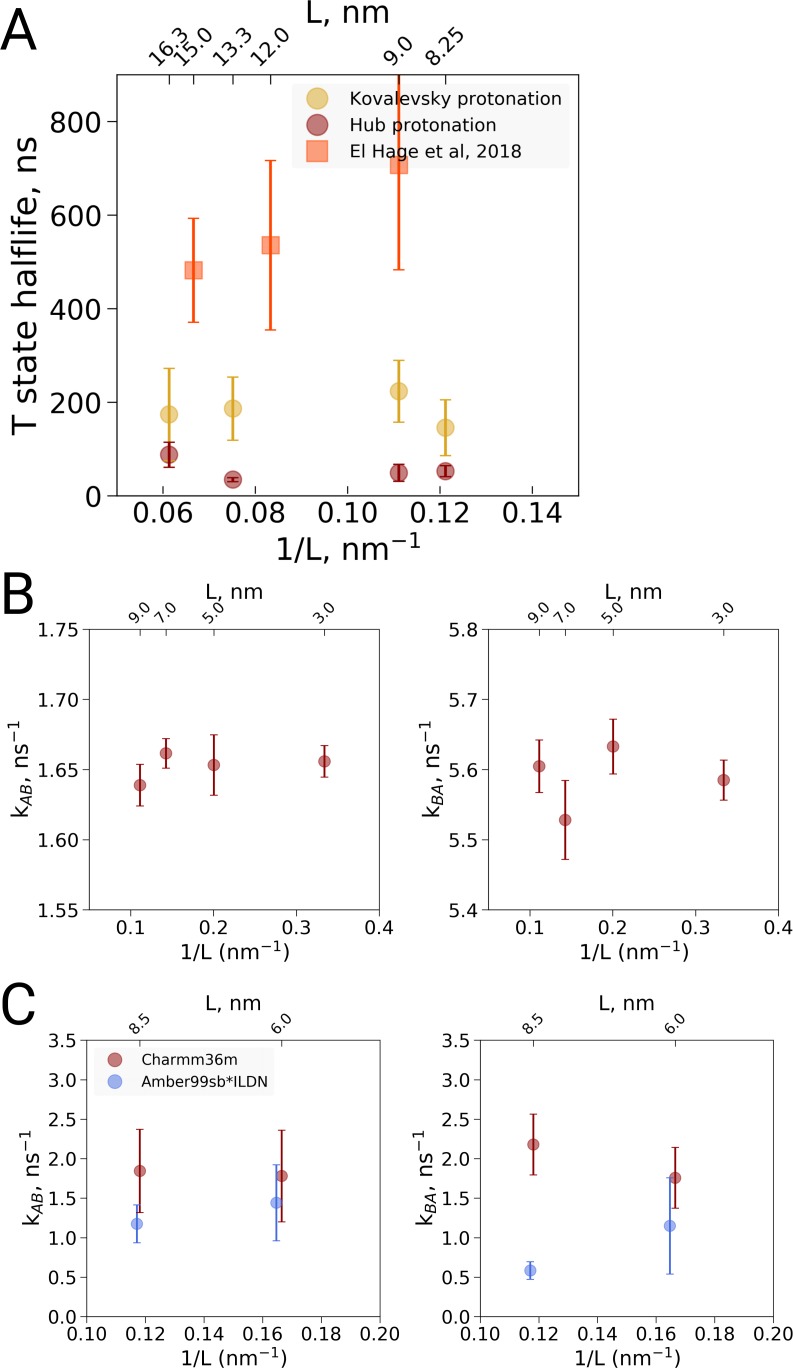
We carried out MD simulations of deoxy hemoglobin in the Charmm36m force field for four different box sizes ranging from 8.25 nm to 16.3 nm for two different sets of protonation states for the histidine residues, starting from the T state (PDB entry 2dn2). In addition, as described above, simulations based on the El Hage et al. setup were carried out: ten replicas of each state were simulated for statistics, except for the El Hage et al. setup with box sizes of 9 and 15 nm for which we did 20 replicas. Spontaneous transitions towards the R state were observed under each of the simulated conditions (Figure 3A). Histidine protonation states as used by Hub et al. (2010) were found to lead to generally faster transitions than histidine protonation as suggested by Kovalevsky et al., 2010, in line with earlier simulations using the GROMOS96 43A1 force field (Van Gunsteren et al., 1996; Vesper and de Groot, 2013). Interestingly, the setup of El Hage et al. leads to generally slower transitions than either of these two protonation states. No dependence on the simulation box size was observed for the transition times for any of the tested setups (Figure 3).

Figure 3. Kinetic analysis of hemoglobin, ubiquitin and alanine dipeptide.

Figure 3.

(A) Hemoglobin: average transition time from T to R, expressed as the time in which half of the replicas displayed the T to R transition, as a function of the simulation box size. Three different system setups were used for simulations. The Kovalevsky and Hub setups differ in the protonation of hemoglobin (Vesper and de Groot, 2013), both model the iron-proximal histidine interaction as a covalent bond. The El Hage setup is obtained from El Hage et al and thus identical to the one used in El Hage et al. (2018), where the iron-histidine were not covalently bound. Note that the difference in size of the error bars is explained by the difference in transition times: larger transition times are accompanied by larger absolute uncertainties. (B) Transition rates between the two minima in ubiquitin: rates from A to B (left) and from B to A (right). The reaction coordinate with the minima is depicted in Figure 4E,F. (C) Transition rates between the two minima in alanine dipeptide: rates from A to B (left) and from B to A (right). The reaction coordinate with the minima is depicted in Figure 4B,C.

Figure 3—source data 1. Source files for kinetics analysis.
The zip archive contains a README file describing which source files correspond to the different panels.
DOI: 10.7554/eLife.44718.011

Factors influencing the T to R transition kinetics

In a preliminary investigation into the cause of the generally slower transitions in the El Hage et al. setup, we noted that the histidine protonation states were virtually identical to the Hub et al. (2010) setup and therefore are unlikely responsible for the slower transition times. The only difference in protonation state concerns His72, which is protonated on the delta position in both α subunits in the Hub setup, whereas it is protonated on the delta position on the α−1 subunit and on the epsilon position on the α−2 subunit in the El Hage et al. setup. Since α-His72 is exposed to the solvent, its protonation is unlikely to affect the T to R transition. Instead we identified two other differences that appear to slow down the transition. First, in the El Hage et al. setup an angular center of mass motion removal was employed on the protein, whereas in the Hub et al. and Vesper et al. a linear center of mass motion removal for the whole system was used. Second, whereas in the Hub et al. (2010) and Vesper and de Groot, 2013 setups a covalent bond was modeled between the iron and the epsilon nitrogen of the proximal histidine for all four subunits, this interaction was modeled with non-bonded interactions in the El Hage et al. (2018) setup. Note that another difference in setup is the use of cubic and rhombic dodecehedral boxes. Based on the current data, the box geometry does not appear to have a major effect, but more systematic analyses would be required for a definitive answer.

Kinetics of conformational transitions in other systems

To further examine possible kinetic effects caused by the box size we looked at two additional systems: alanine dipeptide and ubiquitin (Figure 3B,C). For alanine dipeptide, we counted transitions for the ψ dihedral, for ubiquitin transitions along the principal 'pincer' mode (Lange et al., 2008) were investigated. Also for these systems, no systematic effect of the box size on the transition kinetics was observed.

Thermodynamics as a function of box size

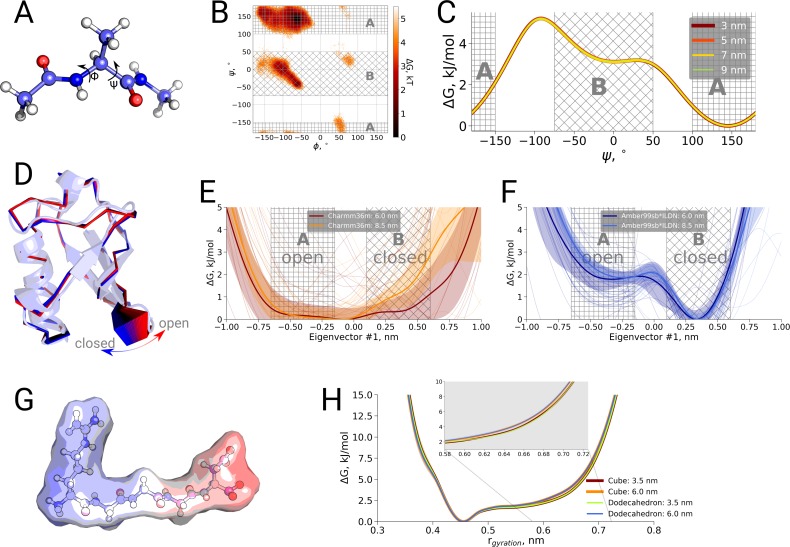
Finally, we also investigated a possible box size influence on the thermodynamics of conformational transitions for alanine dipeptide, ubiquitin and the pentapeptide RGGGD. These systems have sufficiently small transition barriers to derive converged free energy profiles from unbiased simulations on the microsecond timescale. We constructed the pentapeptide RGGGD with the termini in their zwitterionic form, and thus carrying two positive charges on the N-terminus and two negative charges on the C-terminus, as a particularly sensitive test to long-range electrostatic effects on the conformational dynamics. In this case, no ions were added to the box, to avoid any screening effects. For the three systems, only minor effects, if any, of the box size on the obtained free energy profiles were observed (Figure 4).

Figure 4. Thermodynamic analysis of hemoglobin, ubiquitin and RGGGD peptide.

Figure 4.

(A) Structure of the alanine dipeptide. (B) Free energy surface for alanine dipeptide simulated in the smallest box projected onto the backbone dihedrals marked in the panel (A). (C) Free energy profile along the ψ dihedral angle. (D) Structure of ubiquitin and an interpolation of the motion along the principal component with the largest variance (pincer mode). (E) Free energy profile projected on the pincer mode for ensembles generated with the Charmm36m force field. (F) Free energy profile for the Amber99sb*ILDN force field. (G) Structure of the RGGGD pentapeptide with the surface color corresponding to the surface charge: blue - positive, red - negative. (H) Free energy profiles for the pentapeptide projections as a function of the radius of gyration.

Figure 4—source data 1. Source files for thermodynamics analysis.
The zip archive contains a README file describing which source files correspond to the different panels.
DOI: 10.7554/eLife.44718.013

Conclusions 

In conclusion, we have shown that the observation of El Hage et al. (2018) that the stability of hemoglobin in the T state in the largest box of 15 nm was not significantly different from the other investigated box sizes. In addition, a re-analysis of solvent hydrogen bonds, solvent radial distribution function and diffusion constants as a possible underlying hydrophobic or hydrodynamic effect showed that, when normalized to the analysis volume rather than the box volume, no significant box size effects were observed. Moreover, an analysis of the conformational transition kinetics in three hemoglobin setups as well as two additional systems showed no significant box size effects. Similarly, for three systems that allowed the investigation of thermodynamic effects, no significant box size effects were observed.

The results from hemoglobin simulations indicate that under the simulated conditions the R state is favored over the T state, with the histidine protonation states affecting the transition statistics, consistent with the Bohr effect (Zheng et al., 2013) and previous simulations (Hub et al., 2010; Vesper and de Groot, 2013).

Our analyses show that the dependence of the thermodynamic and kinetic properties on the box size is well within the level of statistical fluctuations for the observed statistics of 10–20 independent simulations at the microsecond timescale. The differences arising due to the different force fields, starting structures and chaotic nature of the simulations in this regime were found to be larger than the box size induced effects for the investigated systems.

Materials and methods

Simulation setup

Three variants of the hemoglobin simulation setup were prepared: 1) El Hage (El Hage et al., 2018), 2) Hub (Hub et al., 2010) and 3) Kovalevsky (Kovalevsky et al., 2010). The setups differed in the protonation state assignment and the protein-heme interaction treatment (see main text for details). The molecular dynamics simulations for the El Hage setup were performed in cubic boxes and used the parameter set and initial structure obtained from El Hage et al. for the 9 nm box. The setup is therefore identical to that reported in El Hage et al. (2018). The 12 and 15 nm setups were generated by adding an additional shell of water and ions around the 9 nm box. These generated 12 and 15 nm boxes behave indistinguishably from those reported by El Hage et al. (Figure 1). For the Hub and Kovalevsky setups dodecahedral simulation boxes were used in combination with the molecular dynamics parameters compatible with the Charmm force field. The Charmm36m (Huang et al., 2016) force-field was used for all the simulations. Hemoglobin was solvated with TIP3P water, Na+ and Cl- ions were added to neutralize the system and reach 150 mM salt concentration. Equations of motion were integrated with a 2 fs time step. The temperature was kept at 300 K by means of the velocity rescaling thermostat (Bussi et al., 2007) with a time constant of 1.0 ps. All atoms in the system were assigned to one temperature coupling group. The Parrinello-Rahman barostat (Parrinello and Rahman, 1981) was used to keep the pressure at 1 bar (time constant 5.0 ps). Long range electrostatics were treated by means of PME (Darden et al., 1993; Essmann et al., 1995) with a real space cutoff of 1.2 nm, a fourier spacing of 0.12 nm and interpolation order of 4. Van der Waals interactions were cut off at 1.2 nm by smoothly switching off the force starting from 1.0 nm. Several noteworthy differences between the El Hage and other setup variants include a dispersion correction to energy and pressure which was used by El Hage et al, but was not employed for the other setups in our work. While El Hage setup used LINCS (Hess et al., 1997) to constrain all bonds, Hub and Kovalevsky setups constrained hydrogen atoms involving bonds only. The El Hage setup also removed angular center of mass motion of the protein during the simulation; this option was not used in other setups.

Simulations using the El Hage setup were performed in three cubic boxes with a cube edge of 9.0, 12.0 and 15.0 nm. For the size of 9.0 nm and 15.0 nm, 20 independent simulations of 1 µs were performed, while for the size of 12.0 nm, we used 10 simulations of 1 µs, in line with the rule of thumb by Knapp et al. (2018). The Hub and Kovalevsky setup runs were performed in dodecahedral boxes which have volume equivalent to the cubic boxes with an edge of 8.25, 9.0, 13.3 and 16.0 nm. For each box 10 simulations were performed reaching in total 2.8, 2.0, 0.9 and 1.2 µs for every box, respectively, in the case of Hub setup and 5.0, 4.0, 2.3 and 2.6 µs for every box in case of Kovalevsky setup.

The alanine dipeptide, ubiquitin and RGGGD peptide simulations used the same simulation parameters as Hub and Kovalevsky hemoglobin setups. Alanine dipeptide was simulated in four cubic boxes with edges of 3.0, 5.0, 7.0 and 9.0 nm. For every box size 10 simulations 1 µs each were performed. Ubiquitin was simulated in two cubic boxes with edges of 6.1 and 8.5 nm. For ubiquitin 20 simulations 1 µs each were performed per box size: 10 runs starting from the 1ubq and 10 initialized with 1nbf structure. Furthermore, 20 additional ubiquitin simulations of 1 µs each were performed using Amber99sb*ILDN force field. RGGGD peptide was simulated in two cubic boxes with an edge length of 3.5 and 6.0 nm. For both box sizes 10 simulations of 1 µs were performed. In addition, the same simulation procedure for the RGGGD peptide was performed using dodecahedral boxes with the volume equivalent to the cubic boxes with an edge of 3.5 and 6.0 nm.

Analysis

Root mean squared deviation (RMSD), radial distribution function (RDF), diffusion coefficient calculation and hydrogen bond counting were performed with the standard tools in the Gromacs (Abraham et al., 2015) library. Prior to calculating RDF for the boxes with an edge of 12.0 and 15.0 nm, a cubic box with an edge of 9.0 nm centered at the protein was cut out from the original boxes. This ensured consistent normalization for all the box sizes. As for the hydrogen bond counting, the consistent normalization was ensured by considering only the waters around the protein in the shells at a distance of 0.3, 0.6 and 0.9 nm. For the box size dependence of the average diffusion constant, a bulk extrapolation based on the 9.0 nm box was used for the 12.0 and 15.0 nm boxes as described in the results section.

The error bars for hemoglobin halflife times, as well as alanine dipeptide and ubiquitin rate constants were calculated by means of bootstrap.

Funding Statement

The funders had no role in study design, data collection and interpretation, or the decision to submit the work for publication.

Contributor Information

Bert L de Groot, Email: bgroot@gwdg.de.

Yibing Shan, DE Shaw Research, United States.

John Kuriyan, University of California, Berkeley, United States.

Funding Information

This paper was supported by the following grant:

  • European Commission t H2020-EINFRA-2015-1-675728 to Bert L de Groot, Vytautas Gapsys.

Additional information

Competing interests

No competing interests declared.

Author contributions

Conceptualization, Software, Formal analysis, Investigation, Visualization, Methodology, Writing—original draft, Writing—review and editing.

Conceptualization, Software, Formal analysis, Funding acquisition, Investigation, Methodology, Writing—original draft, Writing—review and editing.

Data availability

We have provided the raw data for all of the graphs in all of the figures as Source data. For each figure we are providing ReadMe files that include descriptions for generating the figures.

References

  1. Abraham MJ, Murtola T, Schulz R, Páll S, Smith JC, Hess B, Lindahl E. GROMACS: high performance molecular simulations through multi-level parallelism from laptops to supercomputers. SoftwareX. 2015;1-2:19–25. doi: 10.1016/j.softx.2015.06.001. [DOI] [Google Scholar]
  2. Bussi G, Donadio D, Parrinello M. Canonical sampling through velocity rescaling. Journal of Chemical Physics. 2007;126:014101. doi: 10.1063/1.2408420. [DOI] [PubMed] [Google Scholar]
  3. Darden T, York D, Pedersen L. Particle mesh Ewald: An N ⋅log( N ) method for Ewald sums in large systems. Journal of Chemical Physics. 1993;98:10089–10092. doi: 10.1063/1.464397. [DOI] [Google Scholar]
  4. El Hage K, Hédin F, Gupta PK, Meuwly M, Karplus M. Valid molecular dynamics simulations of human hemoglobin require a surprisingly large box size. eLife. 2018;7:e35560. doi: 10.7554/eLife.35560. [DOI] [PMC free article] [PubMed] [Google Scholar]
  5. Essmann U, Perera L, Berkowitz ML, Darden T, Lee H, Pedersen LG. A smooth particle mesh Ewald method. Journal of Chemical Physics. 1995;103:8577–8593. doi: 10.1063/1.470117. [DOI] [Google Scholar]
  6. Hess B, Bekker H, Berendsen HJC, Fraaije JGEM. LINCS: a linear constraint solver for molecular simulations. Journal of Computational Chemistry. 1997;18:1463–1472. doi: 10.1002/(SICI)1096-987X(199709)18:12<1463::AID-JCC4>3.0.CO;2-H. [DOI] [Google Scholar]
  7. Huang J, Rauscher S, Nawrocki G, Ran T, Feig M, de Groot BL, Grubmüller H, MacKerell AD. CHARMM36m: an improved force field for folded and intrinsically disordered proteins. Nature Methods. 2016;14:71–73. doi: 10.1038/nmeth.4067. [DOI] [PMC free article] [PubMed] [Google Scholar]
  8. Hub JS, Kubitzki MB, de Groot BL. Spontaneous quaternary and tertiary T-R transitions of human hemoglobin in molecular dynamics simulation. PLOS Computational Biology. 2010;6:e1000774. doi: 10.1371/journal.pcbi.1000774. [DOI] [PMC free article] [PubMed] [Google Scholar]
  9. Knapp B, Ospina L, Deane CM. Avoiding false positive conclusions in molecular simulation: the importance of replicas. Journal of Chemical Theory and Computation. 2018;14:6127–6138. doi: 10.1021/acs.jctc.8b00391. [DOI] [PubMed] [Google Scholar]
  10. Kovalevsky AY, Chatake T, Shibayama N, Park SY, Ishikawa T, Mustyakimov M, Fisher Z, Langan P, Morimoto Y. Direct determination of protonation states of histidine residues in a 2 Å neutron structure of deoxy-human normal adult hemoglobin and implications for the bohr effect. Journal of Molecular Biology. 2010;398:276–291. doi: 10.1016/j.jmb.2010.03.016. [DOI] [PubMed] [Google Scholar]
  11. Lange OF, Lakomek NA, Farès C, Schröder GF, Walter KF, Becker S, Meiler J, Grubmüller H, Griesinger C, de Groot BL. Recognition dynamics up to microseconds revealed from an RDC-derived ubiquitin ensemble in solution. Science. 2008;320:1471–1475. doi: 10.1126/science.1157092. [DOI] [PubMed] [Google Scholar]
  12. Parrinello M, Rahman A. Polymorphic transitions in single crystals: a new molecular dynamics method. Journal of Applied Physics. 1981;52:7182–7190. doi: 10.1063/1.328693. [DOI] [Google Scholar]
  13. Van Gunsteren WF, Billeter SR, Eising AA, Hünenberger PH, Krüger P, Mark AE, Scott WRP, Tironi IG. Biomolecular Simulation: The GROMOS96 Manual and User Guide. Groningen: Biomos b.v., Zürich; 1996. [Google Scholar]
  14. Vesper MD, de Groot BL. Collective dynamics underlying allosteric transitions in hemoglobin. PLOS Computational Biology. 2013;9:e1003232. doi: 10.1371/journal.pcbi.1003232. [DOI] [PMC free article] [PubMed] [Google Scholar]
  15. Yeh I-C, Hummer G. System-size dependence of diffusion coefficients and viscosities from molecular dynamics simulations with periodic boundary conditions. Journal of Physical Chemistry B. 2004;108:15873–15879. doi: 10.1021/jp0477147. [DOI] [Google Scholar]
  16. Zheng G, Schaefer M, Karplus M. Hemoglobin bohr effects: atomic origin of the histidine residue contributions. Biochemistry. 2013;52:8539–8555. doi: 10.1021/bi401126z. [DOI] [PubMed] [Google Scholar]

Decision letter

Editor: Yibing Shan1
Reviewed by: Wei Yang2

In the interests of transparency, eLife includes the editorial decision letter and accompanying author responses. A lightly edited version of the letter sent to the authors after peer review is shown, indicating the most substantive concerns; minor comments are not usually included.

Thank you for submitting your article "Comment on 'Valid molecular dynamics simulations of human hemoglobin require a surprisingly large box size'" for consideration by eLife. Your article has been reviewed by 2 peer reviewers, and the evaluation has been overseen by a Reviewing Editor (Yibing Shan), a Senior Editor (John Kuriyan), and the eLife Features Editor (Peter Rodgers). The following individual involved in review of your submission has agreed to reveal his identity: Wei Yang (Reviewer #1).

The reviewers have discussed the reviews with one another and the Reviewing Editor has drafted this decision to help you prepare a revised submission. Please aim to submit the revised version within two months.

Summary:

This comment by Gapsys and de Groot concerns the eLife paper 'Valid molecular dynamics simulations of human hemoglobin require a surprisingly large box size' by El Hage et al.

The comment reports that (a) its authors could not observe an effect of large box size on the T-R transition of hemoglobin in their own simulations, and it argues that (b) the analysis of El Hage et al. may be flawed and the authors therefore challenge the hydrophobic interpretation of the perceived box size effect. The reviewers think that the community of scientists using molecular dynamics simulations will appreciate the efforts by Gapsys and de Groot for their careful re-examination of the box size effect.

Essential revisions:

1) As a whole, the MD community understands relatively little about water box size effects on protein conformational transitions, especially on conformational transitions of large systems. The community's analyses on this topic so far have been mainly based on smaller systems, such as alanine dipeptide, ubiquitin, and the RGGGD pentapeptide. The possibility that the box size effect becomes pronounced only for large protein systems cannot be excluded, although it is far from established. The work by El Hage certainly fell short of performing enough (in the order of hundreds or more) repeats of each simulation to establish statistical significance for their observation. (This is acknowledged by El Hage et al in their response to the comment.) This comment reported substantially more repeats of the simulations (~10) than El Hage et al., but it also falls short of establishing the statistical significance of an opposite observation. The reviewers believe it is important for both parties to not overstate the case, and to clearly acknowledge that the box size effect remains a hypothesis, neither established nor convincingly precluded. Unless the authors think this is not the case, the comment should be revised to reflect this basic reality that neither parties in this debate knows the ultimate answer here.

2) The discussion on the distinction between thermal and kinetic stability in the first paragraph of the results section is not needed and should be removed. (The corresponding section in the reply by El Hage et al. should also be removed.) El Hage highlighted that the observed discrepancy between the experimental timescale of the T-R transition (seconds) and the much shorter simulation timescale of the transition. Although an underlying kinetic effect is also possible, it is not unreasonable to suggest that the thermodynamics of the simulation system is distorted. There is no indication that El Hage et al. are not aware of the distinction between these two scenarios. At this juncture it is a secondary issue to be concerned about whether the box size effect is of thermodynamic or kinetic nature, when the effect itself is under debate.

3) It is known, though rarely formally acknowledged, that when the simulation length is far shorter than the actual timescale of a molecular event, the simulation results are sensitive to the exact simulation setup. We note that the setups by El Hage et al and by Gapsys and de Groot are not identical, and the differences in the setups potentially involve several parameters (e.g., how the initial water box was constructed, how long the water molecules were equilibrated before the production runs, whether the protein system was restrained during the water equilibriation, and what types of baro-stat and thermo-stat were used et al.) To clarify these issues, please be explicit about the differences between your setups and the setups used by El Hage et al.

Also, please revise your manuscript to address the following comments in the response from El Hage et al.a) The comments in the sentence that starts "A possible problem with the comparisons in their figure 3…"b) The comments in the sentence that starts "We also note a difference in the magnitude of the error bars…"c) The comments in the paragraph that starts "When we were still collaborating…"

4) The comment showed that using a different analysis of the water behavior leads to a different conclusion. In the reply, El Hage et al. clarified that their attribution of the box size effect to the hydrophobic effect remains a hypothesis and it requires further investigation. Indeed, this hypothesis needs further examination by careful analyses of water structures and by extensive free energy calculations. The reviewers suggest that in the revision the authors make it clear that the hydrophobic effect hypothesis is not precluded, although the original analysis by El Hage can be improved.

5) The box size effect, if true, is necessarily a subtle one. The authors' simulations of small proteins without observing a box size effect do not serve as proof to preclude the box size effect, especially for large systems. The authors should make this important caveat clear in their discussions.

eLife. 2019 Jun 20;8:e44718. doi: 10.7554/eLife.44718.017

Author response


We repeat the reviewers’ points here in italic, and include our replies point by point, as well as a description of the changes made, in Roman.

Essential revisions:

1) As a whole, the MD community understands relatively little about water box size effects on protein conformational transitions, especially on conformational transitions of large systems. The community's analyses on this topic so far have been mainly based on smaller systems, such as alanine dipeptide, ubiquitin, and the RGGGD pentapeptide. The possibility that the box size effect becomes pronounced only for large protein systems cannot be excluded, although it is far from established. The work by El Hage certainly fell short of performing enough (in the order of hundreds or more) repeats of each simulation to establish statistical significance for their observation. (This is acknowledged by El Hage et al in their response to the comment.) This comment reported substantially more repeats of the simulations (~10) than El Hage et al., but it also falls short of establishing the statistical significance of an opposite observation. The reviewers believe it is important for both parties to not overstate the case, and to clearly acknowledge that the box size effect remains a hypothesis, neither established nor convincingly precluded. Unless the authors think this is not the case, the comment should be revised to reflect this basic reality that neither parties in this debate knows the ultimate answer here.

REPLY: Please note that there is a logical difference between 'there is not sufficient evidence to conclude a box size effect' and 'there is no box size effect'. The two require entirely different statistical tests. In our comment we refer to the former, the reviewers suggest we do not provide the required statistics to conclude the latter. Please note that nowhere in our comment have we stated that there is no box size effect. We have merely stated that based on the data presented in the El Hage et al paper as well as in our own data we find no support for the box size hypothesis (we have not claimed 'an opposite observation'). The original suggestion of a box size effect thus requires the same statistical test as our assertion that there is not sufficient evidence to support that hypothesis. Against that background therefore it should be noted that our N=10-20 repeats carry substantially more statistical weight than the single N=1 trajectories reported by El Hage et al.

In the meantime we have collected additional statistics which in addition to showing that the El Hage et al. results were not significant, actually provide a sufficient basis for a quantitative estimate of the likelihood that the box size hypothesis is valid. Specifically, we estimated the probability that the 150A box shows a substantially longer transition time than the smaller boxes which the authors use to support the El Hage et al. claim "Valid Molecular Dynamics Simulations of Human Hemoglobin Require a Surprisingly Large Box Size". For a relatively moderate effect of a factor of 2 slower kinetics, this amounts to a probability of 0.0026, for a factor of 10 it amounts to 4.7e-6. We can thus, in fact, reject the box size dependence hypothesis with a relatively high statistical confidence (note that this does not take “hundreds or more” repeats. As suggested recently, also in this case on the order of 10 repeats appears suitable: DOI:10.1021/acs.jctc.8b00391). We have now incorporated this quantification in the updated manuscript. Instead of requesting us to "clearly acknowledge that the box size effect remains a hypothesis, not convincingly precluded", El Hage et al. should thus be requested to clearly state that there is insufficient statistical basis to support the box size hypothesis.

Finally, it is written in the decision letter “The work by El Hage certainly fell short of performing enough repeats of each simulation to establish statistical significance for their observation. This is acknowledged by El Hage et al in their response to the comment.” However, this is not the case. Specifically, the abstract of the El Hage et al. response that was sent to us states “the studies do not invalidate the conclusion that there is a significant box size effect” and the conclusion states “our simulations provide evidence that there is a box size dependence in hemoglobin simulations”. As we demonstrate in our comment, the results of El Hage et al. are not statistically significant (or, in the words of the editors/reviewers: “The work by El Hage certainly fell short of performing enough repeats of each simulation to establish statistical significance for their observation”). Therefore the results do not support the drawn conclusion of a box size dependence. This conclusion should thus be withdrawn from the response of El Hage et al, and rather should the lack of a statistical basis for the original paper (El Hage et al., 2018) be acknowledged.

Changes made to the manuscript:

Figure 1, panels B and C updated with the full 1 microsecond trajectories.

Figure 2, panels A, B and C updated with the full 1 microsecond trajectories

Figure 3, panel A updated with the full 1 microsecond trajectories.

Manuscript text: the text has been updated to account for the fact that now all our hemoglobin simulations have reached a length of 1 microsecond. In addition, we have added the quantification: “Based on the statistics from our multiple simulations, we can quantify the probability for a box size-effect on the transition kinetics of hemoglobin. Specifically, we have estimated the probability of a slowdown in the 15 nm box, as claimed by El Hage et al. For a relatively moderate effect of a factor of 2 slower kinetics, this amounts to a probability of 0.0026, for a factor of 10 it amounts to 4.7e-6. We can thus reject the box size dependence hypothesis with a relatively large statistical margin.”

2) The discussion on the distinction between thermal and kinetic stability in the first paragraph of the results section is not needed and should be removed. (The corresponding section in the reply by El Hage et al. should also be removed.) El Hage highlighted that the observed discrepancy between the experimental timescale of the T-R transition (seconds) and the much shorter simulation timescale of the transition. Although an underlying kinetic effect is also possible, it is not unreasonable to suggest that the thermodynamics of the simulation system is distorted. There is no indication that El Hage et al. are not aware of the distinction between these two scenarios. At this juncture it is a secondary issue to be concerned about whether the box size effect is of thermodynamic or kinetic nature, when the effect itself is under debate.

REPLY: We appreciate the consideration of whether this distinction is relevant when the effect itself is under debate. However, we have two reasons why we think it should nevertheless be left as a raised concern. First, leaving the issue uncommented would leave the impression that it is a valid procedure to use a kinetic readout (of non-equilibrium, unidirectional transitions) to probe the thermodynamics of a system. We argue that this is wrong and thus possibly harmful to the community, since, as we pointed out in our comment, this rests on several severe, and in this case unchecked, assumptions. As in the El Hage et al. paper a specific thermodynamic interpretation is included, we feel it is important to point this out to the readers. Not taking the opportunity to correct the scientific record on this issue would appear strangely unscientific.

Second, El Hage et al. insist that the readout is thermodynamic whereas we argue that transition times (or lack thereof) are per definition kinetic. This is true for both their and our sets of simulations and analyses. Therefore, both sets of simulations (theirs based on N=1, ours based on N=10-20) should be tested with the same tests to check for statistical significance. Without explicitly pointing out that both studies are in fact addressing kinetics (something that was also confirmed in an email from Dr. Meuwly and Dr. Karplus to us) one could easily mistakenly think that one is addressing thermodynamics and the other kinetics, and therefore different approaches are called for in both cases.

To follow the reviewers’ suggestion of the lower priority of this concern, we now made this the third rather than the first concern.

To directly address the thermodynamics (the relative stability of the T vs the R state) we have now added an analysis of transitions back to T after a T to R transition. As can be seen in supplement 1 to Fig. 1, such partial events do take place (highlighted by grey bars) and occur independently of the box size. Thus, again, the single such partial event included in the El Hage et al. reply reported for a 150A box does not significantly deviate from the distribution observed for the other box sizes, and thus does not support the assertion of a ‘stabilization’ effect of the 150A box on the T state of hemoglobin.

Changes made to the manuscript:

We have moved the thermodynamics vs kinetics concern after the other two concerns. In addition, we have added supplement 1 to Fig.1 which addresses possible transitions back to T after a transition to R had been made.

3) It is known, though rarely formally acknowledged, that when the simulation length is far shorter than the actual timescale of a molecular event, the simulation results are sensitive to the exact simulation setup. We note that the setups by El Hage et al and by Gapsys and de Groot are not identical, and the differences in the setups potentially involve several parameters (e.g., how the initial water box was constructed, how long the water molecules were equilibrated before the production runs, whether the protein system was restrained during the water equilibriation, and what types of baro-stat and thermo-stat were used et al.) To clarify these issues, please be explicit about the differences between your setups and the setups used by El Hage et al.

REPLY: We are aware of this issue and therefore had contacted El Hage et al for their setup. The data in our comment that refer to 'El Hage setup' is based on their 90A setup and therefore is identical to that of El Hage et al in all the mentioned aspects of how the initial water box was constructed, how long the water molecules were equilibrated before the production runs, how the protein system was restrained during the water equilibration, what force field was applied, and what types of barostat and thermostat et al were used. Therefore, the reviewers’ assertion above “We note that the setups by El Hage et al and by Gapsys and de Groot are not identical” appears incorrect. Based on this setup of the 90A box, we ran 20 simulations of 1 microsecond each. 9 of these did not complete the transition, and thus remain in the T state, which in the El Hage et al. 2018 study had been claimed as an exclusive feature of the 150A box. The fact that we observe the lack of a transition also in equally long simulations in the 90A box thus renders the conclusion of El Hage et al. invalid that the lack of a transition to R (or indeed a valid description of deoxyhemoglobin to remain ‘stable’ in T) is due to the larger box size in the 150A box.

In addition, we have also carried out simulations in larger boxes of cubic sizes of 120A and 150A. The 120A and 150A boxes were constructed from the 90A box by adding a water layer (with solvated ions) of 30 and 60A, respectively. These therefore also are identical in terms of protein configuration as well as protein solvation shell to the El Hage et al setup. We have now added this description to the manuscript. That the added solvation has created a setup indistinguishable from the El Hage et al setup for the 120A and 150A boxes is illustrated by the fact that the single trajectory findings of El Hage et al. fall well within the error bars that we provide not only for the 90A box but also for the 120A and 150A boxes. This can be even more clearly seen in our Fig. 1B, that shows that the El Hage et al. simulations fall well within the distributions we find for all the investigated box sizes.

In the response of El Hage et al. that was sent to us, their setup in terms of treatment of periodic boundary conditions is misrepresented:

- "Removing the angular center of mass motion is only warned against if the motion of the center of mass itself is not controlled, i.e. if the solute can cross the boundaries of the periodic box." Removing the angular center of mass (COM) motion in a periodic system always issues a warning in GROMACS. In addition, having atoms not in any COM group triggers another warning. Indeed, running with the El Hage et al. setup, two GROMACS warnings are triggered that need to be manually overridden to be able to continue. Overriding these warnings and nevertheless using this setup leads to severe issues with energy conservation. Note, that for all the hemoglobin simulations where the El Hage et al setup was used, despite the GROMACS warnings, we kept the COM motion removal exactly as described by El Hage et al, 2018.

- "the solute can cross the boundaries of the periodic box. This, however, is not the case in our simulations, but appeared to happen in some of theirs." In our simulations we follow best practices of MD with GROMACS and do not apply angular COM motion removal. Therefore, in this setup, the solute moving across the periodic box boundaries is not an issue for simulations: molecules, independent of being solvent or solute, are constantly moving across the periodic box boundaries without creating issues.

That other parameters in the setup indeed have an influence on the transition statistics is reflected in Fig. 3A where we show that three different hemoglobin setups in terms of e.g. chosen protonation states or protein-heme interactions show three different types of transition kinetics. In none of these three, we see a systematic effect of the box size, however.

Changes made to the manuscript:

We have now explicitly stated that the setup in our manuscript labeled ‘El Hage et al.’ is identical to that used by El Hage et al.: “The El Hage setup is obtained from El Hage et al and thus identical to the one used in (El Hage et al, 2018)” and “The molecular dynamics simulations for the El Hage setup were performed in cubic boxes and used the parameter set and initial structure obtained from El Hage et al. for the 9 nm box. The setup is therefore identical to that reported in (El Hage et al., 2018). The 12 and 15 nm setups were generated by adding an additional shell of water and ions around the 9 nm box. These generated 12 and 15 nm boxes behave indistinguishably from those reported by El Hage et al. (Fig. 1).” We have also pointed out that one critical difference to the other hemoglobin setups is the lack of a covalent bond between the iron and the proximal histidine.

Also, please revise your manuscript to address the following comments in the response from El Hage et al.

a) The comments in the sentence that starts "A possible problem with the comparisons in their figure 3…"

REPLY: The setup issue is already addressed above. It was the choice of El Hage et al to only send us their 90A setup (we had before that shared all our setups with them). The only thing we did to construct the 120A and 150A boxes was to add a layer of solvent with ions around the pre-solvated 90A box. In the same paragraph, El Hage et al write: "In that regard, it is interesting to note that their observed life time for the 90A box with its error bars essentially includes the one observed in our simulation." The same is in fact true for the 120A and 150A boxes: the single trajectory findings of El Hage et al. fall well within the error bars that we provide. This can be even more clearly seen in our Fig. 1B, that shows that the El Hage et al. simulations fall well within the distributions we find. There is thus no reason to assume 'A possible problem' with the 120A and 150A boxes.

Changes made to the manuscript:

Please see the reply to point 3 above.

b) The comments in the sentence that starts "We also note a difference in the magnitude of the error bars…"

REPLY: the errors are different because the transition times are different. Smaller absolute transition times result in smaller associated absolute errors. We now included this notion in the revised manuscript.

Changes made to the manuscript:

“Note that the difference in size of the error bars is explained by the difference in transition times: larger transition times are accompanied by larger absolute uncertainties.”

c) The comments in the paragraph that starts "When we were still collaborating…"

REPLY: This section is about the effect of protonation states. For the systems labeled 'El Hage' in our comment, the protonation states are identical to the ones of El Hage et al (2018) as the simulations started from the input provided by El Hage et al. as pointed out above. In addition, as pointed out in our comment, the El Hage et al protonation states are nearly identical to the ones in our "Hub" setup (except for one small difference of a surface histidine of which we argue that it is unlikely to substantially affect the transition kinetics) and therefore it seems odd to state (like El Hage et al do): "protonation states of the histidine residues were very different". They are different to the Kovalevsky et al. setup, the effect of which on hemoglobin we had already reported in 2013 (Vesper and de Groot, 2013). This section in the reply of El Hage et al thus seems rather confusing and does not appear to provide novel insight. In addition, the protonation states listed in Table 1 of the El Hage et al reply differ from the setup that was sent to us.

In total, we tested 3 different hemoglobin setups with different protonation states and observed no box size dependence in any of them, as stated in the manuscript: “no dependence on the simulation box size was observed for the transition times for any of the tested setups (Figure 3).”

Changes made to the manuscript:

None, as this notion was already included in the original manuscript.

4) The comment showed that using a different analysis of the water behavior leads to a different conclusion. In the reply, El Hage et al. clarified that their attribution of the box size effect to the hydrophobic effect remains a hypothesis and it requires further investigation. Indeed, this hypothesis needs further examination by careful analyses of water structures and by extensive free energy calculations. The reviewers suggest that in the revision the authors make it clear that the hydrophobic effect hypothesis is not precluded, although the original analysis by El Hage can be improved.

REPLY: our analyses reveal that the suggested box size effect on the hydrophobic effect (as quantified by hydrogen bonding, solvent RDF or water diffusion constant), disappears when normalized taking into account the different protein-to-water ratio in the different box sizes. This 'dilution' effect is an inherent (and thus unavoidable) effect associated with an increased simulation box. As this effect is sufficient to explain the observed data, this implies there is no evidence to justify assuming an additional effect on protein solvation or the hydrophobic effect. In fact, we observe this ‘dilution’ effect also in smaller systems of which El Hage et al. argue that they would not expect a box size dependence via the hydrophobic effect (added supplementary figure 1 to Fig. 2). This is an additional indication that the analysis of RDF, hydrogen bonding and water diffusion as presented is not suitable to investigate a box size dependence of the hydrophobic effect, as the same trends are observed both in systems where the hydrophobic effect is expected to play a role and where it is not. Taken together, this thus removes the justification for Figures 3, 4 and 5 of El Hage et al (2018). Please note that this does not preclude the hydrophobic effect hypothesis, the current data however do not indicate that protein solvation or the hydrophobic effect changes with the simulation box size. We have included this notion in the revised manuscript.

Finally, there are several incorrect assertions in the response from El Hage et al. about our re-analysis of the hydrophobic effect. Some examples:

- subvolume analysis: "needs to introduce “imaginary boundary conditions” and it is unclear how this was done." No imaginary boundary conditions were involved.

- "Such an approach also appears to assume that water outside this artificial volume behaves as bulk water." This is not assumed in our approach, but explicitly tested and found to hold true.

Changes made to the manuscript:

We have added the paragraph: “As the inherent, unavoidable dilution effect associated with increasing the box size is sufficient to explain the observed data,this implies there is no evidence to justify assuming an additional effect on protein solvation or the hydrophobic effect. This thus removes the justification for Figures 3, 4 and 5 of El Hage et al. (2018). It is important to note that this does not preclude the hydrophobic effect hypothesis: however, the current data do not indicate that protein solvation or the hydrophobic effect changes significantly with the simulation box size for the studied range.”

In addition, we have added an analysis of ubiquitin (supplement 1 to Fig 2) that shows the same trend of dilution effect, which, also in this case, is not related with a change of the hydrophobic effect with the box size: “The dilution effect is evident in other systems as well: (supplement 1 to Fig. 2) demonstrates the RDF and diffusion coefficient dependence on the protein-to-water ratio in ubiquitin simulations. Note that ubiquitin is significantly smaller than hemoglobin and therefore the hydrophobic effect should be expected to be significantly smaller, following the argumentation of El Hage et al. (El Hage et al., 2018). The fact that nevertheless we see a similar box size effect on the (unnormalized) RDF and diffusion constant confirms that the underlying cause is the dilution effect rather than a box size effect on the hydrophobic effect.”

5) The box size effect, if true, is necessarily a subtle one. The authors' simulations of small proteins without observing a box size effect do not serve as proof to preclude the box size effect, especially for large systems. The authors should make this important caveat clear in their discussions.

REPLY: The claimed box size effect in the study of El Hage et al was reported solely based on sparse hemoglobin data. Based on single trajectory results from this single protein, the authors suggested implications for "existing and future simulations of a wide range of systems.", thus without limiting their findings to the single system studied or in fact a system of a specific size, but rather suggesting implications for a wide range of systems. In our comment, we have studied hemoglobin in three different variations as well as three additional systems using multiple replicas in each case. We thus cover 6 different systems as a first step to address the suggested "wide range of systems". In our comment, we have explicitly limited the validity of our findings to the systems studied by using the phrase "... for the investigated systems" in the final paragraph.

Changes made to the manuscript:

None, as in contrast to El Hage et al., we had already explicitly limited the scope of our study to the investigated systems.

Associated Data

    This section collects any data citations, data availability statements, or supplementary materials included in this article.

    Supplementary Materials

    Figure 1—source data 1. Source files for RMSD and transition analysis.

    The zip archive contains a README file describing which source files correspond to the different panels.

    DOI: 10.7554/eLife.44718.005
    Figure 1—figure supplement 1—source data 1. This figure is made from the same data as Figure 1.
    DOI: 10.7554/eLife.44718.004
    Figure 2—source data 1. Source files for RDF, diffusion and hydrogen bond analysis.

    The zip archive contains a README file describing which source files correspond to the different panels.

    DOI: 10.7554/eLife.44718.009
    Figure 2—figure supplement 1—source data 1. Source files for RDF, and diffusion analysis of ubiquitin.

    The zip archive contains a README file describing which source files correspond to the different panels.

    DOI: 10.7554/eLife.44718.008
    Figure 3—source data 1. Source files for kinetics analysis.

    The zip archive contains a README file describing which source files correspond to the different panels.

    DOI: 10.7554/eLife.44718.011
    Figure 4—source data 1. Source files for thermodynamics analysis.

    The zip archive contains a README file describing which source files correspond to the different panels.

    DOI: 10.7554/eLife.44718.013

    Data Availability Statement

    We have provided the raw data for all of the graphs in all of the figures as Source data. For each figure we are providing ReadMe files that include descriptions for generating the figures.


    Articles from eLife are provided here courtesy of eLife Sciences Publications, Ltd

    RESOURCES