

Abstract
Objectives:
In 2009 and 2010, 17 primary care sites within 1 healthcare system became patient-centered medical homes (PCMHs), but the sites trained different personnel (pharmacists vs nurses) to improve diabetes care using self-management support (SMS). We report the challenges and successes of our efforts to: 1) assemble a new multipayer (Medicare, Medicaid, commercial) claims dataset linked to a clinical registry, and 2) use the new dataset to perform comparative effectiveness research on implementation of the 2 SMS models.
Study Design:
Longitudinal cohort study.
Methods:
We lost permission to use private-payer data. Therefore, we used claims from Medicare fee-for-service and Medicare/Medicaid dual-eligible patients, merged with chronic disease registry data. We studied 2008 to 2010, which included 1 year pre- and 1 year post the 2009 implementation time period. Outcomes were outpatient and emergency department visits, hospitalizations, care process (use of statin), and 3 intermediate outcomes (glycemic control, blood pressure, and low-density lipoprotein [LDL]).
Results:
In our sample of 2826 patients, quality of care improved and utilization decreased over the 2.5 years. Both approaches improved lipid control (LDL decreased by an average of 4 mg/dL for pharmacy-SMS and 5.6 mg/dL for nurse-SMS) and diastolic blood pressure (–1.5 mm Hg for pharmacy-SMS and –1.3 mm Hg for nurse-SMS), whereas only the pharmacy-led approach decreased primary care visits (by 0.8 visits). The groups differed slightly on 2 measures (glycated hemoglobin, systolic blood pressure) with respect to the trajectory of improvement over time, but performance was similar by 2.5 years.
Conclusions:
Diabetes care improved during PCMH implementation systemwide, supporting both nurse-led and pharmacist-led SMS models.
Précis:
In this longitudinal comparative effectiveness study of different chronic disease self-management support approaches within 1 system, both pharmacist- and nurse-led patient-centered medical home approaches improved diabetes care.
The American Recovery and Reinvestment Act (ARRA) invested more than $1 billion in redesigning healthcare delivery systems.1 In response to interest in using electronic health records (EHRs) to perform comparative effectiveness research (CER) on chronic disease management,2–5 we were funded by the ARRA to develop a unique database that linked a longitudinal chronic disease registry database to multipayer claims from Medicare, Medicaid, commercial, and county insurance plans. The chronic disease registry, originally designed to support the quality metrics required by the various payers, contained care process measures and some intermediate outcomes. It also had the advantage of using a physician-adjudicated process to confirm patient inclusion. Our goal was to create a large, relational database with the flexibility to allow construction of longitudinal datasets to answer specific questions about quality and utilization. The power of such a database would facilitate research that compares care among clinical sites and payer types and examines differing approaches to care.
As a proof of concept, we aimed to test for measurable improvement over time in diabetes care quality and utilization during the implementation of patient-centered medical homes (PCMHs) at the University of Michigan Health System (UMHS) in 2009, including 1 year pre- and 1 year post implementation (resulting in the study window 2008–2010). Of the conditions captured by our registry (including diabetes, heart failure, coronary artery disease [CAD], and asthma), we chose to study diabetes, the largest and most well-established disease registry. Prior research on PCMHs has shown an inconsistent benefit from PCMH efforts, such as improved quality or utilization of healthcare,6 so we used this unique opportunity to measure the longitudinal improvement in individual patients’ quality of diabetes care before, during, and after PCMH implementation.
To meet required PCMH elements,7–9 the UMHS recognized the importance of self-management support (SMS) in accomplishing 2 principles, whole-patient and multidisciplinary care. UMHS devoted the most resources to developing SMS for diabetes, a high-priority condition.
All sites were all operating under a common administration and therefore were unified under the same EHR, staffing formularies, quality metrics, chronic disease registries, and efforts to add extended hours and improve communication with patients. Personnel from all participating sites underwent the same quality improvement to improve diabetes management [ SMS care, which included education sessions, training in the use of laminated cards, standing lab-order sets, note templates, patient handouts, database, and flow sheets to track improvement. However, there was lack of consensus among the sites regarding which type of staff to train: Some sites chose to train pharmacists, while others felt that a clinical nurse coordinator model would be more effective. Both SMS models have been shown, separately, to improve diabetes care quality,10–14 making SMS a reasonable question for CER.
In this research, we report the challenges and successes of our experience with assembling and using the new multipayer diabetes dataset, and we perform CER on PCMH and 2 SMS models implemented within a single health system. We hypothesized that there would be an overall improvement over time in diabetes care process and intermediate outcomes (e.g., glycemic control) and declining utilization of outpatient and inpatient visits, but that there would be no difference on any of the measures between the 2 SMS models.
METHODS
Setting
The UMHS is a large multisite health system consisting of a main university hospital and 4 specialty hospitals. UMHS provides ambulatory care to more than 220,000 established patients. At the time of the PCMH implementation in 2009, there were 17 primary care sites (currently, as of 2017, there are 27).
Databases
In 2005, the UMHS faculty group practice developed chronic disease registries for several diseases: diabetes, heart failure, asthma, and CAD. These registries were maintained by the UMHS Quality Management Program (QMP), which had responsibility for determining patient eligibility for the chronic disease registry by triangulation of patients’ problem lists, laboratory test results, and medications relevant to that particular condition.
For entry into the diabetes registry, a patient needed to have 2 outpatient visits (with primary care or endocrinology) or 1 hospitalization or emergency department (ED) visit in the past 3 years with a billing diagnosis of diabetes which was validated by evidence of a diabetes medication (eg, insulin), diabetic supply (eg, glucometer), or glycated hemoglobin (A1C) greater than 6.4%; excluded were gestational diabetes and steroid-induced diabetes. Quality reporting was limited to those patients considered active, defined as 2 ambulatory visits within the past 2 years and 1 visit within the past 13 months.15 This method allows an unbiased assessment of care in which providers cannot selectively enter patients into the registry.
All registries were composed of longitudinal semi-annual data calculated on June 30 and December 31 reflecting whether recommended healthcare was provided in the prior 12 months. This enabled the QMP to provide health plans with longitudinal reports regarding quality of care provided to their patients.
In addition to maintaining the chronic disease registries, the QMP also submitted supplemental clinical data to health insurers and received multipayer claims to facilitate quality measurement and improvement. In 2010, the QMP was actively collecting ambulatory and hospital claims data for patients who selected a UMHS physician (eg, a managed care plan) or were attributed to a UMHS physician (e.g., fee-for-service plans) from 4 payers: 1) Medicare fee-for-service, 2) dual-eligible Medicare/Medicaid, 3) a commercial plan providing Medicaid managed care, and 4) a large commercial insurance in Michigan offering a variety of levels of coverage.
By the start of this project, we had permission from these 4 payers to merge claims data with care process measures into 1 relational dataset for future health services research. The Medicare fee-for-service data, and agreement to use the data for research, were part of Data Use Agreement (#23675) with CMS for the Physician Group Practice Medicare Demonstration Project16 and approved for human subjects research at the University of Michigan (#HUM00041118).
Sample
From the QMP diabetes registry, we selected only patients 51 years or older. Although quality measures are applied to patients aged 18 to 75 years,17 we limited the data to patients 51 years or older due to sparse data for younger patients. In addition, prior studies have shown that despite age limits on quality measures, provision of the care does not stop at age 75.18 Because there was no upper age limit for inclusion in the QMP registry, we included these patients older than 75 years for whom no quality measures for diabetes are currently defined.
Exposure
In 2008, in response to nationwide efforts to improve health system performance, UMHS began developing PCMHs at each of its 17 primary care sites. By 2009, all sites were certified as PCMHs by Blue Cross Blue Shield of Michigan criteria.8,9
Given the option of selecting either pharmacists or nurses to be trained in improved SMS for the care of diabetes, the sites were divided. Twelve sites chose the pharmacist model (pharmacy-SMS) and were, in general, the internal medicine practices, whereas the 5 sites that chose the nurse-coordinator model (nurse-SMS) were, in general, the family medicine practices. Pediatrics-only (another 9 sites) and geriatrics-only clinics (1 site) did not participate. Patients could have primary care at only 1 site.
Outcomes
We considered 3 utilization outcomes (ED visits, outpatient visits, and inpatient visits) and all quality measures collected by the QMP. Utilization of each type was expressed as number of visits over the past 12 months tallied repeatedly at the end of each 6-month period. For the care of diabetes, we decided to use 4 of the 7 collected quality measures: 1 care process variable (whether or not a statin was ordered, as a dichotomous outcome) and 3 intermediate clinical outcomes (glycemic control [A1C], in % points; blood pressure [BP], systolic and diastolic, in mm Hg; and low-density lipoprotein [LDL], in mg/dL, all as continuous variables). For each 6-month reporting period, the quality measures were calculated using the most recent data up to 12 months.
Analysis
We used χ2 tests to compare patient characteristics for patients between the 2 SMS types, using the baseline sample of patients at time point 1. We used t tests to test for adjusted simple temporal trends in the outcomes over the 2.5-year study.
Implementation of the PCMH at each of the 17 sites took place during time points 2, 3, and 4, over varying months that could span more than one 6-month period. Because we were unable to designate a single point in time when we could directly assess a change in slope, we assessed the mean slope in outcomes across the 5 time points, where time point 1 assuredly occurred before implementation of the PCMH at all sites, and time point 5 assuredly occurred at least 6 months after the implementation of the PCMH at all the clinical sites. To analyze each outcome measure, we used multilevel regression (logistic for statin use; linear for the continuous utilization and intermediate outcomes), including a random-intercept for each patient. Our predictors were SMS type (pharmacy-SMS vs nurse-SMS), time (in 5 half-year increments), quadratic transformation of time (time-squared, which tests for curvilinear trajectories), and time interactions with SMS type (SMS type multiplied by both the linear and quadratic time term). Multilevel regression allows use of data from all patients, even those who entered late, exited the dataset early, or had missing time points. Because patients who utilize less ambulatory care generally are delivered less recommended care,19–21 dropping patients with incomplete data would be expected to result in biased estimates for the QMP measures. Using this method, the result of the time variable indicates mean change in each outcome per time period (i.e., the slope over time) for the entire sample; the SMS-type variable indicates the overall mean difference in the outcome between the 2 groups; and the time-SMS interaction term indicates the overall difference in slope over time between the 2 groups.
Patients seeking care at the pharmacist-SMS sites were more complex (had a higher comorbid condition count) than those at the nurse-SMS sites. Because a more complex patient population22 might facilitate providing better diabetes care,19,20,23–25 we performed a propensity score model. We calculated inverse probability weights26 for each patient based on age, gender, and comorbid condition count to adjust for each patient’s likelihood of seeking care at either of the 2 types of SMS sites, then applied the weights as controls to the final multivariable models.
RESULTS
During 2010, UMHS served more than 12,000 established patients with diabetes (Figure 1) from any source of all-payer claims data. We constructed all utilization and comorbidity variables across five 6-month time periods from July 2008 to December 2010. We then merged claims data from 4 payers with which we had agreements (Medicare fee-for-service, Medicare-Medicaid dual-eligible, commercial-Medicaid managed care, and a large commercial plan) with chronic disease registry data by patient and time period. This resulted in a merged dataset with 9637 unique patients with diabetes (Figure 1).
Figure 1.

Flow of a Large Single-System Diabetes Chronic Disease Registry Merged With Multipayer Claims to Conduct a Comparative Effectiveness Research Analysis
AHRQ indicates Agency for Healthcare Research and Quality; PCMH, patient-centered medical home; SMS, self-management support.
aDemonstration of flow of potential data from entire population of patients at University of Michigan Health Services (UMHS), captured by any multiple chronic disease registries, through analytic sample used for longitudinal comparative effectiveness research. Loss of data use permission resulted in decreased sample size, which reduced ability to study multiple chronic conditions. The final analysis compared the effect of 2 models of SMS, 1 pharmacy-based and 1 nurse-based, that were implemented during an effort to establish a systemwide PCMH.
However, in 2012 the commercial insurers decided to limit any reporting of results of our analyses to quality improvement reporting. We had an executed Data Use Agreement (DUA) with Medicare, as well as University of Michigan Institutional Review Board (IRB) approval, so we were able to report analyses using Medicare fee-for-service and dual-eligible patients. When we restricted the study group to Medicare, we included 2826 unique patients in Medicare fee-for-service and dual Medicare-Medicaid (Figure 1). After restricting the data to those 51 years and older, the number of patients per time period ranged from 2221 in the first time point to 1701 in the 5th time point.
There were a few notable differences in baseline demographic and clinical characteristics of patients in the 2 SMS models (Tables 1 and 2). Patients in the pharmacy-SMS were sicker (2.6 compared with 2.3 chronic conditions) than those in nurse-SMS. The nurse-SMS sites started with higher mean BP of patients at baseline (Table 2) (133/70 vs 129/68 mm Hg; P <.001), and the patients used more primary care (5.7 vs 5.3 annual visits; P <.03), whereas the pharmacy-SMS clinics’ patients used more specialty care (4.9 vs 3.2; P <.001) and hospitalizations (0.55 vs 0.39; P <.01) annually.
Table 1.
Sample Characteristics for 2221 Patients With Diabetes from First 6-Month Period (July- December 2010)
| Characteristic | Pharmacy-Led PCMHs (n = 1666 patients at 12 sites) | Nurse-Led PCMHs (n = 555 patients at 5 sites) | Pa | ||
|---|---|---|---|---|---|
| Mean | 95% CI | Mean | 95% CI | ||
| Age, years | 71.6 | 71.2–72.0 | 70.9 | 70.1–71.7 | .14 |
| Female gender, % | 54.5% | 52.1%−56.9% | 56.4% | 52.2%−60.5% | .44 |
| Time periods in data set, n | 3.84 | 3.77–3.91 | 3.91 | 3.79–4.03 | .302 |
| Dual-eligible Medicaid and Medicare, % | 16% | 14%−18% | 17% | 14%−20% | .7 |
| Medicare fee-for-service only, % | 84% | 82%−86% | 83% | 80%−86% | |
| Conditions, n | 2.60 | 2.50–2.69 | 2.31 | 2.17–2.46 | .002 |
PCMH indicates patient-centered medical home.
P values for t test.
Baseline variables are calculated based on information on the end of the first 6-month period, December 31, 2008. Comorbidity is based on all outpatient claims for calendar year 2008, 1 point for each of the following hierarchical condition categories (HCC) groups: HCC10 (breast, prostate, colorectal, and other cancers and tumors), HCC15 (diabetes with renal or peripheral circulatory manifestation), HCC17 (diabetes with acute complications), HCC19 (diabetes without complication), HCC21 (protein-calorie malnutrition), HCC26 (cirrhosis of liver), HCC27 (Chronic hepatitis), HCC51 (drug/alcohol psychosis), HCC52 (drug/alcohol dependence), HCC55 (major depressive, bipolar, and paranoid disorders), HCC73 (Parkinson’s and Huntington’s disease), HCC80 (congestive heart failure), HCC81 (acute myocardial infarction), HCC82 (unstable angina and other acute ischemic heart disease), HCC83 (angina pectoris or myocardial infarction), HCC92 (specified heart arrhythmias), HCC96 (ischemic or unspecified stroke), HCC104 (vascular disease with complications), HCC105 (vascular disease), HCC108 (chronic obstructive pulmonary disease), HCC130 (dialysis status), HCC131 (renal failure), HCC157 (vertebral fractures without spinal cord injury), HCC158 (hip fracture/dislocation). This subset of the full set of 70 HCCs includes chronic conditions that contribute additional complexity to the care of older ambulatory care patients.2
Table 2.
Baseline and Unadjusted Change in Outcome Variables Over 2.5 Years Pre- vs Post Implementation of PCMHs
| Outcomes | Baseline Values December 2008 (n = 2221) | December 2010 vs December 2008 | |||||
|---|---|---|---|---|---|---|---|
| Mean | Pa | Patients in Pharmacy-Led PCMHs | Patients in Nurse-Led PCMHs | ||||
| Patients in Pharmacy- Led PCMHs (n =1666) | Patients in Nurse-Led PCMHs (n = 555) | ||||||
| Mean Differenceb | P | Mean Differenceb | P | ||||
| Glycemic control (glycated hemoglobin) | 7.06 | 7.07 | .92 | −0.01 | .93 | 0.02 | .83 |
| Lipid control (LDL in mg/dL) | 86.83 | 88.95 | .16 | −4.09 | <.001 | −5.56 | <.001 |
| Systolic BP | 129.42 | 132.64 | <.001 | 1.29 | .06 | −1.70 | .13 |
| Diastolic BP | 67.58 | 70.08 | <.001 | −1.45 | <.001 | −1.28 | .048 |
| Statin (proportion receiving) | 0.87 | 0.86 | .37 | 1.00c | .76c | 1.01c | .67c |
| Annual primary care office visitsd | 5.30 | 5.74 | .03 | −0.83 | <.001 | −0.26 | .29 |
| Annual specialty care office visitsd | 4.87 | 3.23 | <.001 | −0.13 | .46 | 0.08 | .74 |
| Annual hospitalizationsd | 0.55 | 0.39 | <0.01 | 0.02 | .63 | 0.03 | .68 |
| Annual emergency visitsd | 0.48 | 0.41 | .16 | −0.04 | .19 | 0.07 | .34 |
BP indicates blood pressure; LDL, low-density lipoprotein; PCMH, patient-centered medical home.
Unpaired t test between the 2 PCMH groups.
Mean difference = last minus first value. Paired t test between the first versus last mean value.
Ratio of 2 proportions (between last/first), McNemar’s χ2 test.
Utilization (visits and hospitalizations) was calculated for calendar year 2008 for baseline year, versus calendar year 2010 for the postimplementation year. Hospitalizations include acute care and outpatient observation admissions. Emergency visits includes emergency department and emergency observation unit visits.
Over the duration of the study (2010 vs 2008, which includes implementation of the PCMHs), there were significant (P <.05) downward trends in unadjusted LDL (Table 1) (–4 mg/dL for pharmacy-SMS vs –5.6 mg/dL for nurse-SMS), diastolic BP (–1.5 mm Hg for pharmacy-SMS, –1.3 mm Hg for nurse-SMS), and utilization of primary care (0.8 office visits for pharmacy-SMS only).
When we measured nonlinear trajectories across 2008 to 2010 (including PCMH implementation during 2009) between the 2 models, however, we found small, but statistically significant, differences in quality of care trajectories between the groups. The nurse-SMS patients had an initial increase (ie, positive slope from prior to during PCMH implementation) followed by a decrease in A1C after PCMH implementation, resulting in a net 0.1% improvement. For pharmacy-SMS, the patients’ A1C remained flat at 7.1% (P <.001 for the difference in time trajectories between SMS types) (Figure 2). Second, systolic BP started higher in the nurse-SMS patients (133 vs 129 mm Hg) (Table 2) and had a steeper decline in the early period (P <.01) (Figure 2).
Figure 2.
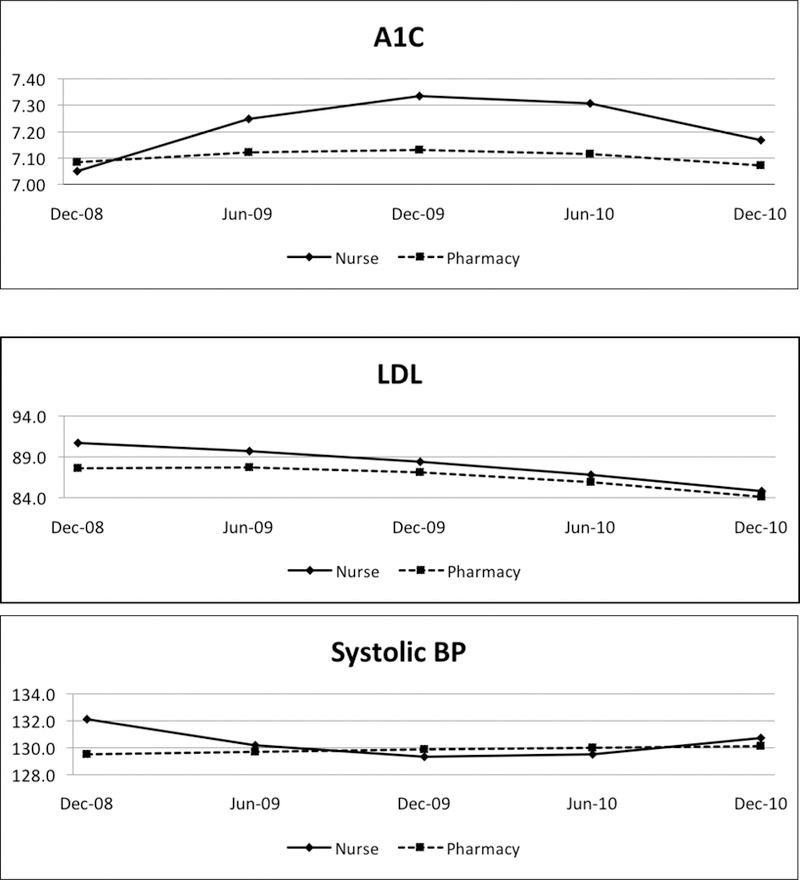


Trajectories of Performance Measures and Utilization Across Implementation of Nurse Versus Pharmacy-Led Self-Management Support Models of PCMH
A1C indicates glycated hemoglobin; BP, blood pressure; ED, emergency department; LDL, low-density lipoprotein cholesterol; PCMH, patient-centered medical home.
When we applied propensity scores (inverse probability weights based on comorbid condition count, age, and gender) to the final multivariable models, there were no changes in any of the results concerning differences in change over time by SMS-type.
DISCUSSION
The use of EHR and registry data merged with administrative claims across healthcare sites and payers has been championed as a hallmark of modern patient-oriented CER.2–5 We were ideally poised to assemble a longitudinal dataset for such use during a 2.5-year period that spanned time pre- and post implementation of a PCMH model across multiple clinical sites in a large healthcare system, with sites differing only by type of SMS: pharmacy-based versus nurse-based SMS. However, our efforts were challenged by changes in the private sector with regards to using claims data for research. Despite the challenges, we were able to use Medicare and dual-eligible data (CMS DUA#23675). We found modest longitudinal improvements in unadjusted LDL (4 and 5.6 mg/dL for pharmacy- and nurse-based SMS, respectively) and diastolic BP (1.5 and 1.3 mm Hg for pharmacy- and nurse-based SMS, respectively), thus supporting SMS in general. When comparing the trajectories of the 2 SMS models across the 2.5-year study period, the clinical outcomes were similar. We found a small difference in rate of improvement of glycemic control and systolic BP that modestly favored the nurse-based SMS model, possibly due to a poorer baseline performance (therefore they had more room to improve more quickly). Both groups decreased annual utilization of primary care, but the pharmacy-based SMS significantly decreased utilization by 0.83 visits in comparison with their pre-implementation rates.
Our findings are consistent with prior studies of PCMH overall that found little effect on clinical outcomes,21 including a study that also used longitudinal methods.6 Specifically regarding diabetes care, our results are consistent with a recent meta-analysis of 48 PCMHs, which found average decreases in LDL of 3.9 mg/dL and of 1.5 mm Hg in diastolic BP.14
To our knowledge, ours is the first study to conduct a concurrent comparison of 2 different SMS models within otherwise similar PCMH models within 1 health system.11 Prior studies have grouped the SMS models, whether nurse- or pharmacist-led, into promotion of self-management or team changes.14,28 Overall, we found statistically significant, but not substantial, differences between SMS models. Slightly poorer baseline values among the nurse-SMS patients likely contributed to greater room for improvement, a finding also observed in meta-analysis.14 It is important to note that improved intermediate measures (LDL, A1C, BP) suggest improved cardiovascular risk profiles, but finding cardiovascular benefits would require longer follow-up to realize, a larger sample size of sites beyond our system, and more aggressive interventions.
Because the patients attributed to the 2 SMS models also differed by medical complexity, the small differences in quality we observed could also have been due in part to patient-level differences. Patients with more complex comorbid condition burden are more likely to receive recommended healthcare.19,20–21,25,29–31 We lacked the sample size (number of sites) and variation to be able to formally test for confounding by comorbidity, however, so we applied a propensity score by patient as an alternative approach.
Limitations
There are several limitations to this study. First, we lacked a concurrent control group, ie, non-PCMH patients, which decreased our ability to detect differences. Second, because we only had 2 sources of payer data, we cannot generalize our findings across multiple payer sources. Third, clinical outcomes (glycemic control, BP, and lipid control) were calculated only among those monitored for the outcomes, ie, a patient without a lipid level could not be included in the lipid control outcome. When 1 measure depends on the proper performance of an upstream variable, biases in performance can be introduced. One approach is to give a failing score for the downstream performance measure if the earlier process is not performed,32 which would provide additional incentive to perform the upstream care.
Despite the limitations, our study had certain strengths. We used multiple snapshots across time, which can capture differences in trajectories in addition to overall differences over time. We harnessed 17 sites, garnering a larger sample than would be possible within 1 clinical quality improvement site.
We faced a key barrier to performing multi-payer health services research: loss of permission to use private-payer claims data for research. Until merged datasets can be constructed with equivalent health services variables and durable continuing permission to perform research, it will be difficult to efficiently perform CER across or between payers. Future research in comparing chronic care delivery approaches may be best served in large single-payer system with a diversity of patient complexity, such as the Veterans Affairs Healthcare System.
CONCLUSIONS
This research makes use of sponsored creation of a relational database linking clinical and administrative claims data. PCMH and 2 different models of SMS improved diabetes care. However, our permission to use the merged dataset for CER was not durable, and therefore limited the potential power of performing multipayer research. Future efforts need to be redoubled to develop further infrastructure that will allow for multipayer CER and care process research.
Takeaway Points.
We compared 2 chronic disease self-management support approaches (pharmacist- vs nurse-led) within 1 healthcare system over 2.5 years.
Both approaches improved lipid control and diastolic blood pressure.
Only the pharmacy-led approach decreased primary care visits.
When examining the trajectory of change over 2.5 years, there were small differences in trajectory of glycated hemoglobin and systolic blood pressure change favoring the nurse-led approach. However, both differences could be explained by preexisting differences in patient populations prior to patient-centered medical home implementation. By study end, there was no difference in either measure.
Therefore, we conclude that both approaches can improve quality of diabetes self-management support.
Acknowledgments
Source of Funding: This project was supported by the AHRQ R24 HS019459 (Blaum, Clinical Database to Support Comparative Effectiveness Studies of Complex Patients). Dr Min was also supported by the NIA-Claude Pepper Older Americans Independence Centers at the University of Michigan (AG024824, 2010–12) and the Hartford Foundation. Dr Cigolle was also supported by K08 and the Hartford Foundation.
Contributor Information
Lillian Min, Division of Geriatric and Palliative Medicine University of Michigan Medical School, Ann Arbor, MI, Geriatrics Research, Education and Clinical Care Center Ann Arbor VA Healthcare System, Ann Arbor, MI, Geriatrics Research, Education and Clinical Care Center and Center for Clinical Management Research Ann Arbor VA Healthcare System, Ann Arbor, MI.
Christine T. Cigolle, Division of Geriatric and Palliative Medicine University of Michigan Medical School, Ann Arbor, MI, Department of Internal Medicine, and Department of Family Medicine University of Michigan Medical School, Ann Arbor, MI, Geriatrics Research, Education and Clinical Care Center Ann Arbor VA Healthcare System, Ann Arbor, MI.
Steven J. Bernstein, Division of Geriatric and Palliative Medicine and Division of General Medicine University of Michigan Medical School, Ann Arbor, MI, Geriatrics Research, Education and Clinical Care Center and Center for Clinical Management Research Ann Arbor VA Healthcare System, Ann Arbor, MI.
Kathleen Ward, University of Michigan Health System Ann Arbor, MI.
Tisha L. Moore, Division of Geriatric and Palliative Medicine University of Michigan Medical School, Ann Arbor, MI.
Jinkyung Ha, Division of Geriatric and Palliative Medicine University of Michigan Medical School, Ann Arbor, MI.
Caroline S. Blaum, Departments of Medicine and Population Health, New York University Langone Medical Center New York, NY.
REFERENCES
- 1.Institute of Medicine. Initial National Priorities for Comparative Effectiveness Research Washington, DC: The National Academies Press; 2009. [Google Scholar]
- 2.Etheredge LM. A rapid-learning health system. Health Aff (Millwood) 2007;26(2):w107–w118. doi: 10.1377/hlthaff.26.2.w107. [DOI] [PubMed] [Google Scholar]
- 3.Panzer RJ, Gitomer RS, Greene WH, Webster PR, Landry KR, Riccobono CA. Increasing demands for quality measurement. JAMA 2013;310(18):1971–1980. doi: 10.1001/jama.2013.282047. [DOI] [PubMed] [Google Scholar]
- 4.Glasgow RE, Vinson C, Chambers D, Khoury MJ, Kaplan RM, Hunter C. National Institutes of Health approaches to dissemination and implementation science: current and future directions. Am J Public Health 2012;102(7):1274–1281. doi: 10.2105/AJPH.2012.300755. [DOI] [PMC free article] [PubMed] [Google Scholar]
- 5.Riley WT, Glasgow RE, Etheredge L, Abernethy AP. Rapid, responsive, relevant (R3) research: a call for a rapid learning health research enterprise. Clin Transl Med 2013;2(1):10. doi: 10.1186/2001-1326-2-10. [DOI] [PMC free article] [PubMed] [Google Scholar]
- 6.Jackson GL, Powers BJ, Chatterjee R, et al. Improving patient care: the patient-centered medical home: a systematic review. Ann Intern Med 2013;158(3):169–178. doi: 10.7326/0003-4819-158-3-201302050-00579. [DOI] [PubMed] [Google Scholar]
- 7.Rittenhouse DR, Shortell SM. The patient-centered medical home: will it stand the test of health reform? JAMA 2009;301(19):2038–2040. doi: 10.1001/jama.2009.691. [DOI] [PubMed] [Google Scholar]
- 8.American Academy of Family Physicians; American Academy of Pediatrics; American College of Physicians; American Osteopathic Association. Joint principles of the patient-centered medical home American Academy of Family Physicians website; www.aafp.org/dam/AAFP/documents/practice_management/pcmh/initiatives/PCMHJoint.pdf Published March 7, 2007. Accessed May 1, 2015. [Google Scholar]
- 9.Patient-centered medical home. [Published 2014. Accessed September 16, 2015.];Blue Cross Blue Shield Value Partnerships website. www.valuepartnerships.com/vp-program/patient-centered-medical-home.
- 10.Gabbay RA, Bailit MH, Mauger DT, Wagner EH, Siminerio L. Multipayer patient-centered medical home implementation guided by the chronic care model. Jt Comm J Qual Patient Saf 2011;37(6):265–273. [DOI] [PubMed] [Google Scholar]
- 11.Haas L, Maryniuk M, Beck J, et al. ; 2012 Standards Revision Task Force. National standards for diabetes self-management education and support. Diabetes Care 2013;36(suppl 1):S100–S108. doi: 10.2337/dc13-S100. [DOI] [PMC free article] [PubMed] [Google Scholar]
- 12.Morgan TO, Everett DL, Dunlop AL. How do interventions that exemplify the joint principles of the patient centered medical home affect hemoglobin A1C in patients with diabetes: a review. Health Serv Res Manag Epidemiol 2014;1:2333392814556153. doi: 10.1177/2333392814556153. [DOI] [PMC free article] [PubMed] [Google Scholar]
- 13.Ackroyd SA, Wexler DJ. Effectiveness of diabetes interventions in the patient-centered medical home. Curr Diab Rep 2014;14(3):471. doi: 10.1007/s11892-013-0471-z. [DOI] [PMC free article] [PubMed] [Google Scholar]
- 14.Tricco AC, Ivers NM, Grimshaw JM, et al. Effectiveness of quality improvement strategies on the management of diabetes: a systematic review and meta-analysis. Lancet 2012;379(9833):2252–2261. doi: 10.1016/S0140-6736(12)60480-2. [DOI] [PubMed] [Google Scholar]
- 15.Smith KA, Sussman JB, Bernstein SJ, Hayward RA. Improving the reliability of physician “report cards”. Med Care 2013;51(3):266–274. doi: 10.1097/MLR.0b013e31827da99c. [DOI] [PMC free article] [PubMed] [Google Scholar]
- 16.Iglehart JK. Assessing an ACO prototype—Medicare’s Physician Group Practice demonstration. N Engl J Med 2011;364(3):198–200. doi: 10.1056/NEJMp1013896. [DOI] [PubMed] [Google Scholar]
- 17. [Published 2012. Accessed May 1, 2015.];2011–2012 eligible professional Clinical Quality Measures (CQMs). Diabetes quality measures (575, 55, 62, 56, 64, 61). CMS website. www.cms.gov/regulations-and-Guidance/legislation/ehrincentiveprograms/downloads/CQM_EPs_2012_02_02.pdf.
- 18.Jha AK, Perlin JB, Kizer KW, Dudley RA. Effect of the transformation of the Veterans Affairs Health Care System on the quality of care. N Engl J Med 2003;348(22):2218–2227. doi: 10.1056/NEJMsa021899. [DOI] [PubMed] [Google Scholar]
- 19.Higashi T, Wenger NS, Adams JL, et al. Relationship between number of medical conditions and quality of care. N Engl J Med 2007;356(24):2496–2504. doi: 10.1056/NEJMsa066253. [DOI] [PubMed] [Google Scholar]
- 20.Min LC, Wenger NS, Fung C, et al. Multimorbidity is associated with better quality of care among vulnerable elders. Med Care 2007;45(6):480–488. doi: 10.1097/MLR.0b013e318030fff9. [DOI] [PubMed] [Google Scholar]
- 21.Min L, Kerr EA, Blaum CS, Reuben D, Cigolle C, Wenger N. Contrasting effects of geriatric versus general medical multimorbidity on quality of ambulatory care. J Am Geriatr Soc 2014;62(9):1714–1721. doi: 10.1111/jgs.12989. [DOI] [PMC free article] [PubMed] [Google Scholar]
- 22.Min L, Wenger N, Walling AM, et al. When comorbidity, aging, and complexity of primary care meet: development and validation of the Geriatric CompleXity of Care Index. J Am Geriatr Soc 2013;61(4):542–550. doi: 10.1111/jgs.12160. [DOI] [PMC free article] [PubMed] [Google Scholar]
- 23.Min LC, Reuben DB, MacLean CH, et al. Predictors of overall quality of care provided to vulnerable older people. J Am Geriatr Soc 2005;53(10):1705–1711. doi: 10.1111/j.1532-5415.2005.53520.x. [DOI] [PubMed] [Google Scholar]
- 24.Piette JD, Kerr EA. The impact of comorbid chronic conditions on diabetes care. Diabetes Care 2006;29(3):725–731. [DOI] [PubMed] [Google Scholar]
- 25.Kerr EA, Lucatorto MA, Holleman R, Hogan MM, Klamerus ML, Hofer TP; VA Diabetes Quality Enhancement Research Initiative (QUERI) Workgroup on Clinical Action Measures. Monitoring performance for blood pressure management among patients with diabetes mellitus: too much of a good thing? Arch Intern Med 2012;172(12):938–945. doi: 10.1001/archinternmed.2012.2253. [DOI] [PMC free article] [PubMed] [Google Scholar]
- 26.Harder VS, Stuart EA, Anthony JC. Propensity score techniques and the assessment of measured covariate balance to test causal associations in psychological research. Psychol Methods 2010;15(3):234–249. doi: 10.1037/a0019623. [DOI] [PMC free article] [PubMed] [Google Scholar]
- 27.Kern LM, Edwards A, Kaushal R. The patient-centered medical home and associations with health care quality and utilization: a 5-year cohort study. Ann Intern Med 2016;164(6):395–405. doi: 10.7326/M14-2633. [DOI] [PubMed] [Google Scholar]
- 28.Shojania KG, Ranji SR, McDonald KM, et al. Effects of quality improvement strategies for type 2 diabetes on glycemic control: a meta-regression analysis. JAMA 2006;296(4):427–440. doi: 10.1001/jama.296.4.427. [DOI] [PubMed] [Google Scholar]
- 29.Petersen LA, Woodard LD, Henderson LM, Urech TH, Pietz K. Will hypertension performance measures used for pay-for-performance programs penalize those who care for medically complex patients? Circulation 2009;119(23):2978–2985. doi: 10.1161/CIRCULATIONAHA.108.836544. [DOI] [PMC free article] [PubMed] [Google Scholar]
- 30.Woodard LD, Urech T, Landrum CR, Wang D, Petersen LA. Impact of comorbidity type on measures of quality for diabetes care. Med Care 2011;49(6):605–610. doi: 10.1097/MLR.0b013e31820f0ed0. [DOI] [PMC free article] [PubMed] [Google Scholar]
- 31.Woodard LD, Landrum CR, Urech TH, Wang D, Virani SS, Petersen LA. Impact of clinical complexity on the quality of diabetes care. Am J Manag Care 2012;18(9):508–514. [PMC free article] [PubMed] [Google Scholar]
- 32.Min LC, Reuben DB, Adams J, et al. Does better quality of care for falls and urinary incontinence result in better participant-reported outcomes? J Am Geriatr Soc 2011;59(8):1435–1443. doi: 10.1111/j.1532-5415.2011.03517.x. [DOI] [PMC free article] [PubMed] [Google Scholar]