Abstract.
We aimed to design and fabricate synthetic lung nodules with patient-informed internal heterogeneity to assess the variability and accuracy of measured texture features in CT. To that end, 190 lung nodules from a publicly available database of chest CT images (Lung Image Database Consortium) were selected based on size () and malignancy. The texture features of the nodules were used to train a statistical texture synthesis model based on clustered lumpy background. The model parameters were ascertained based on a genetic optimization of a Mahalanobis distance objective function. The resulting texture model defined internal heterogeneity within 24 anthropomorphic lesion models which were subsequently fabricated into physical phantoms using a multimaterial three-dimensional (3-D) printer. The 3-D-printed lesions were imbedded in an anthropomorphic chest phantom and imaged with a clinical scanner using different acquisition parameters including slice thickness, dose level, and reconstruction kernel. The imaged lesions were analyzed in terms of texture features to ascertain the impact of CT imaging on lesion texture quantification. The texture modeling method produced lesion models with low and stable Mahalanobis distance between real and synthetic textures. The virtual lesions were successfully printed into 3-D phantoms. The accuracy and variability of the measured features extracted from the CT images of the phantoms showed notable influence from the imaging acquisition parameters with contrast, energy, and texture entropy exhibiting most sensitivity in terms of accuracy, and contrast, dissimilarity, and texture entropy most variability. Thinner slice thicknesses yielded more accurate and edge reconstruction kernels more stable results. We conclude that printed textured models of lesions can be developed using a method that can target and minimize the mathematical distance between real and synthetic lesions. The synthetic lesions can be used as the basis to investigate how CT imaging conditions might affect radiomics features derived from CT images.
Keywords: radiomics, heterogeneous lesions, lung lesions, texture features, 3-D printing, imaging physics, genetic algorithm
1. Introduction
The recent increased use of CT for lung cancer screening and classification has led to a growing interest in developing the ability to predict lung nodule malignancy and progression from image datasets.1 In recent years, with the emergence of radiomics and quantitative imaging, there have been several studies2–4 attempting to both quantify internal heterogeneity and shape features of lung nodules visible on CT scans and to relate the measured quantities to clinical outcomes. For example, internal nodule heterogeneity, quantified in the form of texture features, has been shown to be inversely associated with likelihood of metastasis and resistance to therapy.5 Textural features derived from CT scans, combined with tumor staging, have been suggested as strong predictors of survival in nonsmall cell lung cancer.6,7
Despite the encouraging utility of lesion texture to quantify malignancy, it is unclear if clinical implementation of texture-based radiomics systems is warranted. This is primarily due to the uncertainty about the sensitivity of measured texture features to the varying scan and reconstruction settings. For example, it has been shown that texture features can significantly change with changes in reconstruction algorithms8,9 and slice thickness.9 Another study10 has noted that smooth and sharp kernels cannot be used interchangeably for measuring texture features in images. Although these effects are well demonstrated, it is difficult to objectively quantify and mitigate the influence without knowing the ground truth of a lesion. The uniform and geometrically simple lung nodule phantoms, while having known properties, do not possess heterogeneity to study the quantification of texture features. There thus remain a gap to develop physical models of lung nodules, with anthropomorphic shapes and realistic internal textures, to serve as ground truth for lesion quantification studies.
The purpose of this study was to fabricate synthetic lung nodule phantoms with patient-informed internal heterogeneity and morphology, and to pilot the utility of these phantoms to ascertain the sensitivity of texture quantification to common variations in CT parameters. To that end, a method was developed to generate anatomically informed morphology and texture based on CT images of real lung nodules. That method was used to design and fabricate a series of synthetic lung nodules with realistic shapes and textures using 3-D printing. The 3-D-printed nodules were then imaged to assess the precision and accuracy of the simulated texture feature measurements across varying imaging conditions on a clinical CT system.
2. Materials and Methods
This study was performed in three stages. First, a patient-informed synthetic texture model was created using texture features extracted from CT images containing lung nodules. Second, the synthetic texture was used to virtually design and then fabricate a series of 3-D-printed nodule models with anthropomorphic shapes. Lastly, one use of the 3-D-printed nodules was demonstrated in a pilot trial of assessing the variability and accuracy of model-generated features across a select range of CT acquisition parameters.
2.1. Modeling of Synthetic Texture
The methods used by two prior studies to create textured liver and breast11,12 were adapted in this study to create a model of texture in lung lesions based on real nodule textures. The image data were obtained from the online database of Lung Image Database Consortium (LIDC-IDRI), which contains 1019 patient CT datasets with associated nodule malignancy score, based on radiologist consent, and manual tracings. The LIDC database, containing patient data from 17 different scanners, was narrowed down to patient image series within a single family of scanner models (Lightspeed, GE Healthcare). The nodules within the patient image series were then further narrowed based on nodule malignancy scores (provided by the LIDC) and nodule size. Specifically, nodules with malignancy score greater than 3 (on a 1 to 5 scale) were chosen to target texture attributes of malignant nodules. Nodules that were greater than 3 mm in-plane diameter size were also chosen to match a size category determined by the original LIDC study. Nodules that were not visible on at least three slices of the image were excluded. In total, 190 nodules were identified from 103 patient image series as meeting these criteria.
Since the LIDC database did not contain any metrics for nodule internal heterogeneity, the presence of internal heterogeneity in the nodules was ascertained by two experienced radiologists. The radiologists’ scored the nodules from both neighboring pixels and regional intensity variations of the lesions. Based on the in-consensus results of the radiologists, each nodule was grouped into one of three categories: homogeneous (category 1), medium heterogeneity (category 2), and high heterogeneity (category 3).
The images of the nodules were resampled to have uniform isotropic voxel size of for consistency of texture feature measurement.13 The resampling was performed to maintain isotropic voxel size which is a requirement to compute some features in three-dimensional (3-D). The gray-level co-occurrence matrix (GLCM) and gray-level run-length matrix (GLRLM), calculated in 3-D, were used to derive texture features. The choice of these features was made based on prior studies indicating their potential clinical importance7,14 and their complementary reflection of texture. GLCM features are sensitive to intensities at different positions relative to each other while GLRLM features are sensitive to regional variances.15 For each nodule, GLCM and GLRLM features,16 listed in Table 1, were first measured and then grouped according to the nodule’s heterogeneity category. In total, 21 features were calculated for each nodule.
Table 1.
List of texture features calculated from synthetic and real nodules.
| Statistic | Extracted features |
|---|---|
| GLCM | Energy |
| Contrast | |
| Correlation | |
| Homogeneity | |
| Variance | |
| Sum average | |
| Texture entropy | |
| Dissimilarity | |
| GLRLM | Short run emphasis |
| Long run emphasis | |
| Gray-level nonuniformity | |
| Run length nonuniformity | |
| Run percentage | |
| Low gray-level run emphasis | |
| High gray-level run emphasis | |
| Short run low gray-level emphasis | |
| Short run high gray-level emphasis | |
| Long run low gray-level emphasis | |
| Long run high gray-level emphasis | |
| Gray-level variance | |
| Run-length variance |
The calculated texture features from patient nodules were used to inform a synthetic texture model. A 3-D clustered lumpy background (CLB) texture synthesis technique was used to create patient-informed textures emulating categories 2 and 3 of heterogeneities of the real nodules (recalling the category 1 nodules were homogenous). The CLB texture synthesis method creates a textured image by summing randomly positioned anisotropic exponential functions governed by a set of input parameters (Table 2).17,18
Table 2.
Parameters that govern the CLB texture model.
| Parameter | Definition |
|---|---|
| Number of CLB seed points | |
| Number of subseed points for each CLB seed point | |
| , , | Radial distances between an initial seed point and its associated group of subseed points |
| , , | Length of anisotropic exponential in each direction |
| , | Coefficients that affect the anisotropic exponential shape |
The CLB texture parameters were optimized following prior studies for creating liver11 and mammographic12 textures. The method used a genetic algorithm to iteratively update an initial set of CLB parameters, which served as seed points to generate synthetic CLB textures. The initial seed points and lower and upper bounds on those points are provided in Table 3. The overall structural parameters used in the genetic algorithm are listed in Table 4.
Table 3.
3-D-CLB bounds for the genetic algorithm.
| Bounds | ||||||||||
|---|---|---|---|---|---|---|---|---|---|---|
| Lower | 0.0001 | 1 | 1 | 1 | 1 | 1 | 1 | 1 | 1 | 1 |
| Upper | 0.05 | 20 | 5 | 5 | 5 | 2 | 2 | 5 | 5 | 5 |
| Initial | 0.01 | 10 | 2 | 2 | 2 | 1 | 1 | 2 | 2 | 2 |
Table 4.
The parameters of the genetic algorithm.
| Parameter | Definition | Value |
|---|---|---|
| Number of genes in a chromosome (number of parameters in a set) | 10 | |
| Size of chromosome population (number of sets of parameters) | 200 | |
| Number of times a chromosome was generated (number of times a 3-D-CLB volume was generated from the same set) | 10 | |
| Crossover probability (the probability of a parameter in a set surviving to the next iteration) | 0.8 | |
| Number of iterations | 100 |
The initial synthesized textures were blurred using the CT system’s modulation transfer function, and noise was added following the CT system’s noise power spectrum. The purpose of added blur and noise was to make the synthesized texture comparable and thus verifiable against textures in CT images of real lesions, which are similarly blurred and noised by the imaging system. The 3-D texture features described in Table 1 were extracted from the synthetic lesions (), post-blur, and noise and compared with those same texture features measured from real lesions in CT images () using the following equation:
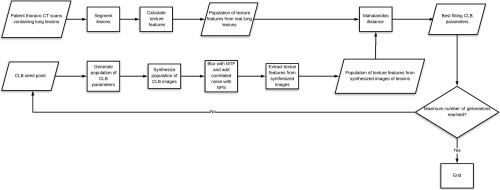
where and are the means and covariance of the real lesions , respectively. The genetic algorithm used the Mahalanobis distance as the objective function and iteratively updated the 3-D-CLB parameters in new iterations to minimize this distance. During this process, 21 texture features were calculated for both the population of synthesized textured lesions in a given generation and the patient lesion images. These texture features were all inputs to eventually calculate one single value of Mahalanobis distance. The algorithm ran for 100 iterations where the Mahalanobis distance reached an oscillating steady state. A flowchart describing the method is shown (Fig. 1).
Fig. 1.
The process for generating the best fit CLB parameters using the genetic algorithm with the Mahalanobis distance as the objective function.
2.2. Fabrication of Nodule Phantoms
Twenty-four realistic nodule shapes (Fig. 2) were designed using an in-house program, which creates statistically variable nodule polygon mesh forms based on the segmented shapes of real nodules.19 Of the 24 nodules, half were created with internal heterogeneity (heterogeneous) and half were created with a single material (homogeneous). The nodules with internal heterogeneity were implanted with internal textures based on the best fit 3-D-CLB parameters from the genetic algorithm results for the category three texture. The synthetic nodule models thus created were varied in shape (spherical, lobulated, and spiculated), texture (homogeneous and heterogeneous), and size (in plane diameter less than 1.5 cm, and between 1.5 and 3 cm).
Fig. 2.
The textured nodule generation process. The nodule shape is first iteratively formed from a spherical form to match the statistical properties of segmented lesions. The shape is implanted with realistic texture and then 3-D printed into a nodule phantom.
The synthetic computational nodule models with internal heterogeneity were then fabricated into physical phantoms using a multimaterial 3-D printer (Stratesys Connex 350). The nodule model was voxelized to with double precision intensity values. This resolution is much finer than the typical resolution of a clinical CT system ensuring adequate precision of the resulting macroscopic details in CT images of the phantoms. Values of 0 (100% material A, photopolymer TangoPlus with 75 HU at 120 kV) to 1 (100% material B, photopolymer VeroWhite with 115 HU at 120 kV) were assigned to each voxel to represent the proportions of the two base materials used. The two base materials were dithered to spatially distribute them to achieve continuous density variations using the Floyd–-Steinberg dithering method previously used by Solomon et al.11 The full scheme of the phantom fabrication is shown in Fig. 2.
2.3. Pilot Trial
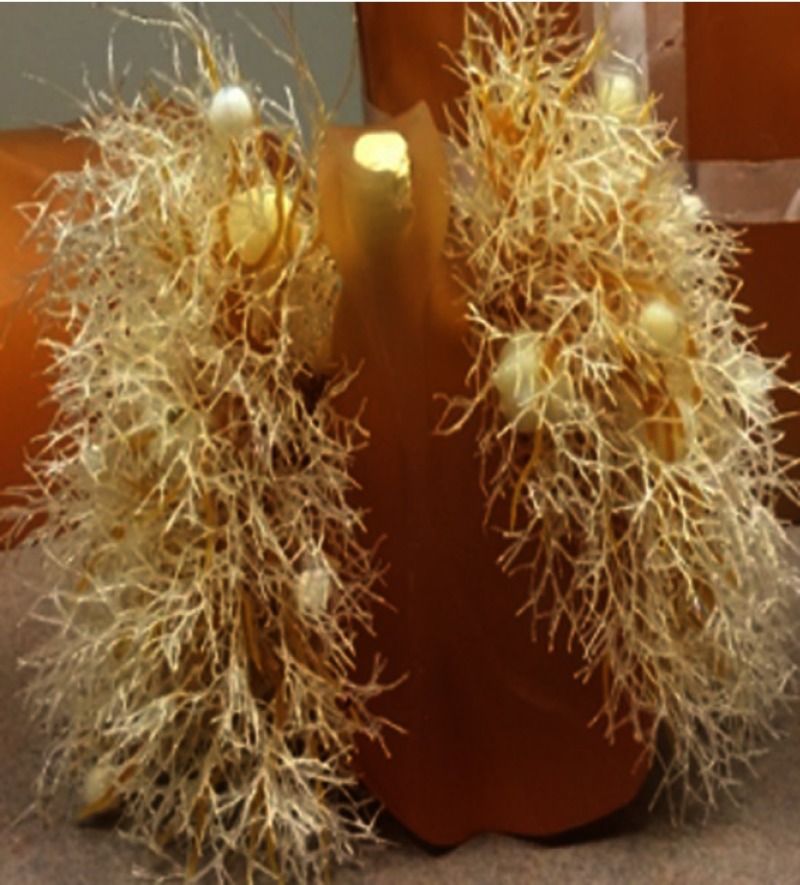
To demonstrate the use of the nodule phantoms, they were scanned using a clinical scanner and the images were used to quantify texture feature variability and accuracy as compared with the ground truth of the printed nodules. The phantoms were embedded into an anthropomorphic chest phantom (Multipurpose Chest Phantom N1, Kyoto Kagaku) (Fig. 3). The phantom was scanned on a clinical CT system (GE Revolution) at three CTDI levels (0.67, 1.42, and 5.80 mGy) using three reconstruction algorithms (FBP, ASIR 60%, and ASIR 40%), four reconstruction kernel types (standard, soft, and edge), and two slice thicknesses (0.6 and 5 mm). A repeat scan was performed for each imaging condition.
Fig. 3.
The anthropomorphic chest phantom with imbedded heterogeneous nodule phantoms.
The images of the synthesized nodules imbedded in anthropomorphic phantom were used to extract texture features. The texture features measured from the images were compared to the corresponding ground truth features measured on the computational models of the synthesized lesions. The imaged nodules were segmented using a semiautomated nodule segmentation program (Seg3D, University of Utah). The segmentation masks were registered with the image to characterize a subset of the previous 21 features including seven most clinically relevant texture features (contrast, correlation, homogeneity, dissimilarity, energy, texture entropy, and variance). The measurements were compared to the ground truth feature values by calculating an accuracy given as
| (1) |
where the mean is averaged across all lesions under the same imaging condition. The variability across imaging conditions was calculated by standard deviation of feature values of heterogeneous nodules across a certain imaging condition. For each feature, the variability was quantified by determining the feature repeatability for each imaging condition which was given as
| (2) |
where represents the features measured from different images of all lesions imaged with the same imaging condition. Variability and accuracy for each feature were compared as a function of radiation dose, slice thickness, and reconstruction kernel.
2.4. Comparison with Patient Population Used for Development
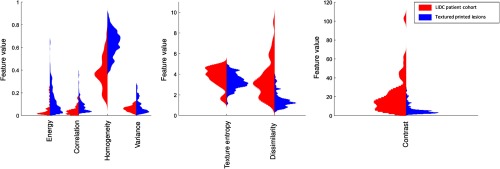
A validation study was performed to determine the similarity between the radiomics features extracted from CT images of the 3-D-printed textured lesions and the radiomics features of the original LIDC patient cohort which was used to inform the texture generation algorithm. The radiomics features of 3-D-printed lesions were extracted from the GE revolution scan data and the patient LIDC data were the feature data used in the texture generation algorithm. The radiomics feature vectors for the 3-D-printed lesions were compared to the corresponding radiomics feature vectors for the patient population lesions both graphically and statistically. The graphical analysis was a visual comparison and a comparison of histograms in radiomics between the patient population and the printed lesions. This analysis allowed for visual inspection of the distributions of radiomics features in the two populations. The statistical analysis was performed using a Wilcoxon rank sum test (nonparametric version of a -test). The null hypothesis was that the radiomics of printed lesions and the radiomics of patient lesions are continuous distributions with equal medians and the alternative hypothesis that they are not. The significance level was 5% ().
3. Results
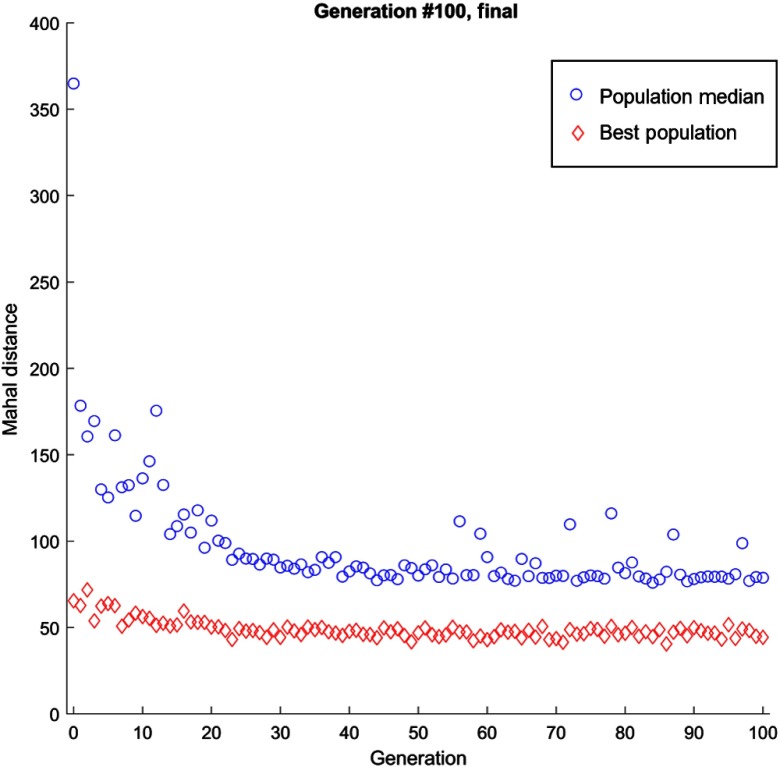
The genetic algorithm showed a decreasing trend of objective function value with increasing number of iterations (Fig. 4). After iterations, the Mahalanobis distance was decreased by 30% and 13% compared to the fitness function value of the first iteration for heterogeneity levels 2 and 3, respectively. The best fit parameters at the 99th iteration are listed in Table 5. The number of 100 iterations was chosen as a predetermined cut-off point higher than the 20th generation above which the values are generally steady (albeit some oscillation). Overall, the population median exhibited a steady decrease in Mahalanobis distance, with a rapid decline in the first 20 iterations with maintained performance with some oscillating behavior at higher iterations. The oscillating behavior could be explained by the random nature of realizations of 3-D-CLB at each iteration that were computed to evaluate the fitness function.
Fig. 4.
Genetic algorithm fitting result. The population median shows the average Mahalanobis distance for each iteration (generation), demonstrated by the data points on top. The best populations show the lowest Mahalanobis distance for each iteration demonstrated by the data points below. A log fit was done to each dataset separately, showing a decline in Mahalanobis distance for both the population median and best population.
Table 5.
Best fit 3-D-CLB parameters at 99th iterations of the genetic algorithm.
| Nodule heterogeneity | ||||||||||
|---|---|---|---|---|---|---|---|---|---|---|
| Category 2 | 14 | 4 | 3 | 5 | 1.2 | 1.1 | 5 | 4 | 1 | |
| Category 3 | 18 | 3 | 4 | 4 | 1 | 1 | 4 | 1 | 3 |
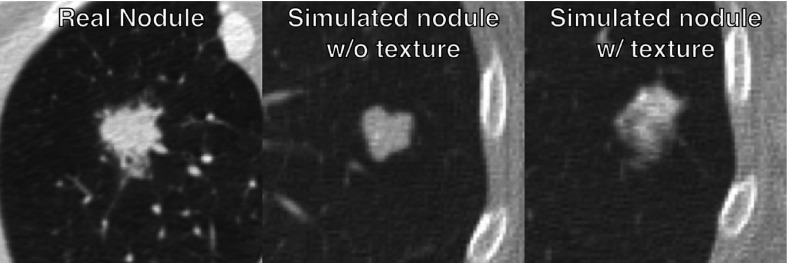
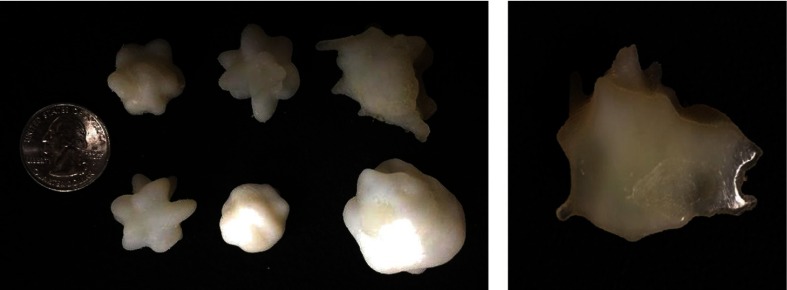
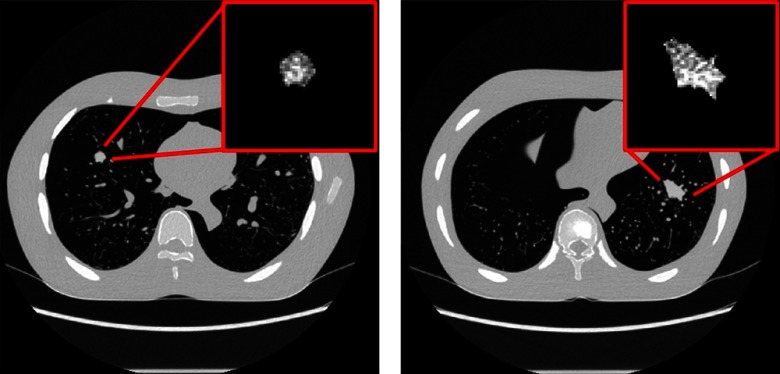
Figure 5 provides a subjective visual representation of simulated nodules without texture and with texture. The synthesized lesions with texture features that minimized the Mahalanobis distance were 3-D-printed with morphological realism using the two-material dithering technique noted earlier. Examples are shown in Fig. 6. The heterogeneous and morphologically realistic nodules were placed in a phantom and imaged with a clinical CT scanner (Fig. 7).
Fig. 5.
A visual example illustrating the differential in nodules simulated without and with texture.
Fig. 6.
3-D-printed nodule phantoms of various sizes and a cross sectional photograph of a heterogeneous 3-D-printed nodule which demonstrates the use of two materials combining to form a single 3-D-printed nodule.
Fig. 7.
Examples cross-sectional CT images (scanned with GE Revolution, FBP Standard Reconstruction) of heterogeneous and morphologically realistic 3-D-printed nodules imbedded within the anthropomorphic chest phantom. The full-size CT scans are presented with a WW set at 1500 and WL at . The zoomed-in textured lesions are presented with a WW set at 100 and WL at 60.
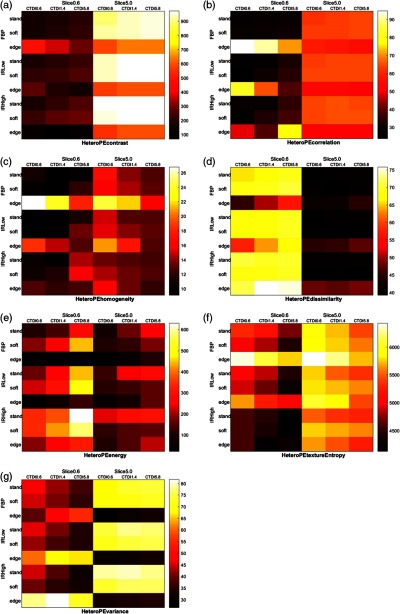
The images of the synthesized nodules imbedded in anthropomorphic phantom were used to extract texture features. The texture features measured from the images were compared to the corresponding ground truth features measured on the computational models of the synthesized lesions. The feature value accuracy across the imaging conditions are shown in Fig. 8. The results note a significant impact of imaging condition on the texture features, particularly for contrast, energy, and texture entropy, which show inaccuracies over 100%. Across most features, a thicker slice thickness seems to offer higher accuracy, but for dissimilarity and energy the trend seems to be reversed. Dose seems to have a modest advantage for most features, but the results suggest a reverse effect for homogeneity, energy, and variance. Across nearly all features, the sharp kernel (edge) exhibits results distinct from those of standard and soft kernels. Standard and soft kernels tend to yield lower error than edge kernels for both FBP and IR reconstruction algorithms, which by themselves do not show a notable trend.
Fig. 8.
The percent accuracy of (a) contrast, (b) correlation, (c) homogeneity, (d) dissimilarity, (e) energy (f) texture entropy, and (g) variance quantification through nodule phantoms. Lower values imply better accuracy. The color map intensity corresponds with the percent absolute relative error where lower error indicates higher accuracy. The darker the grid block color, the higher the accuracy.
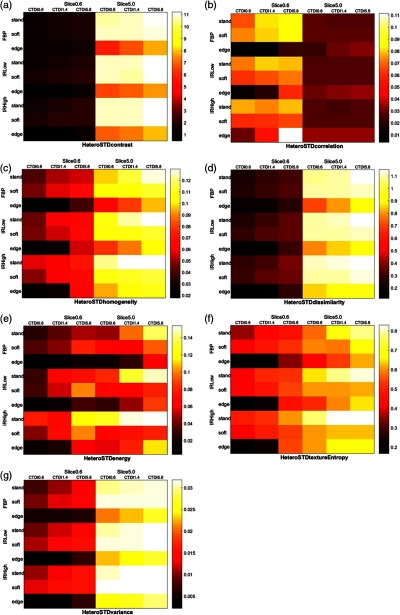
Variability across the seven tested texture features are illustrated in Fig. 9. Again, the imaging condition significantly influences the variability of measured feature, particularly for contrast, dissimilarity, and texture entropy. Slice thickness exhibits a strong influence with results less variable for all features except correlation which shows a reverse trend. Across nearly all conditions and features, the sharp (edge) kernel yielded less variability. Beyond these general trends, the accuracy and variability results showed no notable influence of imaging parameters on the measured textures.
Fig. 9.
Variability of (a) contrast, (b) correlation, (c) homogeneity, (d) dissimilarity, (e) energy, (f) texture entropy, and (g) variance quantification through nodule phantoms. Lower values imply lower variability.
The comparison validation study between the radiomics features extracted from the LIDC patient cohort and the radiomics extracted from images of the 3-D-printed lesions showed that the radiomics of printed lesions had reasonable overlap in magnitude with radiomics of patient lesions for most radiomics features studied (Fig. 10). The histograms for texture entropy, dissimilarity, and contrast features showed that the synthetic lesion radiomics values were contained within the range of patient radiomics values. The histograms showed that the energy, correlation, and variance synthetic radiomics values were mostly contained within the patient values, except for a few outliers. Homogeneity feature was the only feature with very little overlap between the main envelope of the distribution of texture features. The statistical analysis showed that the distributions for six of the features (energy, correlation, homogeneity, texture entropy, dissimilarity, and contrast) were significantly different between the printed and patient lesions at the 5% confidence level. The only feature that was not statistically different between the printed lesions and patient lesions was variance (Table 6).
Fig. 10.
The comparison between the histograms of radiomics of the LIDC patient population (red) and the textured 3-D-printed lesions (blue) showed that all seven radiomics features showed overlap in the two populations.
Table 6.
Results of statistical testing between the patient population and the printed lesions.
| Energy | Contrast | Correlation | Homogeneity | Variance | Texture entropy | Dissimilarity | |
|---|---|---|---|---|---|---|---|
| Printed lesions (median) | 0.098 | 4.725 | 0.072 | 0.644 | 0.064 | 3.255 | 1.284 |
| Patient lesions (median) | 0.026 | 15.775 | 0.028 | 0.368 | 0.061 | 3.967 | 3.140 |
| -value | 0.194 |
4. Discussion
We have demonstrated a technique to create patient-informed nodule texture and morphology which can be 3-D printed into physical nodule models with known ground truth texture features. This study met a need to objectively ascertain the accuracy of measured texture featured of tumors using a synthetic textured phantom with known ground truth. To our knowledge, this study is the first time morphologically realistic textured nodule models have been printed. The 3-D-printed nodule models developed can be used to understand the inherent variability and accuracy in texture features using features extracted from CT scans of synthetic lesion models. The results can be used as part of a body of literature that informs best acquisition protocol practices for the purposes of image quantification.
The results of the variability and accuracy in this study showed that reconstruction algorithm and slice thickness both have an effect on feature accuracy and variability, as also been noted in previous work.8,10 While a prior study has shown this in homogeneous nodule models,9 this study confirms that the result holds true for heterogeneous nodules as well. As the primary focus of the study was in the fabrication of the printed lesions, the assessment of variability and accuracy was performed for a single scanner model with select imaging protocols. Future work should characterize variability and accuracy of radiomics features on multiple scanners and diverse protocols by using the textured lesion phantoms.
The radiomics feature calculations used to create the 3-D-printed lesions relied on resampling the voxels to create isotropic voxels to allow for 3-D feature calculation. Currently, there is no clear consensus in the field regarding the best way to resample the data, use isotropic voxels, or measure GLCM in 3-D or in 2-D. We used 3-D GLCM to allow more complete capture of the texture information, requiring resampling to isotropic voxels. Future work may include other techniques for texture quantification.
The textured lesions created in this study utilized 3-D-CLB parameters that were determined from a genetic algorithm. The genetic algorithm required input values for initial starting parameters and upper and lower bounds (Table 3) to converge to a minimum Mahalanobis distance; when no bounds were applied, the random update of parameters created 3-D-CLB volumes with high variations between generations, affecting the efficiency of finding the best fit set of parameters. The initial 3-D-CLB parameters and bounds for those parameters were chosen based on pilot trials and may be used as starting point for similar investigations. The use of genetic algorithm helped prevent the problem of getting stranded on a local minimum compared to when using traditional nonlinear optimization method. The random but controlled manner of updating chromosomes (CLB governing parameters) ensured the survival of the best fit individual while successively updating the others.
The final validation comparison study showed that the distribution of radiomics features extracted from images of the textured printed lesions had reasonable overlap with the distribution of radiomics features from the original LIDC patient cohort, with the main envelope of the synthetic radiomics distribution being contained within main envelope of the patient radiomics distribution for six out of the seven features of interest. However, there were statistical differences between synthetic and patient distributions. We believe that the differences were due to (1) the inherent contrast limitations of the 3-D-printing process; and (2) the use of different scanners between images of synthetic and real lesions. Regarding the first limitation, there was a maximum 40 HU difference within the 3-D-printed lesions, a range narrower than those in real lesions by as much as 200. Future work should seek to remedy the contrast limitations of the textured 3-D-printing techniques. Regarding the second limitation, the LIDC patients selected for this study were imaged using older GE scanner models which do not exist at our institution. It an attempt to make the comparison similar, we used a newer generation GE scanner (revolution) to restrict our comparison. However, future work should compare radiomics values from patients and lesions using the same scanner models.
There are several limitations for this work. First, the initial data patient data used were not acquired with consistent reconstruction method, tube voltage, and slice thickness. However, the choice to use the data was based on the desire to ensure a diverse population of nodules to inform the texture model. Second, although Mahalanobis distance has been used previously in similar studies, it is possible that there might be a better optimization function for matching the texture model to patient data. To emulate the group of lesions, the simulations should ideally reflect the exact statistical priorities as specified by the cohort or the user. This study focused primarily on forming 3-D objects reflective of the real lesions via Mahalanobis distance as an indicator. Future studies should provide targeted qualification of the generated lesions. Third, the nodules were printed with a maximum contrast of 40 HU inside the nodule, a smaller contrast than is typical for clinical lesions (in the range of to 200 HU based on our own brief investigation). This is an inherent limitation in the 3-D-printing material properties that were available. We hope to remedy this limitation in future work. Fourth, the phantom created in this study is stationary and would therefore be unable to assess the effect of patient motion on variability and accuracy of radiomics features. Lastly, this study did not consider the effect of different segmentation algorithms and ROI sizes on the measurement of texture features. While the influence of segmentation was not the goal of this study, this effect can and should be studied in future investigation.
5. Conclusions
CT images of malignant lung nodules were used to create synthetic textures containing the internal heterogeneity of the nodules. The textures were incorporated into anthropomorphic models of tumor morphologies and fabricated into nodule phantoms using a state-of-the-art 3-D printing method which reproduced variations of x-ray properties inside the nodules via dithering. As demonstrated in a pilot trial, the printed textured phantoms can be used to ascertain the impact of CT imaging conditions on the accuracy of measuring the true radiomic features of a simulated lesion.
Biographies
Ehsan Samei is a tenured professor at Duke University, where he serves as the director of the Duke Medical Physics Graduate Program and his Clinical Imaging Physics Program. His interests include clinically-relevant metrology of imaging quality and safety for optimum interpretive and quantitative performance. He strives to bridge the gap between scientific scholarship and clinical practice by (1) meaningful realization of translational research and by (2) advancing towards clinical processes that are informed by scientific evidence.
Jocelyn Hoye is a PhD candidate at Duke University, where she works in the Carl E. Ravin Advanced Imaging Laboratories. Her interests include radiation dosimetry and quantification of the accuracy, variability, and biological relevance of radiomics features measured from CT images.
Yuese Zheng: Biography is not available.
Justin B. Solomon received his doctoral degree in medical physics from Duke University, in 2016. Currently, he is a medical physicist in the Clinical Imaging Physics Group at Duke University Medical Center’s Radiology Department. His expertise is in x-ray computed tomography imaging and image quality assessment.
Daniele Marin is an associate professor of Radiology at Duke University. He serves as the medical director of the Multi-D Lab at Duke University. His clinical and research interests focus on medical imaging with specific emphasis on quantitative imaging, clinical applications of dual energy CT, and new strategies for CT radiation dose reduction.
Disclosures
This work was sponsored by Radiological Society of North America (RSNA) R&E Foundation Research Scholar Grant in August 2015 (Grant No. RSCH1533). The authors do not have any conflicts of interest with the present study.
References
- 1.Kumar V., et al. , “Radiomics: the process and the challenges,” Magn. Reson. Imaging 30, 1234–1248 (2012). 10.1016/j.mri.2012.06.010 [DOI] [PMC free article] [PubMed] [Google Scholar]
- 2.Cunliffe A., et al. , “Lung texture in serial thoracic computed tomography scans: correlation of radiomics-based features with radiation therapy dose and radiation pneumonitis development,” Int. J. Radiat. Oncol. Biol. Phys. 91, 1048–1056 (2015). 10.1016/j.ijrobp.2014.11.030 [DOI] [PMC free article] [PubMed] [Google Scholar]
- 3.Aerts H. J., et al. , “Decoding tumour phenotype by noninvasive imaging using a quantitative radiomics approach,” Nat. Commun. 5, 4644 (2014). 10.1038/ncomms5644 [DOI] [PMC free article] [PubMed] [Google Scholar]
- 4.Coroller T. P., et al. , “CT-based radiomic signature predicts distant metastasis in lung adenocarcinoma,” Radiother. Oncol. 114, 345–350 (2015). 10.1016/j.radonc.2015.02.015 [DOI] [PMC free article] [PubMed] [Google Scholar]
- 5.Davnall F., et al. , “Assessment of tumor heterogeneity: an emerging imaging tool for clinical practice?” Insights Imaging 3, 573–589 (2012). 10.1007/s13244-012-0196-6 [DOI] [PMC free article] [PubMed] [Google Scholar]
- 6.Win T., et al. , “Tumor heterogeneity and permeability as measured on the CT component of PET/CT predict survival in patients with non-small cell lung cancer,” Clin. Cancer Res. 19, 3591–3599 (2013). 10.1158/1078-0432.CCR-12-1307 [DOI] [PubMed] [Google Scholar]
- 7.Ganeshan B., et al. , “Texture analysis of non-small cell lung cancer on unenhanced computed tomography: initial evidence for a relationship with tumour glucose metabolism and stage,” Cancer Imaging 10, 137–143 (2010). 10.1102/1470-7330.2010.0021 [DOI] [PMC free article] [PubMed] [Google Scholar]
- 8.Solomon J., et al. , “Quantitative features of liver lesions, lung nodules, and renal stones at multi-detector row CT examinations: dependency on radiation dose and reconstruction algorithm,” Radiology 279, 185–194 (2016). 10.1148/radiol.2015150892 [DOI] [PubMed] [Google Scholar]
- 9.Zhao B., et al. , “Exploring variability in CT characterization of tumors: a preliminary phantom study,” Transl. Oncol. 7, 88–93 (2014). 10.1593/tlo.13865 [DOI] [PMC free article] [PubMed] [Google Scholar]
- 10.Zhao B., et al. , “Reproducibility of radiomics for deciphering tumor phenotype with imaging,” Sci. Rep. 6, 23428 (2016). 10.1038/srep23428 [DOI] [PMC free article] [PubMed] [Google Scholar]
- 11.Solomon J., et al. , “Comparison of low-contrast detectability between two CT reconstruction algorithms using voxel-based 3D printed textured phantoms,” Med. Phys. 43, 6497–6506 (2016). 10.1118/1.4967478 [DOI] [PubMed] [Google Scholar]
- 12.Castella C., et al. , “Mammographic texture synthesis: second-generation clustered lumpy backgrounds using a genetic algorithm,” Opt. Express 16, 7595–7607 (2008). 10.1364/OE.16.007595 [DOI] [PubMed] [Google Scholar]
- 13.Shafiq-ul-Hassan M., et al. , “Intrinsic dependencies of CT radiomic features on voxel size and number of gray levels,” Med. Phys. 44, 1050–1062 (2017). 10.1002/mp.12123 [DOI] [PMC free article] [PubMed] [Google Scholar]
- 14.Baraldi A., Parmiggiani F., “An investigation of the textural characteristics associated with gray level cooccurrence matrix statistical parameters,” IEEE Trans. Geosci. Remote Sens. 33, 293–304 (1995). 10.1109/36.377929 [DOI] [Google Scholar]
- 15.Wei Q., Hu Y., “A study on using texture analysis methods for identifying lobar fissure regions in isotropic CT images,” in Annu. Int. Conf. IEEE Eng. Med. and Biol. Soc., EMBC 2009, pp. 3537–3540 (2009). [DOI] [PubMed] [Google Scholar]
- 16.Vallières M., et al. , “A radiomics model from joint FDG-PET and MRI texture features for the prediction of lung metastases in soft-tissue sarcomas of the extremities,” Phys. Med. Biol. 60, 5471–5496 (2015). 10.1088/0031-9155/60/14/5471 [DOI] [PubMed] [Google Scholar]
- 17.Solomon J., Samei E., “Quantum noise properties of CT images with anatomical textured backgrounds across reconstruction algorithms: FBP and SAFIRE,” Med. Phys. 41, 091908 (2014). 10.1118/1.4893497 [DOI] [PubMed] [Google Scholar]
- 18.Bochud F. O., Abbey C. K., Eckstein M. P., “Statistical texture synthesis of mammographic images with clustered lumpy backgrounds,” Opt. Express 4, 33–43 (1999). 10.1364/OE.4.000033 [DOI] [PubMed] [Google Scholar]
- 19.Solomon J., Samei E., “A generic framework to simulate realistic lung, liver and renal pathologies in CT imaging,” Phys. Med. Biol. 59, 6637–6657 (2014). 10.1088/0031-9155/59/21/6637 [DOI] [PubMed] [Google Scholar]


