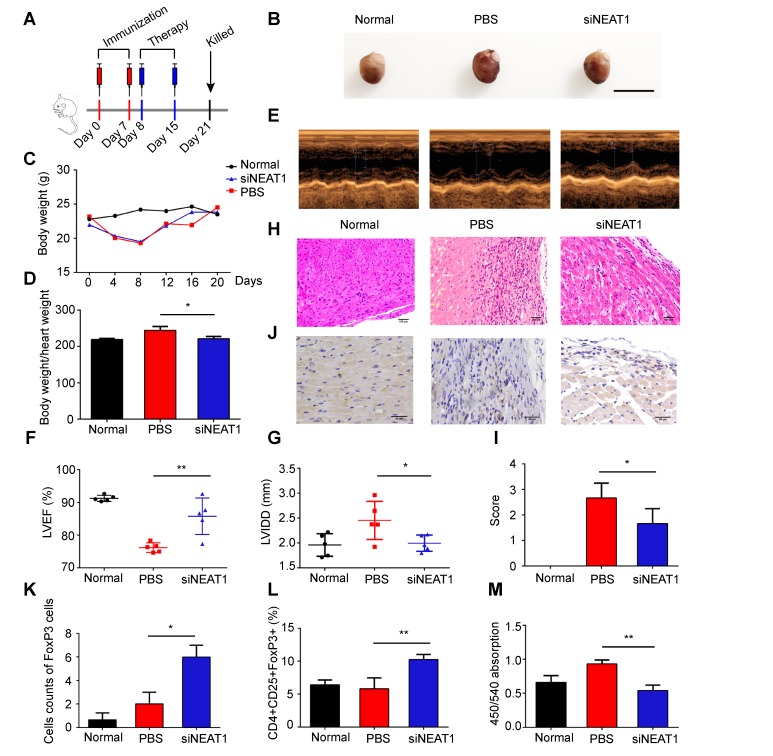
Figure 5.
Knockdown of NEAT1 in DCs induces immune tolerance in experimental autoimmune myocarditis. (A) Injection schedule. BALB/C mice were injected with α-MyHC/CFA to induce experimental autoimmune myocarditis (EAM) on days 0 and 7. Then, siNEAT1 DCs or PBS were injected into mice on days 8 and 15. Mice were sacrificed on Day 21. (B) Panel shows images of hearts from three different mouse groups. Scale bars correspond to 1 cm. (C) Body weight (g) of siNEAT1 mice, EAM mice, and normal mice. (D) Body weight/heart weight ratio of siNEAT1 mice, EAM mice, and normal mice. Data are expressed as mean ± SD; n = 5 biological replicates; *p<0.05, derived using Student's t-test. (E-G) Representative images of left ventricular (LV) M-mode echocardiograms 21 days after injection (E). Left ventricular ejection fraction (LVEF) (F) and LV internal diastolic diameter (LVIDD) (G) are shown. Data are expressed as mean ± SD; n = 5 biological replicates; *p<0.05, **p<0.01, derived using Student's t-test. (H-I) Histologic studies of harvested hearts stained with hematoxylin and eosin (H). Assessment of hematoxylin and eosin staining by grading (I). Scale bars correspond to 100 µm.Data are expressed as mean ± SD; n = 5 biological replicates; *p<0.05, derived using Student's t-test. (J-K) Immunohistochemical labeling for FoxP3 (J) and counts of infiltrating FoxP3 cells (K) in hearts harvested from different groups. Scale bars correspond to 50 µm. Data are expressed as mean ± SD; n = 5 biological replicates; *p<0.05, derived using Student's t-test. (L) Expression of CD4+CD25+FoxP3+Treg in splenic T cells was assessed by flow cytometry in three different groups. Data are expressed as mean ± SD; n = 5 biological replicates; **p<0.01, derived using Student's t-test. (M) Results of T-cell proliferation assays of different groups assessed using a mixed lymphocyte reaction (MLR) by BrdU ELISA. The stimulator cells were C57BL/6 splenocytes treated with mitomycin C. Data are expressed as mean ± SD; n = 5 biological replicates; **p<0.01, derived using Student's t-test.

