Abstract
There remains a great need for diagnosis of inflammatory bowel disease, for which the current technique, colonoscopy, is costly and also has risks for complications. Attenuated total reflectance Fourier transform infrared spectroscopy is a new screening technique to evaluate colitis. Using second derivative spectral deconvolution of the absorbance spectra, a full set of spectral markers were identified based on statistical analysis. Using this method, Amide I group frequencies, (specifically, α-helix to β-sheet ratio of the protein secondary structure) were identified in addition to the previously reported glucose and mannose signatures in sera of chronic and acute mice models of colitis. We also used the same technique to demonstrate that these spectral markers (α-helix/β-sheet ratio, glucose and mannose) are recovering to basal levels upon anti-TNFα therapy. Hence, this technique will be able to identify changes in the sera due to diseases.
Keywords: anti-TNFα, ATR-FTIR, colitis, secondary structure, sera
Graphical Abstract
1 |. INTRODUCTION
Inflammatory bowel diseases (IBDs) are chronic inflammatory disorders that affect the gastrointestinal tract and are characterized by episodes of relapse and remission. Although the pathogenesis of IBDs and its 2 clinical forms, Crohn’s disease (CD) and ulcerative colitis (UC), is not entirely understood, researchers have identified [1, 2] genetics, environment and most notably microbiota as influential factors. Having UC [3] or CD put patients at higher risk to developing colorectal cancer which is a leading cause of mortality in developed countries [4–6]. Screening and monitoring of colitis remain to be a challenge [7, 8]. It has been reported that infrared spectroscopy of body fluids have great clinical applications for detection and monitoring of various cancer [9] and health conditions [10]. In addition, using models of experimental colitis, potential precursor of colon cancer, that attenuated total reflectance-Fourier transform infrared (ATR-FTIR) spectroscopy has been proven [11] to be a potential screening tool. This rapid [12] diagnostic technique [13] provides information on the molecular composition of a sample of dried serum while requiring minimal sample preparation [14, 15]. This technique specifically identified higher levels of mannose in colitic sera [11]. The importance of protein secondary structures and its strong correlation to its functions has been extensively reported in previous studies [16, 17]. We propose to use these protein secondary structures, that is, α-helix and β-sheet, as new and original markers for colitis. Herein, we thus report that ATR-FTIR spectroscopic technique can detect changes in the protein secondary structures which can be correlated to various disease statuses [18, 19].
2 |. MATERIAL AND METHODS
2.1 |. Mice
Three-week-old female C57BL/6 wild type (WT) and interleukin 10 knockout (IL10−/−) mice were obtained from Jackson Laboratories (Bar Harbor, ME). Toll-like receptor knockout (TLR5−/−) mice were grown in our facility. Mice were group housed under a controlled temperature (25°C) and photoperiod (12:12-hour light-dark cycle) and fed ad libitum. Animal experiments were approved by the Institutional Animal Care and Use Committee of Georgia State University (Atlanta, Georgia), and performed in accordance with the guide for the Care and Use of Laboratory Animals by US Public Health Service. All procedures were approved under the IACUC protocol #A14010.
2.2 |. Development of colitis in IL10−/−
IL10−/− mice develop colitis on a time-dependent manner. In order to assess the intestinal inflammation in those mice at different times of colitis development, feces were collected at weeks 4 and 14 to measure Lcn-2. Blood was collected at weeks 4 and 14 to obtain sera by centrifugation using serum separator tubes (BD Biosciences, Franklin Lakes, New Jersey).
2.3 |. Anti-TNFα antibody treatment of IL10−/− mice
IL10−/− mice were treated twice a week from 4 weeks of age (28 days) to 14 weeks (98 days) by intraperitoneal (IP) injection of equal volumes of either anti-murine tumor necrosis factora (TNFα) antibody (10 mg/kg, 200–250 μg, CNTO5048, kindly provided by Janssen Biotech, Horsham, Pennsylvania) or phosphate buffered saline (PBS). The blood was collected at 4 and 14 weeks to obtain the serum and measure the spectroscopic spectra. Mice were euthanized at 14 weeks and colon was collected for quantitative polymerase chain reaction (qPCR).
2.4 |. Dextran sodium sulfate-induced colitis
C57BL/6 WT mice were administered dextran sodium sulfate (DSS; [MP Biomedicals, Solon, Ohio]) at 3% in drinking water ad libitum for 7 days. Feces and blood were collected at day 0 (before DSS treatment) and day 7. - Hemolysis-free serum was collected by centrifugation using serum separator tubes.
2.5 |. Collagen antibody-induced arthritis model
BALB/C WT mice received collagen antibodies injections (200 μL) on day 0 by an intravenous (tail vein) injection. (On day 6, mice received lipopolysaccharide (200 μL) by IP injection in order to boost the effect). Blood samples were collected from each mouse on pretreatment (day 2) and on posttreatment (day 12) from the jugular vein. Hemolysis-free serum was collected by centrifugation of the collected blood using serum separator tubes.
2.6 |. TLR5−/− model of metabolic syndrome
TLR5−/− spontaneously develop metabolic syndrome as previously described [20]. Age-matched WT and TLR5−/− mice were fasted for 5 hours and baseline blood glucose levels measured with a blood glucose meter (Roche) using blood collected from the tail vein.
2.7 |. Spectroscopy and data processing
A Bruker Vertex 70 FTIR spectrometer with a Harrick-Scientific MVP-Pro ATR accessory configured to have a single reflection of the infrared radiation was used to obtain all the spectroscopic results (see Appendix S1, Supporting Information, for detailed). The samples were scanned covering the wavelength range of 4000 to 400 cm−1 and the 1800 to 1000 cm−1 section was used for this study. The 5 reads of the 50 co-added spectral scans for each sample (total of 250 scans) were averaged. The 1800 to 1000 cm−1 range was selected for analysis. Using OPUS 7.2 software, all the spectra were internally normalized [21] at the absorbance peak positions of Amide I. Spectral deconvolution was also done to better resolve the peaks by obtaining the second derivative using Microsoft Excel software. Prior to curve fitting, the spectra were rubber band (2 point) baseline corrected [22] for the amide I region (1700–1600 cm−1). Four Gaussian oscillators whose positions were obtained from the second derivative were used to fit the experimental curve in the amide I region (1700–1600 cm−1) by iteratively varying each oscillator intensity and width while minimizing the root-mean-squared (RMS) error to <0.005 using the Levenberg-Marquardt algorithm.
3 |. RESULTS AND DISCUSSION
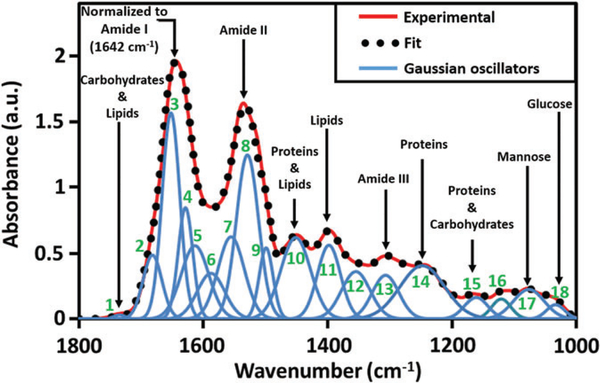
An ATR-FTIR absorbance spectrum, covering the 1800 to 1000 cm−1 (fingerprint) region can be mapped by using multiple Gaussian oscillators corresponding to the expected individual biological components (rather than unique vibrational bonds) that have majority contribution to the absorbance peaks. The valley positions of the second derivative of the absorbance curves suggest the frequency positions of the oscillators. As seen in Figure 1, a simulated curve can be obtained that best fits the experimental absorbance spectrum of a noncolitic dried serum. The goodness of fit is iteratively improved by varying the intensities (concentration) and widths (broadening effect) of the individual oscillators. Table 1 shows the list of oscillators, and their corresponding biological components, used to obtain the best fit.
FIGURE 1.
Spectrum for normal mouse serum with the major peaks assigned. All spectra are normalized to amide I peak at 1642 cm−1. All the Gaussian oscillators (see Table 1) required to obtain a good fit to the experimental curve are shown, among which, 3: α-helix, 4: β-sheet, 17: Mannose and 18: Glucose are already proven to facilitate screening of colitis
TABLE 1.
List of Gaussian oscillators used to fit the experimental absorbance curve with the individual assignments [10, 23] based on a majority absorbance contribution
| Oscillator number | Wave number (cm−1) | Assignment |
|---|---|---|
| 1 | 1735 | Lipids: Symmetric vibration C=O |
| 2 | 1680 | β (antiparallel + turn): Amide I of proteins |
| 3 | 1653 | α-helix structures: Amide I of proteins |
| 4 | 1632 | β-pleated sheet structures: Amide I of proteins |
| 5 | 1618 | Side chain: Amide I of proteins |
| 6 | 1588 | C—C stretching of phenyl rings: Amide II of proteins |
| 7 | 1555 | β-pleated sheet structures: Amide II of proteins |
| 8 | 1529 | C=N adenine, cytosine, guanine: Amide II of proteins |
| 9 | 1500 | C—H bending of phenyl rings |
| 10 | 1450 | Lipids: CH2 symmetric, proteins: CH3 asymmetric deformation |
| 11 | 1395 | Amino acid: Symmetric stretching of COO-, proteins: CH3 |
| 12 | 1350 | Adenine: Stretch carboxyl group COO |
| 13 | 1300 | Amide III: C—H/N—H deformation vibrational modes methyl group |
| 14 | 1245 | Lipid phosphates, DNA, RNA: Asymmetric (PO2−) stretching |
| 15 | 1155 | C—O stretching vibrations |
| 16 | 1116 | Symmetrical stretching P—O—C, C—O(H) stretching bands of RNA |
| 17 | 1076 | Mannose: C—O stretching (carbohydrate α-anomer) |
| 18 | 1033 | Glucose: C—O stretching (carbohydrate, β-anomer) |
The fit is optimized by minimizing the RMS error using the Levenberg-Marquardt algorithm. When fitting the entire fingerprint region, in some cases, multiple oscillator parameter combinations may be possible for similar RMS error values for the same spectrum. This is avoided by sectioning the spectrum to biological functional groups (such as Amide I discussed in this article) which ensures a unique and singular fitting solution. Such curve fitting protocols used with pure material absorbance curves such as mannose, glucose and carbohydrates will quantify the concentrations of each compound in order to calibrate the colitis sample spectra. Amounts as small as 75 pg of mannose have been detected using this spectroscopic technique. Similar fitting can be obtained for the diseased sample allowing us to determine the disease-induced differences in the dried serum spectra.
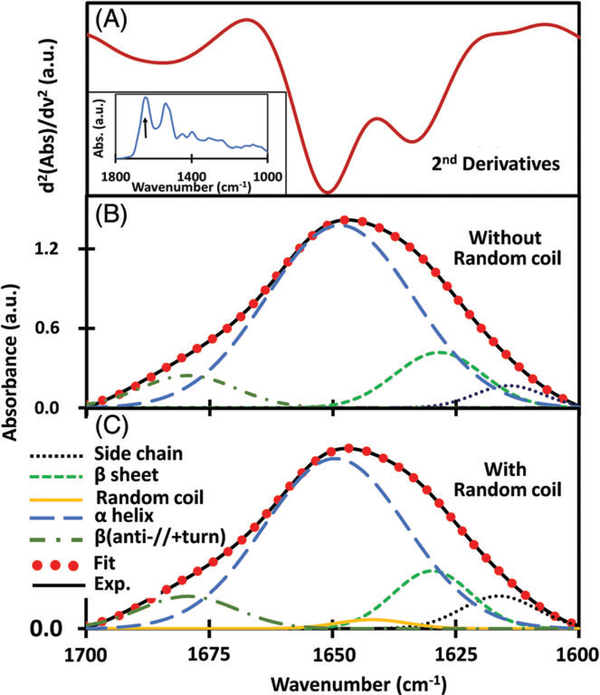
In order to identify induced changes in protein secondary structure specific to colitis, we used IL-10−/− mice, a genetically engineered model that spontaneously develop chronic inflammation of the small intestine and colon with massive infiltration of lymphocytes, activated macrophages and neutrophils and the chemically induced DSS mice model. α-Helices that aid in the binding of DNA and transmembrane spanning [24] and β-sheets are components of protein secondary structures with vital functions. It has been reported [25, 26] that FTIR spectroscopy is well suited for the analysis of secondary structure of polypeptides and proteins. This analysis of proteins by deconvolution of FTIR spectra is in good agreement with the data obtained from X-ray crystallography [27]. Studies further showed that the absorption at these bands (1650 and 1630 cm−1) is not entirely due to α-helix and β-sheet but are unequivocally the major contributors [27]. β-sheets are polypeptide strands woven together with the aid of hydrogen bonding giving the appearance of ribbons or sheets. Their functions include recognition of target binding sites, domain stability and protein folding. α-helix and β-sheet are the primary factors deciding the structure of proteins [28] which directly relates to their functions. In the ATR-FTIR spectra of the dried serum, the primary absorbance contribution to the amide I band comes from α-helix and β-sheets of proteins. The absorbance peaks representative of the individual components of amide I can be better resolved by obtaining the second derivative of the spectra which represents the rate of change of slope at each wave number position (Figure 2). Once the positions were determined, the absorbance curves were sectioned to 1700 to 1600 cm−1 (amide I) region followed by a 2-point rubberband baseline correction. Gaussian oscillators representative of the prominent individual secondary structure components were used to fit the experimental curve. The final fitting solution was unique and singular for each spectrum allowing one to compare the position, intensity and full-width at half-maximum (area under the curve) parameters with other curves processed using the same protocol. The intensities of the peaks (in cm−1) at approximately 1610 and 1682 assigned [29] as side-chain vibrations and antiparallel β-sheet/p-turn combination, respectively, do not show any statistically significant change due to the development of colitis in either DSS or IL10−/− colitic mice. Side chains are the variable components linked to the central carbon atoms backbone of an amino group [30]. Depending on their propensity to be in contact with polar solvent like water, these are hydrophobic, polar or charged. Due to these properties, side chains confer different chemical, physical and structural properties of the final protein. Similarly, the peaks (in cm−1) at approximately 1630 and 1652 have been assigned [23] as vibrational modes of β-sheet and α-helix, respectively. The α-helix component intensity appears to reduce while the β-sheet component intensity increases simultaneously for colitic compared to noncolitic samples in both DSS and IL10−/− mice.
FIGURE 2.
(A) Second derivative of ATR-FTIR absorbance of control sera showing the deconvolved amide I region. Inset shows the spectra in the 1800 to 1000 cm−1 region with the arrow indicating the amide I region. (B) The individual secondary structure components were modeled using Gaussian oscillators whose positions were determined from the second derivative of the absorbance to obtain simulated fits to the experimental curves. (C) Secondary structures with the inclusion of random coil components approximately at a position of 1641 cm−1
In this study of dried serum sample at room temperature, second derivative spectra (Figure 2A) clearly depicts the 4 valley positions showing the significant presence of side chain, α-helix, β-sheet and β (anti-//+turn) structures. The impact of another integral unit of a protein structure, random coil is negligible (<1.4%) compared to other 4 identified components. It has been reported that the concentration of random coil is significant in heat-induced denatured proteins [31]. However, the serum sample used in our study does not have denatured proteins. In order to assess its impact in our study, component structures were modeled using oscillators without (Figure 2B) and with (Figure 2C) the inclusion of random coil structure during spectral deconvolution. Table 2 shows the percentage integral strength and positions of each of the oscillators. These quantified values clearly illustrate that the inclusion/exclusion of random coil structures has negligible impact on the integral strength and hence on the sensitivity or specificity of the present screening technique. Furthermore, it is noted that as the serum sample dries, the protein secondary structure conformations can change marginally [32], this effect is minimum [33] and more importantly, similar for both control and diseased samples as the same protocol is followed.
TABLE 2.
Position of Gaussian oscillators and their integral strength as percentage
| Position of oscillators |
Integral strength of oscillator (in %) |
|||
|---|---|---|---|---|
| With random coil | Without random coil | With random coil | Without random coil | |
| Side chain | 1612–1614 | 1611–1614 | 2.5–4.6 | 2.4–4.5 |
| β-sheet | 1627–1630 | 1627–1630 | 15.4–22 | 15.4–25.4 |
| Random coil | 1640–1642 | NA | 1–1.4 | NA |
| α-helix | 1648–1651 | 1648–1652 | 65.9–71.9 | 66.5–73.9 |
| β (anti.//+turn) | 1679–1681 | 1679–1682 | 7–8.4 | 7.1–8.9 |
Contribution of oscillator representing random coil structure is very small (<1.4%, in all n = 90 mice) and becomes zero during deconvolution within fingerprint region as in Figure 1.
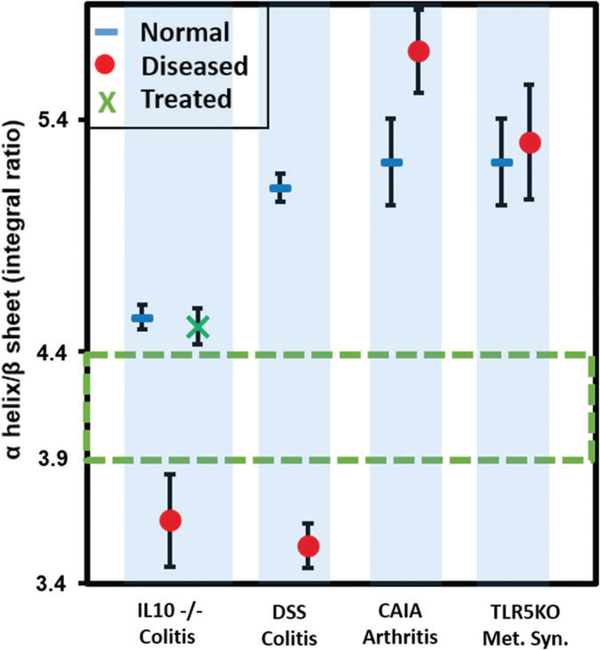
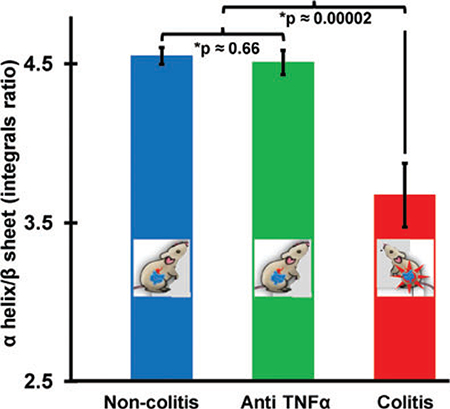
The concentrations of the secondary structures can be determined by obtaining the area enveloped by each component. In order to assess the specificity of such spectral signature for intestinal inflammation, extraintestinal inflammatory models, namely collagen antibody-induced arthritis and toll-like receptor 5 knockout metabolic syndrome were employed as controls. The plot of the mean area integral ratio of α-helix and β-sheet for colitic (DSS, IL10−/−), metabolic syndrome, arthritis samples is shown in Figure 3 along with the SE of means. It is noted that the ratio of α-helix/β-sheet integrals is always less than the controls for both colitis models with statistical significance >99%. However, metabolic syndrome and arthritis do not show a significant separation indicating that the ratio of these secondary structures provide a unique screening signature for colitis when considering the symptomatically closely associated diseases. In arthritis, it must be noted that the ratio was tending to be greater in diseased than in the control samples which is opposite to the trend observed in colitic samples.
FIGURE 3.
Plot showing the mean ratio of the area integrals of α-helix/ β-sheet indicating that the colitic (DSS and IL10−/−) integral ratio is always lower than 3.9 and for the noncolitic and the controls it is always higher than 4.4. The interval values are almost similar with the inclusion of random coil structures (ie, the separation 3.9–4.4 without random coil changes to 3.6–4.2 after its inclusion) during deconvolution process. This proves the robustness of the α-helix/β-sheet area integral ratio as a sensitive and selective screening signature for colitis. Each marker represents the mean (IL10−/−: 16 non-colitic, 9 colitic and 9 anti-TNFα treated, DSS: 12 controls, 12 colitics, arthritis: 4 normals and 4 diseased and metabolic syndrome: 4 normal and 4 diseased). The error bars indicate the SE of mean
Previous reports showed that the colitic phenotype of IL10−/− mice can be reversed using anti-TNFα antibodies [34], which is a commonly used therapy for human IBD. Indeed, anti-TNFα antibodies have been used effectively not only to mitigate symptoms of IBD but also to heal intestinal inflammations [35]. Consistent with the prior study, we treated 9 of the 16 IL10−/− mice with the anti-murine TNF monoclonal antibody, CNTO5048 (provided by Janssen Biotech), at a dosage of 10 mg/kg twice a week starting at D28 for 10 weeks.
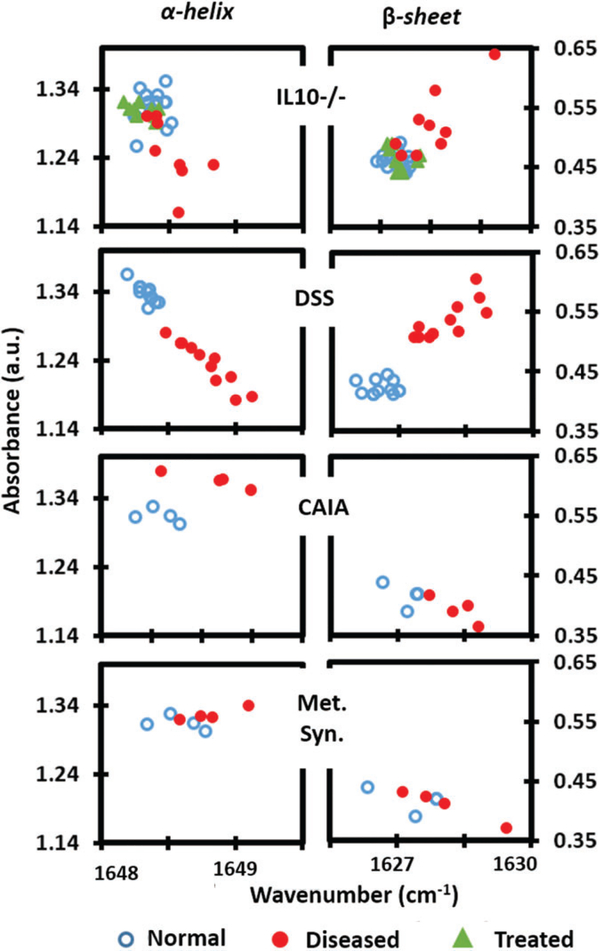
To confirm the effect of anti-TNFα therapy in our model, we assessed at the age of 14 weeks, various markers of inflammation by qPCR. Anti-TNFα therapy successfully reduced the levels of various proinflammatory cytokines in the colon of IL10−/− (see Appendix S1). The absorbance spectra of serum drawn at week 14 from anti-TNFα treated mice were compared with the noncolitic and colitic IL10 −/− sample spectra. Importantly, when treated by anti- TNFα, the secondary protein structure ratios in IL10−/− are similar as in the nontreated noncolitic IL10−/− mice (Figure 3), indicating that treating colitis reverse ratios of secondary protein structures in sera of IL10−/− albeit a genetic predisposition. The latter finding strengthens the potential of using protein secondary structure as marker for colitis. When the intensities of the individual oscillators are plotted (Figure 4), there is an apparent downshifting of the α-helix frequency in the colitic data. This could be the result of a change in the overall protein composition in sera of colitic mice with a majority of them having α-helices of increased lengths [36]. Similarly, the upshifting of β-sheet frequency could indicate an increased presence of sheets with smaller number of strands. IL10 −/− knockout mouse spontaneously develop colitis in the time-dependent manner. The severity of disease also varies between individual mice because of spontaneous nature of its development. Data points of IL10 −/− colitis model with a larger spread reflect this variability. In contrast, data points in DSS model were closely clustering together as the development of colitis is ensured chemically and is well controlled. Ratio between the 2 secondary structures which differentiate colitis form corresponding controls with higher significance (>99%) is thus a new signature for colitis screening.
FIGURE 4.
Plots of the intensities of the α-helix and β-sheet components for colitis (IL10−/−, DSS) and extraintestinal inflammatory models (arthritis and metabolic syndrome). Colitic and noncolitic clusters are separated with colitic being higher when considering the β-sheet intensity and colitic being lower when considering α-helix intensity. The noncolitic IL10−/− and anti-TNFα treated clusters conform to each other. Arthritis data show the opposite trend with metabolic syndrome not showing any difference. When random coil is included during the deconvolution, absorbance values are slightly shifted without altering the trend
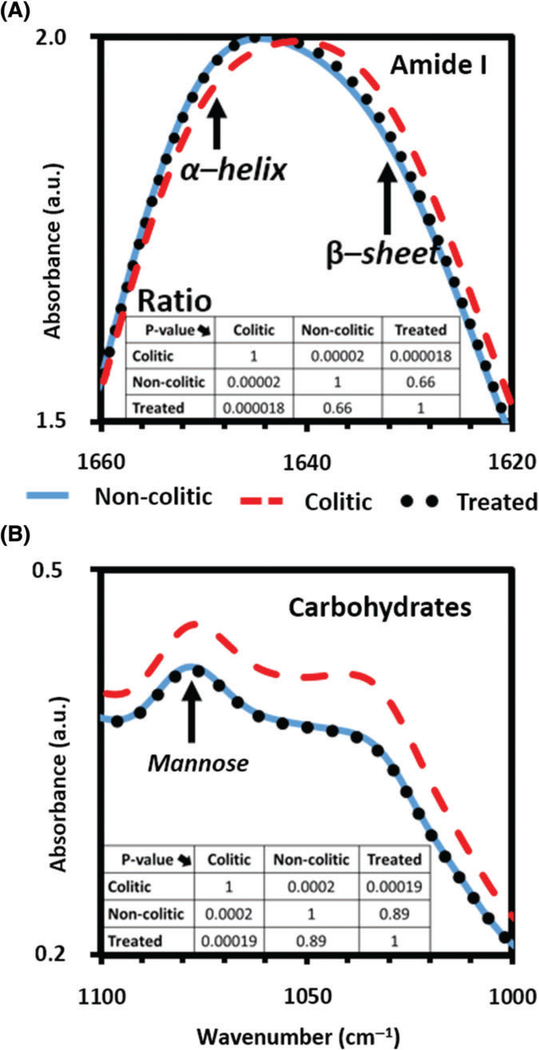
As seen in Figure 5, the anti-TNFα treated averaged spectra follows the noncolitic averaged spectra with high conformity (with P values much greater than .5) while markedly differing from the colitic spectra (with P values less than .0002) in the carbohydrates [11] and amide I regions. The reversibility of the observed spectra when colitis is minimized in susceptible mice, confirm the validity of the mannose and the α-helix/β-sheet integral ratio as screening signatures for colitis.
FIGURE 5.
Absorbance spectra of the colitic (---), non-colitic (—) and anti-TNFα treated (…) sera in the (A) amide I region, including α-helix/β-sheet and (B) carbohydrates region including mannose. In both colitis screening spectral signature regions, colitic data are significantly different (P < .0002) from noncolitic and anti-TNFα treated data. Simultaneously when comparing noncolitic and anti-TNFα treated, the P values are much >.6 indicating that the 2 groups are very similar
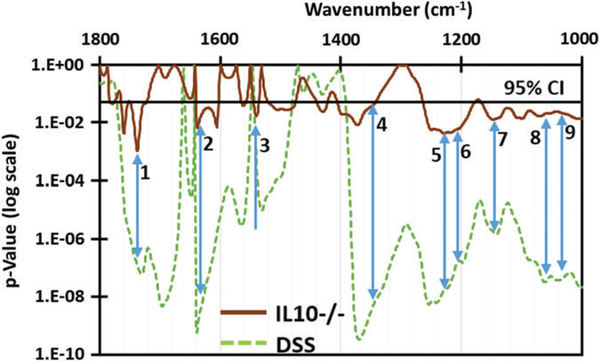
Student’s t test was performed on the absorbance spectra of colitic and control spectra for both models. Seven additional spectral absorbance peaks (Figure 6) were chosen as signatures (giving a total of 9 with the previously identified glucose and mannose signatures [11]) with a significance better than 0.05 (ie, 95% or higher). These were assigned as C=O stretching of lipids and polysaccharides (1740 cm−1), β-sheet of amide I (1635 cm−1), β-sheet of amide II (1540 cm−1), CH2 stretching of polysaccharides (1368 cm−1), amide III of collagen (1240 cm−1), collagen (1206 cm−1) and C—O stretching of collagen (1163 cm−1). Increased levels of collagen in serum have been reported [37, 38] due to collagen deposition in the mucosal and submucosal layers of the colitis stricken colon [39]. These additional signatures will be corroborated with proper controls and other assays in future research work.
FIGURE 6.
Student’s t test P values calculated for IL10−/− and DSS models in comparison with their noncolitic controls. The arrows indicate peaks where colitic samples of both IL10−/− and DSS are separated from their controls with high significance (P < .05, indicated by black line). The corresponding peaks (in cm−1) other than the previously identified mannose (8) and glucose (9) are (1) 1740, (2) 1635, (3) 1540, (4) 1368, (5) 1240, (6) 1206 and (7) 1160
4 |. CONCLUSION
The results of our present study show that the ATR-FTIR spectroscopy of serum sample offers a safer and cost-effective technique for initial screening of colitis. Protein secondary structure analysis (α-helix to β-sheet structure integral ratio) along with the previously reported glucose and mannose signatures [11] has been shown to selectively screen for colitis while employing appropriate controls. Seven new spectral signatures were chosen as differentiating markers for colitis based on the second derivative of the absorbance with >95% significance. Studies [40, 41] have already demonstrated that the direct causative effect of protein secondary structure mutations to diseases. Studies also reported [42] that certain proteins are either up or downregulated selectively as a result of colitis. This melded manifestation of the protein changes is most likely the primary reason for the colitis induced α-helix to β-sheet, integral ratio change observed in the DSS and IL10−/− models. Colitis inflammation was mitigated by anti-TNFα therapy, which has been spectroscopically verified, thereby corroborating the validity and specificity of this screening signature.
Furthermore, the pathological analyses of colon biopsies show an elevation of mannose on mucosal layer of patients with UC [43]. This biopsy analysis coupled with our findings using mouse serum show the promise of the possible transfer of this technique to human study. Colonoscopy which is the gold standard for colitis detection is not a simple cost-effective solution for routine screening. This ATR-FTIR spectroscopy of serum sample which offers a safer, minimally invasive and inexpensive alternative for initial screening of colitis can allow a physician to decide the need for colonoscopy. This technique may thus also appeal to a larger group of people who might be reluctant to undergo colonoscopy for routine screening. If this screening indicated the need, the colonoscopy can be performed afterward. Furthermore, this technique can be potentially used as a monitoring tool for remission or relapse since the spectral markers are sensitive to lowered inflammation even in susceptible hosts. Colitis screening study using ATR-FTIR spectroscopy of serum sample should be extended to UC or CD patients and dose-dependent regression after anti-TNFα treatment ought to be explored. Further work is thus in progress to investigate dose-dependent regression of inflammation and the associated spectral signatures in mice with colitis, and translation of markers identified in mouse model to UC or CD patients with respect to ATR-FTIR detection.
Supplementary Material
ACKNOWLEDGMENTS
Financial support from the following entities are much appreciated: US Army W911 NF-15-1-0018; Defense University Research Instrumentation Program 55655-EL-DURIP and Molecular Basis of Diseases (MBD) program at Georgia State University to A.G.U.P.; Department of Veterans Affairs (Merit Award: BX002526) and National Institutes of Health of Diabetes and Digestive and Kidney RO1DK071594 to D.M.; Dr. D.M. is a recipient of a Career Scientist Award from the Department of Veterans Affairs. Crohn’s & Colitis Foundation of America research fellowship award to EV. Dr. Chassaing’s provision of the serum samples from TLR5−/− mice and the corresponding WT controls is appreciated.
Funding information
Army Research Office, Grant/Award number: W911 NF-15-1-0018; Air Force Office of Scientific Research, Grant/Award number: 55655-EL-DURIP; U.S. Department of Veterans Affairs, Grant/Award number: BX002526; National Institute of Diabetes and Digestive and Kidney Diseases, Grant/Award number: RO1DK071594; Crohn’s and Colitis Foundation of America; Molecular Basis of Diseases (MBD) program at Georgia State University
Footnotes
AUTHOR BIOGRAPHIES
Please see Supporting Information online.
SUPPORTING INFORMATION
Additional Supporting Information may be found online in the supporting information tab for this article.
Appendix S1. Supplementary Methods and Materials (Spectroscopy and sampling mode).
REFERENCES
- [1].Mummery PL, Med. Chir. Trans 1907, 90, 589. [PMC free article] [PubMed] [Google Scholar]
- [2].Warren S, Sommers SC, Am. J. Pathol 1949, 25, 657. [PMC free article] [PubMed] [Google Scholar]
- [3].Kornbluth A, Marion JF, Salomon P, Janowitz HD, J. Clin. Gastroenterol 1995, 20, 280. [DOI] [PubMed] [Google Scholar]
- [4].Cho JH, Brant SR, Gastroenterology 2011, 140, 1704. [DOI] [PMC free article] [PubMed] [Google Scholar]
- [5].Podolsky DK, Engl N, J. Med 1991, 325, 928. [DOI] [PubMed] [Google Scholar]
- [6].Chassaing B, Darfeuille-Michaud A, Gastroenterology 2011, 140, 1720. [DOI] [PubMed] [Google Scholar]
- [7].Schreyer A, Rath H, Kikinis R, Völk M, Schölmerich J, Feuerbach S, Rogler G, Seitz J, Herfarth H, Gut 2005, 54, 250. [DOI] [PMC free article] [PubMed] [Google Scholar]
- [8].Shanahan F, Weinstein W, Bernstein C, Lancet 1994, 343, 71. [DOI] [PubMed] [Google Scholar]
- [9].Ollesch J, Heinze M, Heise HM, Behrens T, Brüning T, Gerwert K, J. Biophotonics 2014, 7, 210. [DOI] [PubMed] [Google Scholar]
- [10].Movasaghi Z, Rehman S, Ur Rehman DI, Appl. Spectrosc. Rev 2008, 43, 134. [Google Scholar]
- [11].Titus J, Viennois E, Merlin D, Perera AGU, J. Biophotonics 2016. 10.1002/jbio.201600041. [DOI] [Google Scholar]
- [12].Titus J, Filfili C, Hilliard JK, Ward JA, Perera AGU, Appl. Phys. Lett 2014, 104, 243705. [Google Scholar]
- [13].Sommer AJ, Tisinger LG, Marcott C, Story GM, Appl. Spectrosc 2001, 55, 252. [Google Scholar]
- [14].Kazarian S, Chan K, Analyst 2013, 138, 1940. [DOI] [PubMed] [Google Scholar]
- [15].Kazarian SG, Chan KLA, Biochim. Biophys. Acta Biomembr 2006, 1758, 858. [DOI] [PubMed] [Google Scholar]
- [16].Khan S, Vihinen M, BMC Struct. Biol 2007, 7, 1. [DOI] [PMC free article] [PubMed] [Google Scholar]
- [17].Chiti F, Dobson CM, Annu. Rev. Biochem 2006, 75, 333. [DOI] [PubMed] [Google Scholar]
- [18].Gupta A, Thelma BK, Genes Immun. 2016, 17, 105. [DOI] [PubMed] [Google Scholar]
- [19].Yu GL, Ni J, Rosen C, Zhang J, Wei P, PCT/US14/71169, 2003.
- [20].Vijay-Kumar M, Aitken JD, Carvalho FA, Cullender TC, Mwangi S, Srinivasan S, Sitaraman SV, Knight R, Ley RE, Gewirtz AT, Science 2010, 328, 228. [DOI] [PMC free article] [PubMed] [Google Scholar]
- [21].Yu C, Irudayaraj J, Biopolymers 2005, 77, 368. [DOI] [PubMed] [Google Scholar]
- [22].Baker MJ, Trevisan J, Bassan P, Bhargava R, Butler HJ, Dorling KM, Fielden PR, Fogarty SW, Fullwood NJ, Heys KA, Hughes C, Lasch P, Martin-Hirsch PL, Obinaju B, Sockalingum GD, Sule-Suso J, Strong RJ, Walsh MJ, Wood BR, Gardner P, Martin FL, Nat. Protoc 2014, 9, 1771. [DOI] [PMC free article] [PubMed] [Google Scholar]
- [23].Barth A, Biochim. Biophys. Acta 2007, 1767, 1073. [DOI] [PubMed] [Google Scholar]
- [24].Branden CI, Introduction to Protein Structure, Garland Science, NY: 1999. [Google Scholar]
- [25].Krimm S, Bandekar J, Adv. Protein Chem 1986, 38, 181. [DOI] [PubMed] [Google Scholar]
- [26].Elliott A, Ambrose E, Nature 1950, 165, 921. [DOI] [PubMed] [Google Scholar]
- [27].Barth A, Biochim. Biophys. Acta Bioener 2007, 1767, 1073. [DOI] [PubMed] [Google Scholar]
- [28].Hol WG, Halie LM, Sander C, Nature 1981, 294, 532. [DOI] [PubMed] [Google Scholar]
- [29].Sharma A, Ghosh KS, Singh BP, Gathania AK, Methods Appl. Fluoresc 2015, 3, 025002. [DOI] [PubMed] [Google Scholar]
- [30].Voet D, Voet J, Pratt C, Fundamentals of Biochemistry: Life at Molecular Level (4th ed) Wiley, US, 2012. [Google Scholar]
- [31].Baldwin RL, Zimm BH, Proc. Natl. Acad. Sci. USA 2000, 97, 12391. [DOI] [PMC free article] [PubMed] [Google Scholar]
- [32].Prestrelski SJ, Tedeschi N, Arakawa T, Carpenter JF, Biophys. J 1993, 65, 661. [DOI] [PMC free article] [PubMed] [Google Scholar]
- [33].Luthra S, Obert JP, Kalonia DS, Pikal MJ, J. Pharm. Sci 2007, 96, 61. [DOI] [PubMed] [Google Scholar]
- [34].Scheinin T, Butler DM, Salway F, Scallon B, Feldmann M, Clin. Exp. Immunol 2003, 133, 38. [DOI] [PMC free article] [PubMed] [Google Scholar]
- [35].D’Haens G, Daperno M, Curr. Gastroenterol. Rep 2006, 8, 506. [DOI] [PubMed] [Google Scholar]
- [36].Nevskaya N, Chirgadze YN, Biopolymers 1976, 15, 637. [DOI] [PubMed] [Google Scholar]
- [37].Koutroubakis IE, Petinaki E, Dimoulios P, Vardas E, Roussomoustakaki M, Maniatis AN, Kouroumalis EA, J. Clin. Pathol 2003,56,817. [DOI] [PMC free article] [PubMed] [Google Scholar]
- [38].Koelink P, Overbeek S, Braber S, Morgan M, Henricks P, Abdul RM, Verspaget H, Wolfkamp S, te Velde A, Jones C, Gut 2014, 63, 578. [DOI] [PMC free article] [PubMed] [Google Scholar]
- [39].Suzuki K, Sun X, Nagata M, Kawase T, Yamaguchi H, Sukumaran V, Kawauchi Y,Kawachi H,Nishino T,Watanabe K,Pathol.Int 2011,61,228. [DOI] [PubMed] [Google Scholar]
- [40].Khan S, Vihinen M, BMC Struct. Biol 2007, 7, 56. [DOI] [PMC free article] [PubMed] [Google Scholar]
- [41].Kwok SC, Mant CT, Hodges RS, Protein Sci. 2002, 11, 1519. [DOI] [PMC free article] [PubMed] [Google Scholar]
- [42].Viennois E, Baker MT, Xiao B, Wang L, Laroui H, Merlin D, J. Proteomics 2015, 112, 166. [DOI] [PMC free article] [PubMed] [Google Scholar]
- [43].Teague R, Fraser D, Clamp J, Br. Med. J 1973, 2, 645. [DOI] [PMC free article] [PubMed] [Google Scholar]
Associated Data
This section collects any data citations, data availability statements, or supplementary materials included in this article.


