Abstract
Background
Histone deacetylase inhibitors (HDACi) have therapeutic effects on various models of renal diseases including autosomal dominant polycystic kidney disease (ADPKD), but the molecular mechanism is unclear.
Objectives
Here, we studied the role of trichostatin A (TSA), a specific HDACi, in regulating cyst growth to test the possibility that HDACi might help manage ADPKD by enhancing autophagy.
Results
Autophagy protein expression was higher in cultured Pkd1 knockout (Pkd1<sup>–/–</sup>) cells, an in vitro model of cystogenesis, compared with control cells. TSA prevented cyst formation in Pkd1<sup>–/–</sup> cells. We further tested whether TSA could not reduce the size of an already established cyst after inhibition of autophagy by chloroquine in Pkd1<sup>–/–</sup> cells. In vivo, treatment with TSA significantly slowed cyst growth in Pkd1<sup>–/–</sup> mice. Moreover, TSA treatment stimulated AMPK and inactivated mTOR during cyst growth in Pkd1<sup>–/–</sup> cells and kidneys in mice.
Conclusions
Our results suggest that HDACi may prevent cyst formation by activation of the AMPK pathway and autophagy. They also imply that HDACi could have therapeutic potential for ADPKD treatment.
Keywords: Cystogenesis, Autophagy, Trichostatin A, Autosomal dominant polycystic kidney disease
Introduction
Autosomal dominant polycystic kidney disease (ADPKD) is a common monogenic kidney disease caused by mutations in PKD1 or PKD2 [1]. Affected patients may gradually lose their renal function because of progressive cyst formation in the kidneys. ADPKD leads to end-stage kidney disease in more than half of patients by almost 20 years of age [2]. Patient survival at the final stage of polycystic kidney disease depends on lifelong hemodialysis or kidney transplantation [3].
Multiple previous studies have been trying to elucidate the mechanisms that lead to cyst development in order to be able to treat polycystic kidney disease. However, the mechanism of cystogenesis in ADPKD remains incompletely understood. Most studies have suggested that cystogenesis is associated with renal epithelial cells with mutations or absence of polycystins exhibiting cellular aberrations including differentiation, increased cell proliferation, loss of cell polarity, and altered gene expression. These phenotypic cellular abnormalities are generally used as therapeutic targets for retarding cyst growth [4].
Previous studies demonstrated that targeting histone deacetylases (HDACs) with trichostatin A (TSA) or nicotinamide (vitamin B3) has therapeutic potential in experimental polycystic kidney disease models [5, 6]. A recent study suggested that TSA stimulated AMPK and inactivated mammalian target of rapamycin (mTOR) in an acute kidney injury model [7]. The AMPK signal pathway plays an important role in maintaining a normal kidney structure by affecting cell proliferation. Furthermore, activated AMPK could restore ERK activity, and it reduced the cystic index and proliferation rate in Pkd1 conditional knockout mice. However, the exact molecular mechanisms underlying the effect of TSA on cystogenesis remain poorly understood.
Autophagy is a highly conserved lysosomal degradation pathway that, regulated, degrades and recycles intracellular proteins and dysfunctional organelles [8]. During metabolic stress or nutritional deprivation, autophagy is activated and serves primarily as an adaptive mechanism for cell survival. Nevertheless, autophagy deregulation plays important roles in the pathogenesis of various diseases [9, 10].
In this study, we tested the hypothesis that TSA may prevent cyst formation by activation of the AMPK pathway and upregulated autophagy. We observed that TSA enhanced autophagy in Pkd1 knockout (Pkd1−/−) renal tubular cells. TSA further reduces cyst formation through activation of AMPK and restores autophagy activity. These findings indicate that TSA may play a role in the treatment of ADPKD.
Materials and Methods
Reagents and Antibodies
TSA was purchased from Enzo Life Sciences. Unless indicated, all other reagents including chloroquine were purchased from Sigma-Aldrich (St. Louis, MO, USA). The following primary antibodies were used: anti-LC3B from Novus Biologicals (Littleton, CO, USA); anti-β-actin and anti-cyclophilin B from Abcam; and anti-AMPK, anti-phospho-AMPK (Thr172), anti-P70S6K, and anti-phospho-P70S6K (T389) from Cell Signaling Technology (Danvers, MA, USA). All secondary antibodies for immunoblot analysis were from Thermo Fisher Scientific (Rockford, IL, USA).
Cell Culture and Reagents
Renal cortical tubular epithelial cells (RCTEC; wild-type [WT]) and Pkd1−/− cells, derived from collecting ducts and sorted by the collecting duct marker Dolichos biflorus agglutinin from kidneys of WT and Pkd1 null mice, were maintained in Dulbecco's modified Eagle's medium containing 2% fetal bovine serum, 0.75 µg interferon-γ, 1.0 g insulin, 0.67 mg sodium selenite, 0.55 g transferring, 0.2 g ethanolamine, 36 ng hydrocortisone, 0.10 µM 2,3,5-triiodo-L-thyronine, 100 units penicillin G (base) in combination with 0.30 mg additional glutamine, 100 µg streptomycin sulfate, and 0.1 mM citrate to maintain penicillin potency, as previously described. For cell sorting, we grew cells to confluence for 3 days at 37°C. After trypsinization, we incubated 106 cells with 10 µg Dolichos biflorus agglutinin (Vector Labs) and carried out cell sorting as described. We added 11.0 g sodium pyruvate to maintain cell viability in suspension media. We only used cells after sorting. Unless otherwise stated, we purchased all chemicals from Sigma-Aldrich.
Mouse Model and TSA Treatment
This study was conducted on male Pkd1−/− and WT mice. The mice were maintained according to local regulations and guidelines.
Male mice aged 8–12 weeks were used in this study. For TSA treatment, mice were intraperitoneally (i.p.) injected with a single dose of TSA at 1 mg/kg, while control animals were injected with a comparable volume of dimethyl sulfoxide (DMSO). To test the effect of chloroquine, 60 mg/kg chloroquine was injected (i.p.) 1 h prior to TSA administration and then daily after TSA treatment.
Proliferation Assay
Proliferative activity was determined using the WST-1 assay according to the manufacturer's instructions (Roche, Mannheim, Germany). The cells were seeded in 96-well tissue culture plates and maintained for 24 h with the standard medium. The WST-1 reagent was added and incubated for 1 h before reading the plate. Each assay was conducted in 6 sets.
Immunoblotting and Densitometry
For immunoblot analyses, fresh kidney tissue or cells were homogenized and lysed in buffer containing 1% NP-40, 50 mM Tris-HCl (pH 7.4), 100 mM NaCl, 10 mM MgCl2, and 1× protein inhibitor cocktail (Roche; #11873580001). The lysates (40 μg of protein/lane) were resolved by SDS-PAGE (10% Tris-glycine) and electrophoretically transferred onto PVDF membranes. The membranes were blocked for 1 h (5% dried milk), washed 3 times with TBS-Tween (0.05%), incubated for 1 h with the primary antibody, washed, incubated for 1 h with horseradish peroxidase-coupled secondary antibody, washed extensively, and processed for chemiluminescence by ECL (Amersham, Arlington Heights, IL, USA). The volume of individual immunoblot bands, in pixels, was determined by optical densitometry using ImageQuant software (Molecular Dynamics).
Histology and Immunofluorescence
For cyst histology and immunofluorescence, mouse tissues were obtained by perfusion fixation with 70 mm Hg pressure for 3 min. The mice were anesthetized and perfused with PBS containing 0.4% lidocaine and 0.01% heparin followed by fixation with 4% paraformaldehyde. For histology, the kidneys were removed and incubated in 10% phosphate-buffered formalin, hemisected in the midline sagittal plane, embedded in paraffin, and stained with hematoxylin-eosin or periodic acid-Schiff.
For immunofluorescence, tissues were fixed in 4% paraformaldehyde in PBS and embedded in OCT (Optimal Cutting Temperature) compound. Kidney sections (4–5 µm thick) were blocked with 0.1% BSA/10% goat serum in PBS for 1 h at room temperature and incubated with primary antibodies overnight at 4°C followed by the secondary antibodies for 1 h at room temperature. Images were obtained either with a confocal laser scanning microscope (Zeiss LSM 510) or a Nikon TE2000U inverted microscope equipped for widefield fluorescence and MetaMorph (Universal Imaging) acquisition software. Where noted, images were postprocessed with AutoDeblur/AutoVisualize (Media Cybernetics) deconvolution software.
Analysis of Autophagy Dynamics by a Tandem mRFP-GFP-LC3 Reporter in Transfected Cells and in Transgenic Mice
The dynamic process of autophagy was analyzed in cultured tubular cells expressing mRFP-GFP-LC3 or in mice, as described in our recent work. The rationale for this method is that acid-sensitive GFP is quenched in the low-pH lysosomal environment, whereas acid-insensitive RFP is more stable and maintained. Thus, colocalization of RFP fluorescence with GFP in a particle indicates an autophagosome. For in vitro experiments, cultured proximal tubular cells were transiently transfected with mRFP-GFP-LC3 (ptfLC3; Addgene plasmid 21074). After treatment, the cells were fixed with 4% paraformaldehyde for fluorescence microscopy (Zeiss 780 upright confocal microscope). The numbers of GFP-LC3 puncta per cell and RFP-LC3 puncta per cell were counted separately using ImageJ. The number of autophagosomes was indicated by GFP dots, and the number of autolysosomes was obtained by subtracting GFP dots from RFP dots. The number of autolysosomes was further divided by the total number of RFP dots to indicate the autophagic flux rate. For in vivo experiments, after treatment, CAG-RFP-GFP-LC3 mice were perfused fixed with 4% paraformaldehyde. Kidneys were further fixed overnight with the same fixative, balanced with 30% sucrose, and embedded in OCT compound for cryosection and confocal microscopy. For each section, 8–10 fields (×630) were selected randomly, and quantitative analysis was performed by the method described above for cultured cells.
Renal Function
Renal function was determined by blood urea nitrogen (BUN) and serum creatinine measurements using commercial kits from Stanbio Laboratory (Boerne, TX, USA). In brief, blood samples were collected for coagulation and centrifugation at room temperature to collect serum. For BUN, the reaction was conducted at 100°C for 12 min, and the absorbance at 520 nm was recorded by the end of the reaction. For serum creatinine, samples were added to a prewarmed (37°C) reaction mixture, and the absorbance at 510 nm was monitored kinetically at 20 and 80 s of the reaction. BUN and creatinine levels (mg/dL) were then calculated based on standard curves.
Cystic Index
The extent of tubular cyst formation was quantified in sagittal sections of whole kidneys. Four sections (two each from the mid-sagittal region of each kidney) were analyzed for each experimental animal. Whole kidney images were obtained using automated image acquisition by the scan slide module in MetaMorph (Universal Imaging). Total kidney area, total cystic area, and total noncystic area were measured using the integrated morphometry feature in MetaMorph. The cystic index was calculated according to the formula “cystic index = (total cystic area/total kidney area) × 100” and is expressed as a percentage.
Statistics
The data were analyzed by Kruskal-Wallis nonparametric one-way analysis of variance followed by Dunn's multiple-comparison test. A value of p < 0.05 was considered significant. All data are presented as means ± SD.
Results
TSA Prevents Cyst Formation in Pkd1 Mutant Renal Epithelial Cells
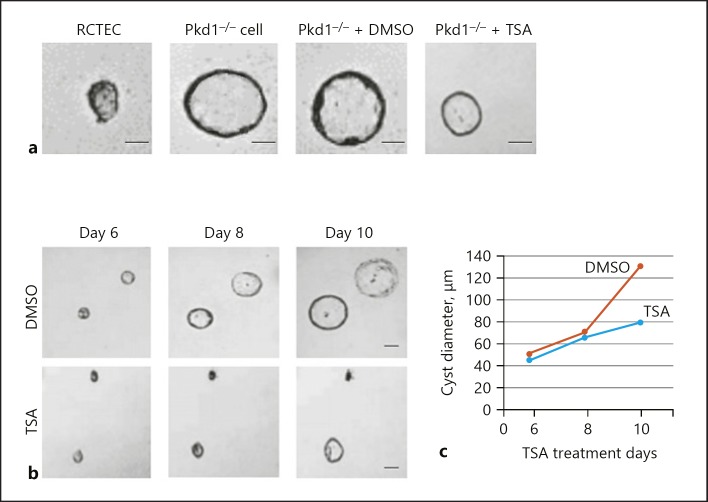
To determine whether TSA does indeed have an effect on cyst formation, we grew Pkd1 mutant renal epithelial cells (Pkd1−/− cells) and a normal human RCTEC line derived from normal distal tubule cells (as a control) in three-dimensional (3D) Matrigel-collagen I gels that were treated with either TSA or DMSO (vehicle). As a first step, we confirmed that the Pkd1−/− cells spontaneously made cysts in 3D culture (Fig. 1a). We then treated the cells with TSA on day 4 and found that this treatment did indeed prevent cyst formation. Finally, we let the cysts grow for 10 days and treated them with TSA on days 6, 8, and 10. The cysts were examined and photographed every 2 days from day 6 to day 10 of culture (Fig. 1a). The cysts continuously enlarged in Pkd1−/− cells. Treatment with TSA not only arrested cyst growth but also shrank the cysts (Fig. 1b, c). Taken together, these data show convincingly that histone deacetylase-specific inhibition by TSA reduces cyst growth in vitro.
Fig. 1.
TSA prevents cyst formation in Pkd1 mutant renal epithelial cells. a Representative light micrographs of RCTEC and Pkd1−/− cell cultures in collagen gels. The light micrographs were taken on day 8 after cell seeding. The cells were continuously exposed to 0.1 μM TSA or DMSO (control). Scale bars, 20 μm. b Representative light micrographs of Pkd1−/− cell cyst enlargement in collagen gels. The light micrographs were taken at the indicated days after cell seeding. The cells were continuously exposed to 0.1 μM TSA or DMSO (control). Scale bars, 50 μm. c Pkd1−/− cell cyst enlargement shown as cyst diameters with TSA treatment (mean ± SD; >30 cysts analyzed per time point). TSA, trichostatin A; RCTEC, renal cortical tubular epithelial cell.
TSA Enhances Autophagy in Pkd1 Mutant Renal Epithelial Cells
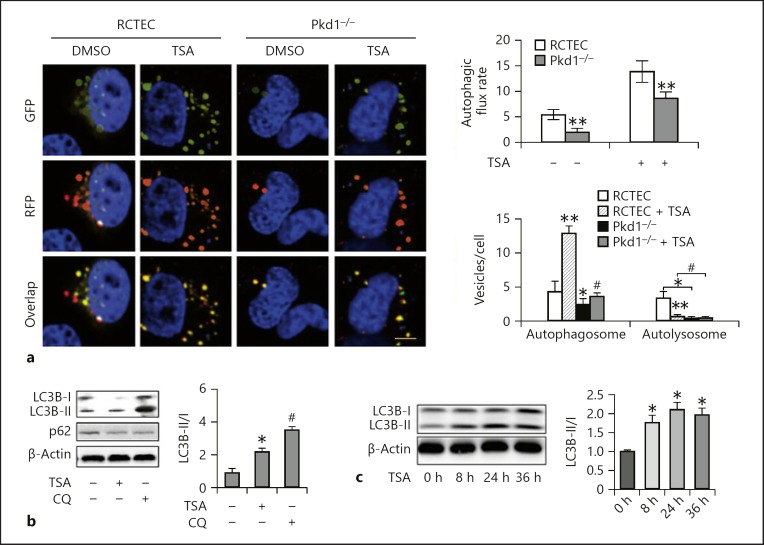
Defective autophagy, a cellular process of degrading cytoplasmic components for energy production, has been associated with the pathogenesis of ADPKD in recent studies [11]. Therefore, we examined the effects of TSA on autophagy in Pkd1−/− cells. Autophagic activity was assessed by detecting the intracellular levels of LC3 (microtubule-associated protein light chain 3), a biochemical hallmark of autophagy, through immunofluorescence and Western blot analysis. To quantitatively study defects in autophagic progression, we transferred mRFP-GFP-LC3 plasmid into the cells to count the numbers of autophagosomes and autolysosomes.
In autophagosomes, the combination of green GFP-LC3 and red RFP-LC3 signals shows yellow, while in autolysosomes, EGFP fluorescence is quenched by the acidic environment, and thus only red is visible. In the cells expressing mRFP-GFP-LC3 (Fig. 2a) (control cells), almost all GFP signals colocalized with RFP, exhibiting a yellow color indicative of autophagosomes. The Pkd1−/− cells contained fewer LC3-positive puncta in the absence of TSA and more LC3-positive puncta following TSA treatment when compared with the WT cells, indicating that TSA treatment increased the numbers of both GFP-LC3 and RFP-LC3 puncta. Consistently, the TSA-treated Pkd1−/− cells were displaying a significant increase in LC3B-II protein level (Fig. 2b). This increase was unlikely to be attributable to autophagy activation, since the cells did not show decreased levels of p62 protein (Fig. 2b) and did not accumulate LC3B-II as effectively as the WT cells in response to TSA treatment. Treatment with chloroquine, an autolysosomal inhibitor, markedly increased LC3B-II accumulation [12]. Figure 2b shows that the level of turnover was increased in Pkd1−/− cells compared with untreated cells, indicating an increased LC3B-II turnover and induction of autophagic flux by TSA.
Fig. 2.
TSA enhances autophagy in Pkd1 mutant renal epithelial cells. a Representative images showing GFP-LC3 and mRFP-LC3 puncta in transfected cells. Yellow puncta indicate autophagosomes and red dots indicate autolysosomes. Left: representative images. Scale bar, 100 μm. Right: analysis of autophagic flux rate and quantitative analysis of autophagosomes and autolysosomes per cell. Data are expressed as mean ± SD. * p < 0.05, ** p < 0.01 vs. control group; # p < 0.05 vs. group without TSA. b Pkd1−/− cells were treated or untreated with TSA (0.1 μM) in the absence or presence of 20 μM CQ. The cells were then collected for immunoblot analysis of LC3B and p62. β-Actin was used as a loading control. Left: representative immunoblots. Right: densitometric analysis of LC3B signals. Data are expressed as mean ± SD. * p < 0.05 vs. control group; # p < 0.05 vs. group without CQ. c Pkd1−/− cells were treated with 0.1 μM TSA for 8, 24, or 36 h. After treatment, whole-cell lysates were collected for immunoblot analysis of LC3B. Left: representative immunoblots. Right: densitometric analysis of LC3B signals. After normalization with LC3B-I, the protein signal of the control was arbitrarily set as 1, and the signals of the other conditions were normalized with the control to calculate fold changes. Data are expressed as mean ± SD. * p < 0.05 vs. control group. TSA, trichostatin A; RCTEC, renal cortical tubular epithelial cell; CQ, chloroquine.
Effect of Autophagy on Cell Proliferation in TSA-Treated Pkd1−/− Cells
We next sought to determine whether TSA-enhanced autophagy affects cell proliferation in ADPKD. Pkd1−/− cells were pre-exposed to TSA for 5 days, then treated with 5 mM of 3-methyladenine (3-MA) to inhibit autophagy. We observed that 3-MA inhibited LC3B-II conversion and p62 degradation (Fig. 3a). To further determine whether autophagy is associated with cell proliferation in Pkd1−/− cells, cells were pre-exposed to TSA for 5 days, then treated with rapamycin (200 nM) to induce autophagy. Rapamycin treatment promoted LC3B-II conversion and p62 degradation in Pkd1−/− cells (Fig. 3b). We further analyzed the effect of 3-MA and rapamycin on the proliferation of Pkd1−/− cells after TSA treatment. As shown in Figure 3c, the total cell number counting showed there was a significant increase after TSA treatment, and 3-MA treatment significantly increased the cell number of Pkd1−/− cells after TSA treatment, while rapamycin treatment significantly increased the Pkd1−/− cell number after TSA treatment.
Fig. 3.
Effect of autophagy on cell proliferation during TSA treatment. a Expression of LC3B and p62 in Pkd1−/− cells pretreated with TSA for 5 days and then incubated with 3-MA (5 mM). The relative ratio of protein expression was analyzed. * p < 0.05 vs. control group. b Expression of LC3B and p62 in Pkd1−/− cells pretreated with TSA and then incubated with rapamycin (200 nM). The relative ratio of protein expression was analyzed. * p < 0.05 vs. control group. c Cells were trypsinized and counted after having been pretreated with TSA and then incubated with 3-MA or rapamycin. * p < 0.05 vs. control group. TSA, trichostatin A; 3-MA, 3-methyladenine.
Blockage of Autophagy by Chloroquine Abolishes the Protective Effect of TSA against Cyst Formation in vitro
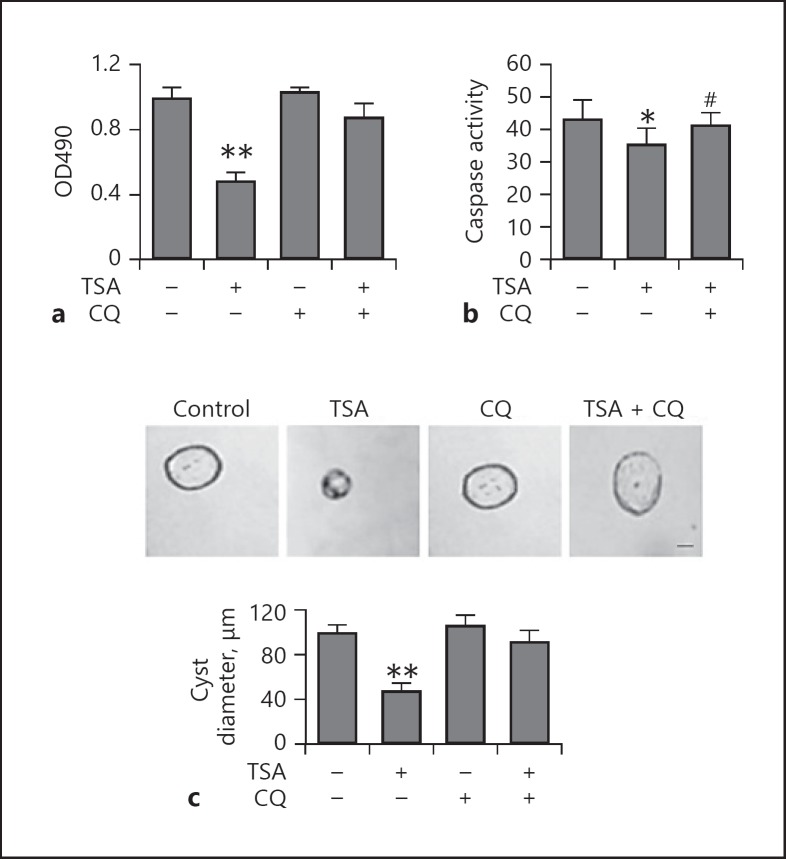
To determine the involvement of autophagy in the prevention of cyst formation, we first compared the effects of TSA on Pkd1−/− cells in 3D Matrigel-collagen I gels that were treated with chloroquine. We showed that TSA significantly inhibited the proliferation of Pkd1−/− cells when compared to DMSO-treated cells. In the presence of chloroquine, when autophagy was inhibited by chloroquine, TSA was unable to suppress the cell viability of Pkd1−/− cells (Fig. 4a). Consistently, caspase activation in Pkd1−/− cells was also attenuated by TSA under these conditions (Fig. 4b). We then treated the cells with TSA on day 0 and found that this treatment did indeed slow cyst growth in the absence of chloroquine. Notably, after treatment with chloroquine, TSA was unable to suppress cyst growth (Fig. 4c), suggesting a role of autophagy in the cyst growth-slowing effect of TSA.
Fig. 4.
Blockage of autophagy by CQ abolishes the suppressive effect of TSA on cyst formation in vitro. a Effect of TSA on the biological properties of Pkd1−/− cells. Cytotoxicity assayed by MTT assay (mean ± SD, n = 3; ** p < 0.01 vs. control). Pkd1−/− cells were incubated with TSA (0.1 μM) for 8 days or not, in the absence or presence of 20 μM CQ. Cell viability is shown as OD490. b Caspase activity measured by enzymatic assay using DEVD-AFC as substrates. * p < 0.05 vs. untreated group; # p < 0.05 vs. TSA-only group. c Top: representative light micrographs of Pkd1−/− cell cyst enlargement in collagen gels. Cells were continuously exposed to 0.1 μM TSA for 8 days or not, in the absence or presence of 20 μM CQ. Scale bar, 30 μm. Bottom: cell cyst enlargement shown as cyst diameters with TSA (mean ± SD, >30 cysts analyzed per time point; ** p < 0.01 vs. control). TSA, trichostatin A; CQ, chloroquine.
TSA Enhances Renal Tubular Autophagy in vivo
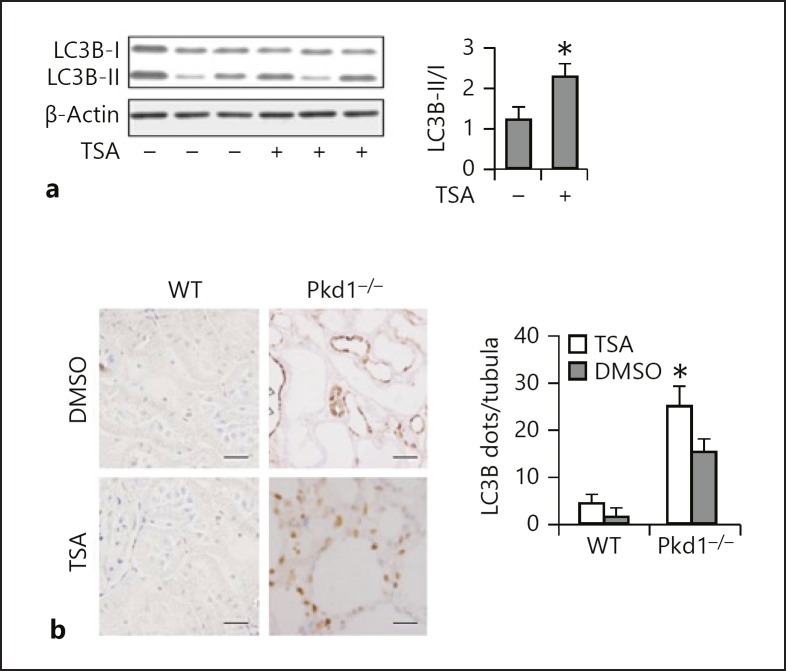
We then examined the effects of TSA on tubular autophagy in PC1-defective mouse model. Polycystin 1 (PC1)-defective (Pkd1−/−) and WT mice were divided into a control and a TSA group. The control mice were put on a standard diet and the TSA mice received the same diet supplemented with a daily TSA injection at 1 mg/kg. As shown in Figure 5a, the Pkd1−/− mice had a persistent upregulation of LC3B-II in the kidneys; TSA further enhanced LC3B-II expression. Autophagy induction was further shown by immunohistochemical staining of LC3B (Fig. 5b), which displayed a granular, punctate staining in tubule cells in Pkd1−/− mice. In comparison with the control group, lack of PC1 led to increases in numbers of LC3B puncta in the proximal tubules. Of note, TSA further enhanced LC3B punctum staining in both number and intensity. Together, these results suggest that TSA promotes autophagy in proximal tubules in Pkd1−/− mice.
Fig. 5.
TSA enhances renal tubular autophagy in vivo. a Quantification of the expression of LC3B-II through Western blot analysis of total lysates. Mice were treated with a daily TSA injection at 1 mg/kg for 24 days. β-Actin was used as a loading control; n = 3 from 4 independent experiments. * p < 0.05 vs. control. b Left: representative images of LC3B staining. ×400. Right: quantitative analysis of punctate LC3B staining. Data are expressed as mean ± SD. * p < 0.05 vs. control. TSA, trichostatin A.
TSA Delays Renal Cyst Growth in Pkd1 Knockout Mouse Models
Given the vitro evidence that TSA could decrease cystic epithelial cell growth, we examined the effect of TSA on cyst growth in vivo utilizing Pkd1−/− mouse models. First, we determined if TSA reduced cyst growth in Pkd1−/− mice. We treated Pkd1−/− and WT mice with daily intraperitoneal injections of TSA at 1 mg/kg or DMSO (control), respectively, from postnatal day 8 to postnatal day 24. The kidneys were harvested and analyzed on postnatal day 25. No death of an animal was observed during the treatment. The control mice, which had not received TSA, had normal kidneys. The Pkd1−/− mice displayed tubular dilation and small cysts accompanied by increased 2-kidney-weight/body-weight ratios (2KW/BW%) (Fig. 6a), proliferation indices (Fig. 6b), and cystic indices (Fig. 6c). TSA treatment significantly decreased the 2KW/BW% in the Pkd1−/− mice compared with those in the DMSO-injected mice. We also found that TSA delayed cyst growth, characterized by a decrease in cystic index. Reduction in cyst growth correlated with significantly improved renal function, as indicated by lower BUN (Fig. 6d) and creatinine levels (Fig. 6e) in the TSA-treated mice.
Fig. 6.
Effects of TSA treatment on 2KW/BW%, cystic area, proliferation index, and renal failure. Blood samples and kidneys of Pkd1−/− mice were collected 25 days after TSA treatment for biochemical and histological analyses. a 2KW/BW%. b Number of proliferating cells, as determined by Ki-67 staining. c Cystic area. d Efficiency of TSA in reducing BUN. e Efficiency of TSA in reducing serum creatinine. Data are expressed as mean ± SD. ** p < 0.01 vs. WT group; # p < 0.05, ## p < 0.01 vs. group without TSA. TSA, trichostatin A; 2KW/BW%, 2-kidney-weight/body-weight ratio; BUN, blood urea nitrogen.
Inhibition of Autophagy by Chloroquine Abolishes the Protective Effect of TSA against Cyst Growth in Pkd1 Knockout Mice
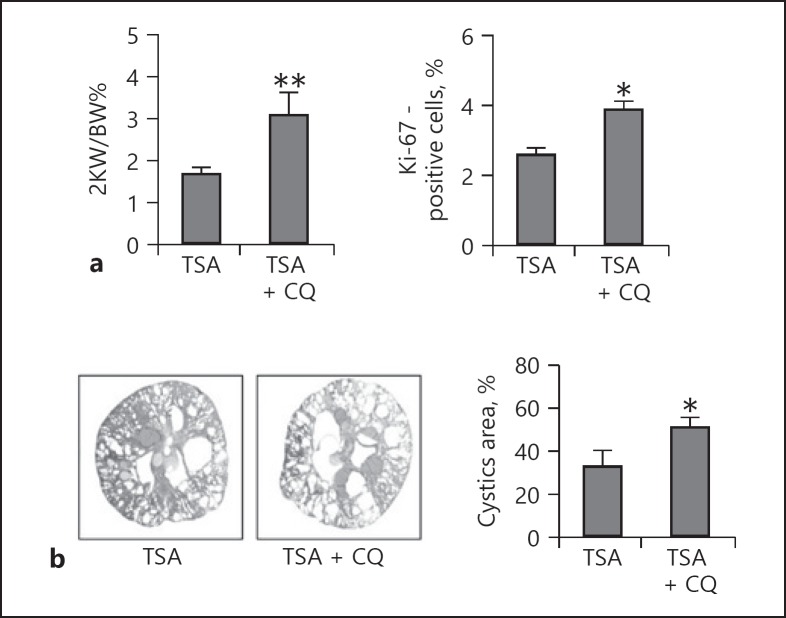
To assess whether autophagy contributed to the TSA-mediated inhibition of cystogenesis in vivo, we examined the effect of chloroquine on cyst growth inhibition by TSA in Pkd1−/− mice. Mice that had received chloroquine and were killed 25 days later (n = 5) displayed tubular dilation and small cysts accompanied by an increased 2KW/BW%, cystic index, and proliferation index (Fig. 7). These parameters indicated that in the presence of chloroquine, the cyst growth-delaying effects of TSA were completely compromised.
Fig. 7.
Inhibition of autophagy by CQ abolishes the protective effects of TSA against cyst growth in Pkd1 knockout mice. Pkd1−/− mice received CQ in the presence of TSA and were killed 25 days later; blood samples and kidneys were collected for biochemical and histological analyses. a 2KW/BW% and the number of proliferating cells. b Cystic area. Data are expressed as mean ± SD. * p < 0.05, ** p < 0.01 vs. TSA-only group. TSA, trichostatin A; CQ, chloroquine; 2KW/BW%, 2-kidney-weight/body-weight ratio.
TSA Activates AMPK and Inactivates mTOR in Pkd1 Mutant Renal Epithelial Cells and Mice
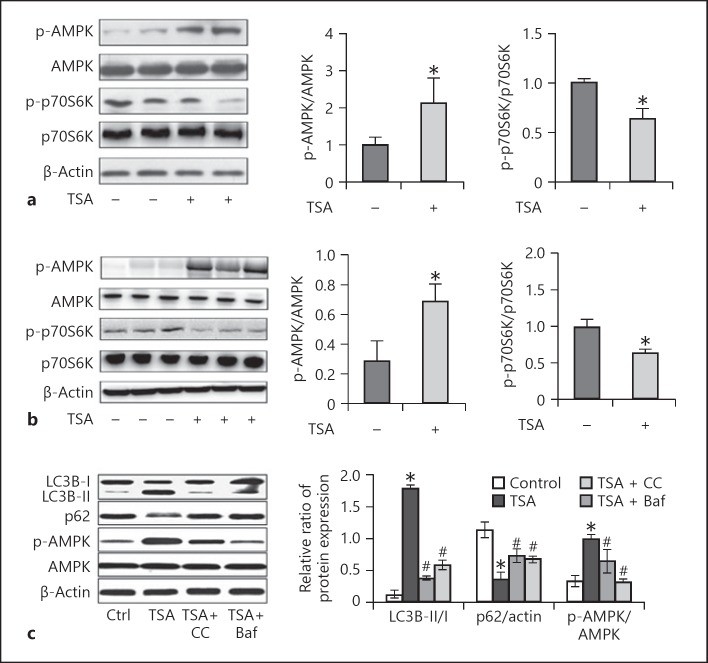
Autophagy regulates a complex molecular machinery at various levels by multiple signaling pathways [8, 13]. Mounting evidence suggests that the mTOR and AMPK signaling pathways are relevant to cystogenesis in polycystic kidney disease. The ability of TSA to activate autophagy is likely due to the fact that these signaling routes are altered during cystogenesis. To gain initial insights into the mechanism by which TSA activates autophagy in Pkd1 mutant renal epithelial cells and Pkd1-defective mice, we finally investigated whether the AMPK-mTOR-p70S6K signaling pathway, a classic autophagy signaling pathway, was involved in TSA-induced autophagy. In Pkd1−/− renal epithelial cells, phosphorylation/activation of AMPK was induced, which was accompanied with marginal inactivation of mTOR, as indicated by a decrease in phosphorylated p70S6K (p-p70S6K) (Fig. 8a). TSA significantly increased p-AMPK and decreased p-p70S6K, suggesting AMPK activation and mTOR inactivation by TSA. Similar effects of TSA were observed in mouse kidney tissues (Fig. 8b). These results suggest that TSA may enhance autophagy in polycystic kidney disease to delay cystogenesis by activating AMPK and suppressing mTOR.
Fig. 8.
TSA activates AMPK and inactivates mammalian target of rapamycin (mTOR) in Pkd1 mutant renal epithelial cells and mice. a Pkd1−/− cells were treated with TSA (0.1 μM) only for 8 days or not. After treatment, cells were collected for immunoblot analysis of p-AMPK, AMPK, p-p70S6K, and p70S6K. β-Actin was used as a loading control. Left: representative immunoblots. Right: densitometric analysis of p-AMPK and p-p70S6K signals after normalization with AMPK and p70S6K, respectively. Data are expressed as mean ± SD. * p < 0.05 vs. untreated group. b Pkd1−/− mice were injected with DMSO or a single dose of TSA (1 mg/kg, i.p., daily injection). Kidneys were collected 25 days after treatment for immunoblot analysis of p-AMPK, AMPK, p-p70S6K, and p70S6K. β-Actin was used as a loading control. Left: representative immunoblots. Right: densitometric analysis of p-AMPK and p-p70S6K signals after normalization with total AMPK and p70S6K, respectively. Data are expressed as mean ± SD. * p < 0.05 vs. untreated group. c Pkd1−/− mice were pretreated with TSA and recovered for 3 days, and were then treated with Baf or CC. The expression of p-AMPK, LC3B, and p62 was examined by Western blot. Data are expressed as mean ± SD. * p < 0.05 vs. untreated group; # p < 0.05 vs. only-TSA group. TSA, trichostatin A; CC, compound C.
To further investigate whether TSA-induced autophagy has a connection with the AMPK/mTOR signaling pathway, we used compound C (an AMPK inhibitor; 2.5 μM) and Baf (an autophagy inhibitor; 100 nM) for exploration. We observed that inhibition of AMPK by compound C or Baf significantly decreased LC3B-I/II expression and increased p62 expression (Fig. 8c). In addition, we tested whether compound C and Baf influenced cell proliferation in Pkd1−/− renal epithelial cells. Compound C and Baf treatment significantly decreased the number of Pkd1−/− cells.
Discussion
Previous studies have suggested therapeutic effects of HDAC inhibitors (HDACi) in experimental models of polycystic kidney disease [6, 14], but the underlying mechanisms have remained largely unclear. In the current study, we demonstrated an effect of TSA, a classic HDACi, on cyst development in polycystic kidney disease. We found that TSA significantly delays cyst growth. Importantly, we showed that TSA can stimulate autophagy in Pkd1−/− cells and kidneys. Inhibition of autophagy by chloroquine in tubular cells led to neutralization of the cyst-inhibitory activity of TSA, supporting a pivotal role of autophagy in the delay of cyst growth with TSA. Mechanistically, treatment with TSA stimulated AMPK and inactivated mTOR signaling in Pkd1 conditional knockout cells and mouse models, suggesting that HDACi may enhance autophagy by activating AMPK and inhibiting mTOR.
Polycystic kidney disease has been compared to benign tumors. Cyst formation and enlargement depend on the existence of tubules and ducts early in their growth, which have been found to be clonal and to exhibit an increased cell proliferation rate [15, 16]. HDACi are being intensively developed as anticancer drugs, since treatment with HDACi can suppress cell proliferation and induce differentiation [17, 18]. Together, these observations show the critical role of HDACi in polycystic kidney disease pathogenesis. In this work, we have demonstrated that TSA suppresses cell proliferation in ADPKD cells. Our results also suggest that TSA targeting HDACs may be a promising candidate for polycystic kidney disease treatment.
Previous studies have shown that HDACi reduce the progression of cyst formation and slow the decline in kidney function in a zebrafish pkd2 mutant model [19]. We further verified this effect of TSA in a mouse Pkd1−/− model. A few recent studies have elucidated that HDACi cancel the autophagy-inhibitory effect of TGF-β in endothelial progenitor cells [20]. HDACi could also prevent declines in podocyte autophagy in diabetic models [21]. In addition, TSA was shown to promote autophagy in neurons and to ameliorate neuronal apoptosis and brain injury induced by subarachnoid hemorrhage in rats [22]. Despite these previous studies, the exact role of autophagy in the effects of HDACi remains unclear. Using pharmacologic and genetic inhibitory approaches, our current study has shown that autophagy is also upregulated by TSA in Pkd1 mutant renal epithelial cells and tissues.
The mechanisms by which HDACi regulate autophagy are currently unclear. There is a role of HDACs in regulating acetylation, which may regulate several ATG proteins [23, 24]. To define how HDACi activate autophagy in proximal tubular cells, we further examined the effect of TSA on autophagy regulators (AMPK and mTOR) by detecting expression and/or phosphorylation of the proteins AMPK and p70S6K.
We found that TSA could enhance AMPK activation while blocking mTOR activation. The results suggest that HDACi may activate autophagy in cystogenesis of polycystic kidney disease at least partially through AMPK and mTOR. It has been reported that AMPK signaling plays an important role in the regulation of cellular autophagy, especially during the autophagosome elongation stage. An activated AMPK pathway phosphorylates tuberin, an indirect inhibitor of mTOR, which regulates tubular cell turnover and whose abnormal activation leads to proliferation of tubular cystic cells and to apoptosis of normal tubular cells. Emerging evidence has suggested that the AMPK-mTOR pathway could also inhibit fibrosis and inflammation and reverse hyperglycemia-induced endothelial dysfunction. Therefore, AMPK blocks two important pathways involved in the progress of ADPKD. TSA could be a novel natural AMPK agonist and alleviate polycystic kidney disease in animal models through inhibition of abnormal cell proliferation. Our findings are consistent with these results and suggest that TSA may inhibit cystogenesis through an AMPK-dependent pathway.
In summary, our data indicate that TSA hindered the development of renal cysts in in vitro models by inhibiting cyst epithelial proliferation. The mechanism of cyst inhibition may be involved in a TSA-regulated autophagy signaling pathway. Our further in vivo studies suggest that targeting HDACs may be a promising candidate for polycystic kidney disease treatment.
Statement of Ethics
The animal protocols used in this study were approved by the Institutional Animal Care and Use Committee of Guangdong Province (Guangdong Government Publication No. 41, 2010).
Disclosure Statement
No potential conflicts of interest are disclosed.
Acknowledgements
This work was supported by the Key Renal Laboratory of Shenzhen, Department of Nephrology, Shenzhen People's Hospital, PR China (No. ZDSYS201504301616234); the Science and Technology Planning Project of Shenzhen, PR China (No. JCYJ20150403101146288); and the Health Bureau Health Scientific Research Projects of Shenzhen, PR China (No. 201501003).
References
- 1.Torres VE, Harris PC. Autosomal dominant polycystic kidney disease: the last 3 years. Kidney Int. 2009 Jul;76((2)):149–68. doi: 10.1038/ki.2009.128. [DOI] [PMC free article] [PubMed] [Google Scholar]
- 2.Ong AC, Devuyst O, Knebelmann B, Walz G, ERA-EDTA Working Group for Inherited Kidney Diseases Autosomal dominant polycystic kidney disease: the changing face of clinical management. Lancet. 2015 May;385((9981)):1993–2002. doi: 10.1016/S0140-6736(15)60907-2. [DOI] [PubMed] [Google Scholar]
- 3.Cornec-Le Gall E, Audrézet MP, Chen JM, Hourmant M, Morin MP, Perrichot R, et al. Type of PKD1 mutation influences renal outcome in ADPKD. J Am Soc Nephrol. 2013 May;24((6)):1006–13. doi: 10.1681/ASN.2012070650. [DOI] [PMC free article] [PubMed] [Google Scholar]
- 4.Zhou X, Fan LX, Peters DJ, Trudel M, Bradner JE, Li X. Therapeutic targeting of BET bromodomain protein, Brd4, delays cyst growth in ADPKD. Hum Mol Genet. 2015 Jul;24((14)):3982–93. doi: 10.1093/hmg/ddv136. [DOI] [PMC free article] [PubMed] [Google Scholar]
- 5.Zhou X, Fan LX, Sweeney WE, Jr, Denu JM, Avner ED, Li X. Sirtuin 1 inhibition delays cyst formation in autosomal-dominant polycystic kidney disease. J Clin Invest. 2013 Jul;123((7)):3084–98. doi: 10.1172/JCI64401. [DOI] [PMC free article] [PubMed] [Google Scholar]
- 6.Fan LX, Li X, Magenheimer B, Calvet JP, Li X. Inhibition of histone deacetylases targets the transcription regulator Id2 to attenuate cystic epithelial cell proliferation. Kidney Int. 2012 Jan;81((1)):76–85. doi: 10.1038/ki.2011.296. [DOI] [PMC free article] [PubMed] [Google Scholar]
- 7.Liu J, Livingston MJ, Dong G, Tang C, Su Y, Wu G, et al. Histone deacetylase inhibitors protect against cisplatin-induced acute kidney injury by activating autophagy in proximal tubular cells. Cell Death Dis. 2018 Feb;9((3)):322. doi: 10.1038/s41419-018-0374-7. [DOI] [PMC free article] [PubMed] [Google Scholar]
- 8.Ohsumi Y. Historical landmarks of autophagy research. Cell Res. 2014 Jan;24((1)):9–23. doi: 10.1038/cr.2013.169. [DOI] [PMC free article] [PubMed] [Google Scholar]
- 9.Choi AM, Ryter SW, Levine B. Autophagy in human health and disease. N Engl J Med. 2013 May;368((19)):1845–6. doi: 10.1056/NEJMc1303158. [DOI] [PubMed] [Google Scholar]
- 10.Huber TB, Edelstein CL, Hartleben B, Inoki K, Jiang M, Koya D, et al. Emerging role of autophagy in kidney function, diseases and aging. Autophagy. 2012 Jul;8((7)):1009–31. doi: 10.4161/auto.19821. [DOI] [PMC free article] [PubMed] [Google Scholar]
- 11.De Rechter S, Decuypere JP, Ivanova E, van den Heuvel LP, De Smedt H, Levtchenko E, et al. Autophagy in renal diseases. Pediatr Nephrol. 2016 May;31((5)):737–52. doi: 10.1007/s00467-015-3134-2. [DOI] [PubMed] [Google Scholar]
- 12.Klionsky DJ, Abdelmohsen K, Abe A, Abedin MJ, Abeliovich H, Acevedo Arozena A, et al. Guidelines for the use and interpretation of assays for monitoring autophagy. Autophagy. ((3rd edition)) 2016;12:1–222. doi: 10.1080/15548627.2015.1100356. [DOI] [PMC free article] [PubMed] [Google Scholar]
- 13.Yang Z, Klionsky DJ. Eaten alive: a history of macroautophagy. Nat Cell Biol. 2010 Sep;12((9)):814–22. doi: 10.1038/ncb0910-814. [DOI] [PMC free article] [PubMed] [Google Scholar]
- 14.Cao S, Zhong B, Yue H, Zeng H, Zeng J. Development and testing of a sustainable environmental restoration policy on eradicating the poverty trap in China's Changting County. Proc Natl Acad Sci USA. 2009 Jun;106((26)):10712–6. doi: 10.1073/pnas.0900197106. [DOI] [PMC free article] [PubMed] [Google Scholar]
- 15.Qian F, Watnick TJ, Onuchic LF, Germino GG. The molecular basis of focal cyst formation in human autosomal dominant polycystic kidney disease type I. Cell. 1996 Dec;87((6)):979–87. doi: 10.1016/s0092-8674(00)81793-6. [DOI] [PubMed] [Google Scholar]
- 16.Lanoix J, D'Agati V, Szabolcs M, Trudel M. Dysregulation of cellular proliferation and apoptosis mediates human autosomal dominant polycystic kidney disease (ADPKD) Oncogene. 1996 Sep;13((6)):1153–60. [PubMed] [Google Scholar]
- 17.Bieliauskas AV, Pflum MK. Isoform-selective histone deacetylase inhibitors. Chem Soc Rev. 2008 Jul;37((7)):1402–13. doi: 10.1039/b703830p. [DOI] [PMC free article] [PubMed] [Google Scholar]
- 18.Mehnert JM, Kelly WK. Histone deacetylase inhibitors: biology and mechanism of action. Cancer J. 2007 Jan-Feb;13((1)):23–9. doi: 10.1097/PPO.0b013e31803c72ba. [DOI] [PubMed] [Google Scholar]
- 19.Cao Y, Semanchik N, Lee SH, Somlo S, Barbano PE, Coifman R, et al. Chemical modifier screen identifies HDAC inhibitors as suppressors of PKD models. Proc Natl Acad Sci USA. 2009 Dec;106((51)):21819–24. doi: 10.1073/pnas.0911987106. [DOI] [PMC free article] [PubMed] [Google Scholar]
- 20.Patschan D, Schwarze K, Henze E, Patschan S, Müller GA. Endothelial autophagy and Endothelial-to-Mesenchymal Transition (EndoMT) in eEPC treatment of ischemic AKI. J Nephrol. 2016 Oct;29((5)):637–44. doi: 10.1007/s40620-015-0222-0. [DOI] [PMC free article] [PubMed] [Google Scholar]
- 21.Khan S, Kumar S, Jena G. Valproic acid reduces insulin-resistance, fat deposition and FOXO1-mediated gluconeogenesis in type-2 diabetic rat. Biochimie. 2016 Jun;125:42–52. doi: 10.1016/j.biochi.2016.02.014. [DOI] [PubMed] [Google Scholar]
- 22.Shao A, Wang Z, Wu H, Dong X, Li Y, Tu S, et al. Enhancement of Autophagy by Histone Deacetylase Inhibitor Trichostatin A Ameliorates Neuronal Apoptosis After Subarachnoid Hemorrhage in Rats. Mol Neurobiol. 2016 Jan;53((1)):18–27. doi: 10.1007/s12035-014-8986-0. [DOI] [PubMed] [Google Scholar]
- 23.Xie Y, Kang R, Sun X, Zhong M, Huang J, Klionsky DJ, et al. Posttranslational modification of autophagy-related proteins in macroautophagy. Autophagy. 2015;11((1)):28–45. doi: 10.4161/15548627.2014.984267. [DOI] [PMC free article] [PubMed] [Google Scholar]
- 24.Lapierre LR, Kumsta C, Sandri M, Ballabio A, Hansen M. Transcriptional and epigenetic regulation of autophagy in aging. Autophagy. 2015;11((6)):867–80. doi: 10.1080/15548627.2015.1034410. [DOI] [PMC free article] [PubMed] [Google Scholar]


