Abstract
The signal enhancement provided by the hyperpolarization of nuclear spins of biological molecules is a highly promising technique for diagnostic imaging. To date, most 13C‐contrast agents had to be polarized in an extra, complex or cost intensive polarizer. Recently, the in situ hyperpolarization of a 13C contrast agent to >20 % was demonstrated without a polarizer but within the bore of an MRI system. This approach addresses some of the challenges of MRI with hyperpolarized tracers, i. e. elevated cost, long production times, and loss of polarization during transfer to the detection site. Here, we demonstrate the first hyperpolarization of a biomolecule in aqueous solution in the bore of an MRI at field strength of 7 T within seconds. The 13C nucleus of 1‐13C, 2,3‐2H2‐succinate was polarized to 11 % corresponding to a signal enhancement of approximately 18.000. Interesting effects during the process of the hydrogenation reaction which lead to a significant loss of polarization have been observed.
Keywords: nuclear magnetic resonance, hyperpolarization, parahydrogen, biomolecules, succinate derivatives
Like spinning plates: The first hyperpolarization of a biomolecule in aqueous solution in the bore of an MRI at field strength of 7 T within seconds has been reported. The 13C nucleus of 1‐13C, 2,3‐2H2‐succinate was polarized to 11 % corresponding to a signal enhancement of approximately 18.000.

1. Introduction
Magnetic Resonance Imaging (MRI) and spectroscopy (MRS) are powerful tools in clinical routine and diagnosis. However, clinical MRI is limited to proton (1H) imaging due to the low natural abundance and low thermal polarization of other nuclei. In fact, even for 1H, no more than a few parts per million of all spins effectively contribute to the MR signal in a field of 1 T. The low proton polarization (P≈10−6) is partially compensated by the high proton concentration in living tissues, ∼80 M, mostly water and lipids. Along with sophisticated imaging methods and hardware, a sufficient signal to noise ratio (SNR) is obtained that enables anatomical, functional and dynamical proton imaging in vivo.1, 2, 3
For other (X−) nuclei, like 13C, 15N or 17O, the situation is different: their polarization, concentration and natural abundance are (much) lower than for 1H. As a result, the SNR is not sufficient for fast imaging, and spatial and temporal resolutions are poor. If imaging is feasible, long measurement times are required4, 5, 6 (e. g. 30 minutes acquisition time for 17O brain MRI at 3 T with 300 averages, 5.6 mm isotropic resolution and an SNR of 36).7
The hyperpolarization of nuclear spins is a promising method to boost the MR signal of any MR active nucleus by several orders of magnitude. The most prominent method, dissolution Dynamic Nuclear Polarization (d‐DNP),8 is commercially available and is extensively applied in vivo with great promise.9, 10, 11, 12 At the same time, the method is inherently expensive, relatively slow and requires an external polarizer. Another approach, ParaHydrogen Induced Polarization (PHIP13, 14, 15), is much less costly and much faster, but less developed with respect to in vivo application. PHIP is based on the spin order of parahydrogen (pH2), the spin singlet isomer of dihydrogen. Bowers and Weitekamp suggested transferring singlet spin order into strongly enhanced magnetization after hydrogenation (Parahydrogen and Synthesis Allow Dramatically Enhanced Nuclear Alignment, PASADENA)15 in the 1980s. Various stand‐alone PASADENA polarizers were developed to transfer the pH2 spin order into observable polarization at low magnetic field (nT – mT range) since 2004.16, 17, 18, 19, 20, 21, 22, 23, 24, 25, 26 Both d‐DNP and PHIP require a stand‐alone polarizer and transfer of the polarized substrate to the Nuclear Magnetic Resonance (NMR) spectrometer or MRI system. Hence, relaxation during transfer decreases the available level of spin polarization.
Recently, Synthesis Amid the Magnet Bore Allows Dramatically Enhanced Nuclear Alignment (SAMBADENA)27 was presented, where the hydrogenation, polarization transfer, and detection of the hyperpolarized signal takes place within seconds in the bore of an MRI system. So far, a xenobiotic 13C‐tracer, 1‐13C, 2,3,3‐2H3‐hydroxyethyl‐propionate (HEP), was polarized by SAMBADENA to a 13C polarization of ∼21 % within seconds, and applied for ex vivo 27 and in vivo 28 imaging. In this article, we present the SAMBADENA hyperpolarization of the biomolecule 1‐13C, 2,3‐2H2‐succinate (SUC) to ∼11 % in the magnet bore of a preclinical MRI system at a field strength of 7 T. Succinate is an intermediate in the tricarboxylic acid (TCA) cycle and may be used for the diagnosis of brain cancer.29, 30, 31 New insights into the spin chemistry of the hydrogenation reaction and singlet‐triplet mixing were gained, which have a strong impact on the singlet spin order and thus polarization.
Methods
Spin Order Transfer Sequences
Various field cycling16, 25, 32 or spin order transfer (SOT) sequences33, 34, 35, 36, 37, 38, 39, 40, 41 were described to transfer spin order from pH2 into detectable magnetization of a nearby spin‐ target nucleus (X) after hydrogenation. These SOT sequences consist of a train of appropriate radio frequency pulses on 1H and the target nucleus X interleaved by free evolution intervals (Figure 1). Polarization transfer is achieved via the scalar spin‐spin interaction (J‐coupling) network.
Figure 1.
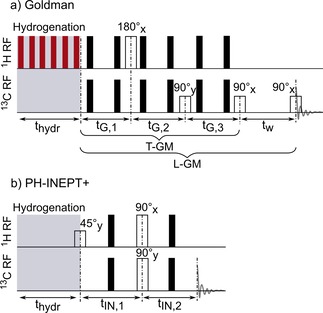
Pulse sequences used for the hyperpolarization of SUC after hydrogenation. Goldman's sequence (a) and PH‐INEPT+ (b) are depicted as described in the original publications.33, 34 Black bars denote 180°x echo pulses. The sequence reported by Goldman et. al. was designed to act on the full singlet spin order (I1⋅I2), and thus heteronuclear decoupling (indicated by red bars) on the 1H channel was applied during hydrogenation (here, MLEV1642). Contrary, PH‐INEPT+ was designed for longitudinal spin order l1zl2z. Therefore, no decoupling was applied so that longitudinal spin order I1zI2z prevailed after the hydrogenation.
SOT Sequences for Weakly Coupled Protons
The sequences PH‐INEPT+33 (Figure 1b) and Efficient Spin Order Transfer To Heteronuclei via Relayed INEPT Chains (ESOTHERIC)40 were designed for systems with weakly coupled protons to transfer longitudinal double spin order into polarization of the target nuclei. Here, double spin order takes the form I1zI2z, where Ii,z indicates the longitudinal spin operator of the ith proton.
In the original contributions,33, 40 it was assumed that, during the hydrogenation, the transversal I1xI2x‐ and I1yI2y‐components of the singlet order are lost because of incoherent free evolution, and that only I1zI2z order survives.33, 40 This is largely valid for ABX‐spin systems (two chemically non‐equivalent hydrogens A and B and one carbon X), where the protons are weakly coupled (i. e. where the chemical shift difference, Δν12, between the protons A and B is much larger than their mutual proton‐proton J‐coupling, J12; Δν12≫J12).
SOT Sequences for Strongly Coupled Protons
On the other hand, there is another class of SOT sequences designed to transfer polarization in systems with strongly coupled or chemically equivalent protons, e. g. in AA′X spin systems.34, 35, 36, 37, 38, 39, 41 In these systems, the chemical shift difference between the protons A and A′ is much smaller than the coupling (Δν12≪J12) or equal to zero. Goldman's sequence34 (Figure 1a) was designed to transfer the full singlet order I1⋅I2 of pH2 into magnetization in AA′X spin systems (two chemically but not magnetically equivalent hydrogens and one carbon). Decoupling during the hydrogenation was suggested to reduce the loss of spin order arising from JAX and JA'X interactions. Here, we denote the full Goldman sequence by “L‐GM”. L‐GM generates longitudinal magnetization, which is read out after a period tw by another pulse‐acquisition experiment. The sequence without the last pulse (after the 3rd free evolution interval) is denoted by “T‐GM” (see Figure 1a). In this case, transversal magnetization is generated and directly recorded.
Simulations
Hamiltonian
Quantum mechanical simulations were performed to predict optimal SOT parameters and the theoretical polarization yield using the density matrix formalism and a custom written simulation tool (MatLab 2015b, MathWorks, USA). The double deuterated SUC used here was approximated as a three spin‐ system (two protons and one carbon). The deuterium nuclei and couplings were neglected because the 1H‐1H‐ and 1H‐13C‐coupling are much stronger than 2H‐1H and 2H‐13C couplings. This, of course, is a simplification. Note that the chemical shifts of the protons added during the hydrogenation (fumarate to succinate) are identical due to the symmetry of the molecule. The system was driven by the isotropic, liquid‐state Hamiltonian, which reads in the laboratory frame of reference as:
| (1) |
| (2) |
I1, I2 and S are the spin operators of two protons and one carbon, respectively. The 1H and 13C Larmor frequencies are indicated by νI and νS; Ik,z and Sz denote the longitudinal spin operators of the protons and 13C, respectively. Ikx and Iky (k=1 or 2) are transversal proton spin operators. The J‐couplings of SUC were taken from literature43, 44 as J12=7.41 Hz, J1S=5.82 Hz and J2S=−7.15 Hz for pH=2.9. Strong proton‐proton (I1 ⋅ I2) and weak proton‐carbon J‐couplings (IkzSz with k=1 or 2) were assumed.
Density Matrix, Hydrogenation and Singlet‐Triplet Mixing
The density matrix of two protons in singlet state reads34
| (3) |
In a naive model, the system after hydrogenation with pH2 is described by the direct product of the protons and the target nucleus 13C in thermal equilibrium (Eq. (4):
| (4) |
The thermal polarization of 13C was assumed to be zero, i. e. is a normalized unity matrix with diagonal matrix elements of the value 0.5 and zero off‐diagonal elements.
For a more realistic picture, the process of hydrogenation was considered: as the reaction takes place over a finite period of time, each hydrogenated molecule experiences a different evolution time. This condition is approximated by calculating a time‐averaged density matrix
| (5) |
where p(t) is a weighting function that reflects the amount of hydrogenated molecules at different points in time. The hydrogenation time t hydr was set to 5 s and Δt=0.001 s is the time increment of the calculations. N is an integer number from 1 to 5000. q t is an operator that either describes the evolution under heteronuclear decoupling (MLEV1642) or periods of free evolution. During the hydrogenation reaction (5 s), 100 complete MLEV16‐cycles were executed. The length of a single 90° excitation pulse was t MLEV,90°=781 μs.
Note that if Qt is set to free evolution, the numerical results obtained are equivalent to the analytical expression derived by Natterer et al.45 (Eq. 6:
| (6) |
This expression is independent of the weighting function p(t). Furthermore, singlet‐triplet (S‐T0) mixing may occur due to the formation of reaction intermediates at the catalyst. Hence, the time‐averaged density matrix is modified to (Eq. (7):45
| (7) |
The mixing parameter λ takes real values from −1 to +1 and depends on the contact time with the catalyst and chemical shift difference of the two protons in the intermediate state during hydrogenation. For λ=1 or λ=−1, a pure time‐averaged singlet or triplet state is obtained, respectively. By assuming S‐T0 mixing and heteronuclear decoupling during hydrogenation, i. e. J1S→0 and J2S→0, the density matrix takes the form
| (8) |
Hence, the quantum state after hydrogenation along with heteronuclear decoupling is determined by the parameter λ only.
Simulations of Pulse Sequences and NMR Spectra
To simulate the effect of decoupling and SOT sequences, rotation and time evolution operators were applied to the density matrix as described elsewhere.46
Pulses of duration t p were approximated by an instantaneous rotation and subsequent time evolution of duration t p. For the SOT sequence, we used ideal rotations and neglected other effects like relaxation and imperfection of RF pulses. Thus, most observed effects can be attributed to the processes during the hydrogenation. The duration of the free‐evolution intervals in the SOT sequences were obtained by analytical expressions43 and numerical optimization (MatLab 2015b, MathWorks, USA).
The theoretical polarization (in percentage) was obtained by taking the trace over the matrix product of the final density matrix after SOT and the polarization operator and subsequent multiplication by 100. The normalized polarization operators are given by 2Sz or 2(Sx+iSy) for longitudinal or transversal polarization, respectively.
1H‐NMR spectra were obtained by simulating the free induction decay (FID). 2000 expectation values of the transversal magnetization ) of the protons, interleaved by a 12.5 ms interval of free evolution, were calculated. 2000 zeros were added at the end of the data, resulting in a total data vector of 4000 complex values of 50 s. A mono‐exponential decay function with a decay constant of T2*=0.1 s was multiplied to the data to simulate transversal relaxation. The final spectrum was obtained by Fourier transformation.
Experiments
Experiments Using an MRI System
MRI System: Experiments were performed using a preclinical small animal 7 T MRI system (Biospec 7/20, PV5.1, Bruker, Germany) and a dual channel 1H/13C volume resonator (Rapid Biomed, Germany) with 7.2 cm inner diameter and 10 cm length of the coil. For tuning and matching of the coil, the reactor (which was used for hyperpolarization experiments) was filled with 1 mL of H2O and placed in the isocenter of the MRI system. Subsequently, the field homogeneity was adjusted by an automatic first order shimming routine, yielding a line width of the H2O resonance of ≈20–30 Hz. The 1H and 13C centre frequencies were set to 2.7 ppm and ≈176 ppm with regard to the 1H resonance of H2O at 4.7 ppm. and the 13C resonance of 1‐13C sodium acetate at ≈182 ppm (c=8.02 mmol in aqueous solution, CAS: 23424‐28‐4, Sigma Aldrich, USA).
1H heteronuclear decoupling was played out during hydrogenation and data acquisition. The pulse length of a 90° excitation in the decoupling scheme is denoted by t MLEV,90°. The amplitude and frequency (centered at 2.7 ppm) of the decoupling sequence MLEV1642 was varied. The same parameters were used for decoupling during hydrogenation and data acquisition (676 ms acquisition time and 330 μs dwell time for 13C).
p H2 Enrichment: The pH2 fraction of H2 gas (99.999 % purity, Sauerstoffwerk Friedrichshafen GmbH, Germany) was enriched to ∼90 % at 21 K using a custom made pH2 converter.47 The gas was stored in 0.5 L aluminium or 2.7 L steel bottles at 40 to 50 bars and used within several hours.
Sample Preparation: 1‐13C,2,3‐2H2‐succinate was formed by hydrogenation of 1‐13C,2,3‐2H2‐fumarate (FUM, MW 118.08 g ⋅ mol−1, CAS: 24461–32‐3, Cambridge Isotope Laboratories, MA, USA) using a rhodium based water soluble catalyst as described previously:27 1,4‐bis‐[(phenyl‐3‐propane sulfonate) phosphine] butane disodium salt (Q36333, MW 562.5 g ⋅ mol−1, Sigma Aldrich, MO, USA) with a rhodium complex (bis(norbornadiene)rhodium (I) tetrafluoroborate, MW 373.99 g mol−1, CAS: 36620‐11‐8, StremChemicals, MA, USA) in degassed and deionized H2O (Figure 2). All chemicals were used without further purification.
Figure 2.

Schematic view of the hydrogenation reaction of FUM to SUC. pH2 is added to FUM via a Rh‐catalyst at 90 °C and 20 bar. After hydrogenation, spin order is transferred from pH2 into 13C‐magnetization by means of pulse sequences and the J‐coupling network. Note that the protons do not reveal a chemical shift difference.
To achieve a high hydrogenation temperature and to avoid a temperature‐driven degeneration of the catalyst at the same time, two solutions were prepared: a highly concentrated catalyst “stock” solution which was kept at room temperature (crhodium=20 mM, cligand=22 mM), and a precursor solution that was heated to ∼90 °C. Only shortly before the experiment, both solution were mixed.
The precursor solution was prepared by dissolving FUM in an aqueous phosphate‐buffer solution (5 mM FUM, 40 mM potassium dihydrogen phosphate KH2PO4, CAS: 7778‐77‐0; and 11 mM phosphoric acid H3PO4, CAS: 7664‐38‐2). The resulting pH value before hydrogenation was 2.9 (pH meter: HI 83141, Hanna instruments, USA)
Experimental Setup: A detailed description of the basic setup and experimental routine was published before.27 Here two different fluidic setups 1 and 2 (Figure 3) were used for experiments on the MRI system.
Figure 3.
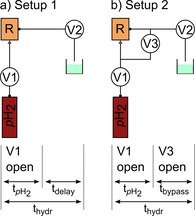
Setups (top) and time tables (bottom) used for SAMBADENA. Setup 1: The pH2 reservoir was connected to the inlet of the reaction chamber (R). Valve V1 was opened for a period of t pH2 to initialize the chemical reaction. The SOT sequences were executed after an additional delay (t delay), resulting in a total hydrogenation time t hydr. After detection of the hyperpolarized signal, valve V2 was opened to clear the system. Setup 2: In addition to setup 1, a bypass was installed to equalize the pressure after t pH2, reducing the bubbling. V3 was opened after t pH2 for time duration t bypass.
For setup 1 (Figure 3a), the pH2 bottle was connected to the inlet at the bottom of the reactor (made from Polysulfone (PSU 1000), 2 mL inner volume) via a pressure regulator, a valve (V1, type 0124, Bürkert, Germany) and PTFE (polytetrafluoroethylene) capillaries (dimensions: outer diameter 1/8’’ and inner diameter 1/16’’, SCP GmbH, Germany). The outlet tube (PTFE) of the reactor (1/16’’×0.75 mm, SCP GmbH, Germany) was connected to a second valve (V2), used to release pressure after the experiment. For setup 2 (Figure 3b), an extra tube was added, connecting inlet and outlet via a third valve (V3). This modification was used to equilibrate the pressure between the inlet and outlet of the reactor after hydrogenation. This way, foaming was reduced, field homogeneity was improved, and less solution was flushed out of the reactor.
Experimental Workflow: Prior to each experiment, the reactor and precursor‐buffer solution (900 μL) were placed in boiling water (∼100 °C) for minimum two minutes. Shortly before the experiment, the precursor‐buffer solution (900 μL) and concentrated catalyst solution (100 μL) were filled into the reactor. The reactor was closed and placed in the isocenter of the MRI. Next, hydrogenation was started by opening V1 for t pH2=2 s.
Using setup 1, a waiting period t delay=3 s was added after t pH2 before the SOT sequence was applied. Using setup 2, the bypass (V3) was opened for t bypass=3 s after t pH2 to equalize the pressure on in‐ and outlet before the SOT was applied. Thus, the total hydrogenation time was t hydr=5 s in both cases.
The valves were controlled by a custom‐written software tool (MatLab 2015b, MathWorks, USA) and a data acquisition board (DAQ 6125, National Instruments, USA) connected to a power relay.
Several different combinations of setups, parameters and SOT sequences were investigated (experiments E1–E6, Table 1). Experiment E5 was repeated 14 times to determine the reproducibility of the polarization method. On consecutive measurement days, substrate and pH2 was freshly prepared. The 13C hyperpolarization yield was quantified by comparing the hyperpolarized signal to a thermally polarized reference (≈7 mL acetone, at natural abundance, ≈0.1 mol 13C). See supplementary information for more details.
Table 1.
Performed experiments on the MRI system. Experiments E1 to E6 were conducted with different SOT sequences, two different setups and decoupling parameters. For all experiments, the timings were chosen as t pH2=2 s and t delay=3 s or tbypass=3 s for setup 1 and setup 2, respectively. MLEV16 decoupling was applied during data acquisition.
|
|
Experiments Using an NMR Spectrometer
NMR System and Experimental Setup: Experiments were performed on an NMR spectrometer (Avance III HD 300 MHz, Bruker, Germany) using a dual‐channel 1H/broad band probe head (5 mm PA BBO 300S1 BBF‐H‐D‐05‐Z) at a magnetic field of 7 T. The setup follows an idea similar to a setup described before48 (denoted by setup 3).
p H2 Enrichment: The pH2 fraction was enriched to ∼90 % using a commercial pH2 converter (BPHG90, Bruker, Germany) at 36 K. The generator was used with a pH2 pressure in the outlet path of ∼9.2 bar.
Sample Preparation: SUC was formed by catalytic hydrogenation (same catalyst as already described) in the magnet bore of the NMR spectrometer at 66 °C in‐bore temperature. In contrast to experiments on the preclinical MRI system, a different buffer solution was used: 0.04 g anhydrous sodium acetate (CAS: 127‐09‐3, Sigma Aldrich) was dissolved in 8.4 mL D2O and about 1.55 mL glacial acetic acid (CAS: 64‐19‐7, Sigma Aldrich) was added to adjust the pH to 2.9 (HI 9124, Hanna instruments, USA). Subsequently, the solution was diluted to 9 mL with D2O. The pH value remained at 2.9.
Experimental Workflow: Nine parts of buffer solution and one part (30 μL) of catalyst‐substrate solution were filled into an NMR tube (total ≈300 μL solution, pH 2.9) and placed in the bore heated to 66 °C.
After manual shimming and matching, pH2 was injected for t pH2=10 s via tubing connection to the pH2 converter. Subsequently, the bypass was opened for t bypass=5 s, resulting in a total hydrogenation time of t hydr=15 s. PASADENA experiments with 45° 1H excitation were performed (experiment E7).
2. Results
2.1. Hyperpolarization of Succinate
The values of the free evolution intervals that give optimal polarization for PH‐INEPT+ and Goldman's sequence were simulated (Figure 1; Table 2) and are in agreement with previously reported simulations.43 Using PH‐INEPT+ and setup 1, SUC was polarized to P=(1.20±0.15) % in a total number of three experiments with identical parameters (E1). Note, however, that 1‐13C,2,3,3‐2H3‐hydroxyethyl‐propionate (HEP), an ABX‐spin system, was polarized to ≈21 % by SAMBADENA in a previous report using the same setup 1 and PH‐INEPT+.27
Table 2.
Parameters and simulated polarization yield. The polarization level for SUC was determined for Goldman's sequence and PH‐INEPT+ (Figure 1) depending on the state of the spin system after hydrogenation and before the SOT. Either a pure (with decoupling) or time‐averaged singlet state (without heteronuclear decoupling during hydrogenation) was assumed. The total duration of SOT (tSOT) is the sum of all the free evolution intervals. For the SOTs, on‐resonant pulses, ideal flip angles were used and relaxation was neglected.
|
|
When T‐GM and decoupling (t MLEV,90°=700 μs; Figure 4) were used for SUC in setup 2, the polarization drastically increased to P=(10.8±0.6) %. Note that decoupling pulses were only applied during t bypass, i. e. after bubbling with pH2. The polarization was strongly dependent on the amplitude of the decoupling B 1 field (Figure 5): For short and long t MLEV,90°, the polarization dropped significantly, likely because the transmit coil failed at high pulse power (short t MLEV,90°) and because the excitation band width was too narrow when excitation pulses were long. Moreover, the polarization significantly decreased when off‐resonant MLEV16 pulses were played out (Figure 6).
Figure 4.
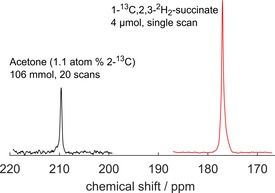
High SUC 13C polarization >10 % was achieved using SAMBADENA and T‐GM (Figure 1). Non‐localized 13C MR spectra of hyperpolarized SUC (176 ppm) and a thermally polarized acetone reference at natural abundance (210 ppm) were acquired at 7 T. For SAMBADENA, 1H decoupling was applied during tbypass and data acquisition (t MLEV,90°=700 μs). With respect to the thermal reference, the maximal observed polarization was quantified to 11.9 %, corresponding to a signal enhancement at 7 T of ≈20.000. Experimental details: setup 2, E4.
Figure 5.
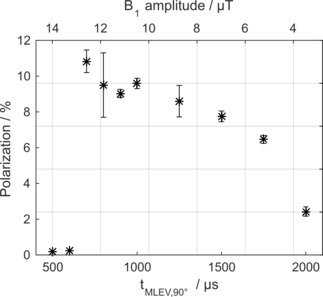
13C polarization of SUC by T‐GM (Figure 1a) as a function of on‐resonant decoupling pulses. A maximum polarization was observed for t MLEV,90°=700 μs. For shorter pulses, much lower signal was observed. For each t MLEV,90°>600 μs, three experiments were performed, for each tMLEV,90°≤600 μs, one. On the upper horizontal axis, the amplitude of the excitation field is given. Mean and standard deviation of the polarization are shown. Experimental details: setup 2, E4.
Figure 6.
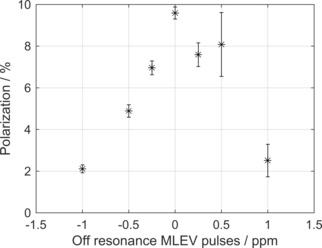
13C‐polarization of SUC by T‐GM (Figure 1a) as a function of the relative frequency offset of the decoupling pulses. Polarization decreased significantly when the frequency of the MLEV16 pulses was changed with respect to the center frequency of 2.7 ppm. For ±1 ppm off‐resonance, polarization dropped from 9.5 % to ∼2 %. Note that the 1H and 13C pulses of the SOT sequence (T‐GM) were always on resonant. Each data point shows the mean value and standard deviation of the polarization of three experiments. Note that the band width of 180° pulse is 640 Hz (2.1 ppm). Experimental details: setup 2, E4.
The polarization detected by a 90°‐pulse acquisition after the application of the original Goldman SOT sequence (L‐GM; Figure 1) and a one second waiting period (t w=1 s) was P=(6.5±1.7) %, obtained in 14 experiments on four days with setup 2 (Figure 7). This polarization is lower than that obtained by T‐GM and only partially explained by relaxation during t w, erroneous flip angles and reduced decoupling power (t MLEV,90°=1 ms).
Figure 7.
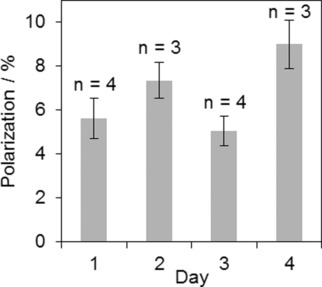
Reproducibility of 13C polarization of SUC by L‐GM (Figure 1). A mean polarization of (6.5±1.7) % was obtained in 14 experiments on four days, detected one second after the SOT by a 90° acquisition. Decoupling pulse duration was set to t MLEV,90°=1 ms and setup 2 was used. Error bars correspond to the standard deviation of n measurements of the respective day. Experimental details: E5.
If decoupling was applied during the entire hydrogenation time (t pH2 and t delay; E3) prior to SOT, a much lower (≤1 %) and strongly varying polarization was recorded for Goldman's sequence (L‐GM; Figure 1) and setup 1. In this case, the polarization was independent of the amplitude of the MLEV16 decoupling field, i.e t MLEV,90°. The polarization increased to (1.2±0.8) % when decoupling was turned off entirely (six experiments, E2). Using setup 2, a polarization yield of (2.4±0.2) % was obtained when decoupling was applied during the entire hydrogenation reaction (E6).
2.2. The Hydrogenation Reaction and the Effect of Decoupling
Simulations predict close to unity polarization (99 %) for Goldman's sequence (Table 2). Experimentally, however, mean polarization levels of ≈11 % were observed (E4). To investigate the reason for the reduced polarization, the density matrix after hydrogenation with pH2 was analyzed for three settings: a) a single molecule without heteronuclear decoupling, b) ensemble of 5000 molecules without decoupling, and c) ensemble of 5000 molecules with decoupling (Figure 8).
Figure 8.
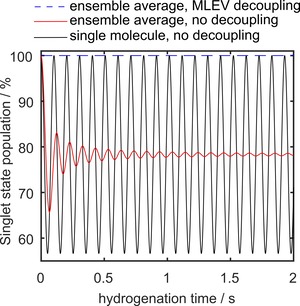
Simulated evolution of the singlet state population in SUC after addition of pH2. For a single molecule, oscillations due to scalar interaction were observed (black line). These oscillations were damped to a constant value after ≈1.5 seconds if an ensemble of spins was considered that was hydrogenated at different points in time (red line). When heteronuclear decoupling pulses were applied to the ensemble, full singlet order was retained (blue dashed line). S‐T0 mixing was not considered here.
With HC‐coupling intact, the population of the singlet state of the density matrix (Eq. 4) of a single molecule showed strong oscillations (Figure 8, black line). When an ensemble of spins was considered (Eq. 5, 6), these oscillations were damped to a quasi‐constant singlet population of 78.4 % after 1.5 s (Figure 8, red). The amplitude of the oscillations and the final value of singlet state population for infinite hydrogenation time depend on the J‐coupling network of the spin system. Starting from this density matrix, a 13C polarization of 56 % and 5.8 % was predicted for Goldman's sequence and PH‐INEPT+, respectively (Table 1). When decoupling pulses (Eq. 5) were added, the full singlet order was preserved (Figure 8, blue dashed line). Here, a polarization yield of 99 % was predicted for Goldman's sequence (Table 2). No polarization was found for PH‐INEPT+.
These results indicate that decoupling and thus preservation of full singlet order has a strong impact on the polarization (e. g. drop of polarization from P=99 % to 56 %). However, this polarization loss does not entirely explain the experimentally observed values (P≈11 %), where decoupling was applied for the last 3 of 5 s of the hydrogenation, implying a theoretical polarization of (weighted sum).
2.3. The Effect of S‐T0 Mixing on the Polarization Yield
To elucidate the spin state after hydrogenation further, 1H‐PASADENA experiments were performed on an NMR spectrometer and compared to simulations. A 45° 1H‐acquisition (t hydr=15 s) of SUC in D2O revealed a significantly different line shape than was expected for pure time‐averaged singlet state in an AA′X spin system (Figure 9, green and black line; Eq. 5, 6). When S‐T0 mixing was included in the simulations (Eq. 7), the basic features of the experiments were reproduced for λ≊0.1 (Figure 9, red line). The (unknown) S‐T0 mixing factor, λ, was estimated by manually adjusting λ to match the relative intensities of the simulated to the experimental spectra (Figure 9).
Figure 9.
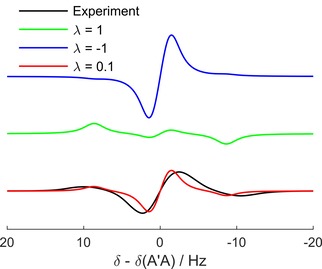
Experimental and theoretical 1H PASADENA spectra (E7). The features of the experimental spectrum (black line) were reproduced by simulations (red line) when the S‐T0 mixing factor λ was set to ∼0.1. Hence, the experimental spectrum is a superposition of time‐averaged singlet (green line, λ=1) and triplet state (blue line, λ=−1).
When S‐T0 mixing was taken into account, the simulated 13C polarization using Goldman's sequence was drastically reduced: for a mixing factor of 0.1 (Figure 9), simulations revealed a polarization of 9.9 % with decoupling (Eq. 8). When the spins were considered to evolve freely for two seconds and for another three seconds under 1H decoupling (similar to experiments in Figure 4, 5 and 6), the polarization yield further decreased to 8.2 %. This simulated polarization corresponds well to the observed values (Table 3).
Table 3.
Experimental and theoretical polarization yield considering S‐T0 mixing. The polarization was simulated assuming different initial spin orders at the onset of SOT (singlet‐triplet mixing without or with decoupling; Eq. 7 or 8). The mixing factor, λ, was set to 0.1. When a weighted sum (reflecting the fact that the spins evolve freely for two seconds and decoupling is applied only for three seconds), the polarization decreased to 8.2 %.
|
|
3. Discussion
To achieve high polarization, it was key using Goldman's sequence for strongly coupled hydrogens and to start the decoupling only after the bubbling of the pH2 injection. The reason for the variations in the inter‐day polarization are unknown, but may be attributed to varying pH2 enrichment, degassing of the solvent and flip angle variations, e. g. because of different matching of the coil. PH‐INEPT+ did not yield high polarization because it was designed to transfer double spin order in weakly coupled ABX systems that is not the case for SUC.
3.1. Sources of Polarization Loss
3.1.1. Initial Spin State and S‐T0 Mixing
1H‐PASADENA experiments strongly indicate a substantial loss of singlet order due to S‐T0 mixing. Thus, the actual state of the density matrix after hydrogenation appears to be significantly different than the ideal one.
A mixing factor of λ=0.1 implies that 45 % of singlet order is lost during hydrogenation, resulting in a 10‐fold reduction of polarization yield in the case of Goldman's sequence. S‐T0 mixing may be reduced by using another catalyst for hydrogenation since the chemical shift difference and contact time may differ. It should be noted that important steps have been made in the last years in developing new biphasic or heterogeneous PHIP catalysts.49, 50, 51, 52, 53
To predict the mixing factor λ by calculations, the values of the chemical shifts and contact time in the reaction intermediate are required. However, the lifetime of the catalyst‐SUC‐pH2‐intermediate is short on the NMR time scale and the relevant values cannot be determined experimentally. Therefore, the phenomenological approach (comparison of experimental with theoretical PASADENA spectra) is the only available option to determine the value of λ.
3.1.2. Injection of pH2 and Decoupling Efficiency
The loss of polarization and poor reproducibility when MLEV16 is applied during bubbling (t pH2) is likely attributed to strong field inhomogeneities, caused by the bubbles, which in turn cause arbitrary excitations and thus depletion of spin order (see supplementary information for details). This hypothesis is supported by the finding that the polarization yield was much reduced when an off‐resonance was added to the MLEV16 pulses on purpose (Figure 6).
Broader radio frequency pulses, i. e. shorter pulses along with a more efficient resonator may further increase the polarization. Moreover, MLEV16 irradiation on the carbon channel may also increase the polarization yield. First, 13C decoupling during bubbling is likely less destructive since susceptibility effects are reduced by a factor of four (gyromagnetic ratio: γH/γC≈4). Second, protons are continuously added to the molecules and are thus not exposed to full 1H‐MLEV16 cycles. By applying 13C‐MLEV16 instead, 13C‐spins always experience complete MLEV16 cycles. However, 1H/2H couplings would remain when using 13C‐MLEV16. This and other heteronuclear decoupling schemes like WALTZ1654 are currently under investigation.
It should be noted that in setup 2, hydrogenation carries on for two seconds without decoupling during t pH2 and time evolution of the spin states occurs during this time.
3.2. Comparision with SOT at low Field
A polarization of (5.4±1.3) % of 1‐13C, 2,3‐1H2‐succinate in H2O was measured before and estimated to a nascent polarization of (12.9±3.1) % after hyperpolarization at low field.17 Similar results were found by Chekmenev et al.: (17.6±1.4) % of 13C spin polarization at the time point of production was reported.44
These values are comparable to those reported in this paper. In these experiments at low field,17, 44 decoupling was applied during the entire hydrogenation reaction prior to the application of Goldman's sequence. The hydrogenation reaction was initialized by spraying FUM in aqueous catalyst solution into a pH2 atmosphere. The much lower field strength (mT instead of 7 T) decreases off‐resonance effects caused by susceptibility differences in the sample volume. Moreover, S‐T0 mixing may vary as well.
4. Conclusion
High and reproducible 13C‐hyperpolarization of the biomolecule SUC ≈11 % was achieved by SAMBADENA within an MRI system. Important insights into the spin order transfer physics at high magnetic field were gained. Pitfalls of the experimental implementation were found, as decoupling during bubbling strongly deteriorates the polarization. Singlet‐Triplet mixing was identified as a likely dominant source of spin order loss. Overall, these results are an important step towards the cost efficient and fast preclinical application of a hyperpolarized biomolecule in vivo. SAMBADENA27 hyperpolarization is particularly interesting in the light of the recently reported in vivo application28 and pH2‐hyperpolarization of metabolic agents like pyruvate and acetate by PHIP‐SAH.25, 40, 55
Conflict of interest
The authors declare no conflict of interest.
Supporting information
As a service to our authors and readers, this journal provides supporting information supplied by the authors. Such materials are peer reviewed and may be re‐organized for online delivery, but are not copy‐edited or typeset. Technical support issues arising from supporting information (other than missing files) should be addressed to the authors.
Supplementary
Acknowledgements
Support by the Emmy Noether Program of the DFG (HO 4604/2‐1, 4604/2‐2), the German Consortium for Translational Cancer Research (DKTK), the Cluster of Excellence “Inflammation at Interfaces” (EXC306), “Precision Medicine in Inflammation” (PMI 1267), a grant of the RFBR and DFG (HO‐4604/3‐1, 19‐53‐12013), the European Union's Horizon 2020 research and innovation programme under the Marie Sklodowska‐Curie grant agreement No 642773 and the Heinrich‐Böll‐Stiftung (ABS, P131623) is gratefully acknowledged. We thank the mechanical workshop of the University Medical Center Freiburg, in particular Waldemar Schimpf for excellent work. Furthermore, we wish to thank Kiel University and the Medical Faculty for supporting the Molecular Imaging North Competence Center (MOIN CC) as core facility for imaging in vivo. MOIN CC was founded by a grant of the European Regional Development Fund (ERDF) and the Zukunftsprogramm Wirtschaft of Schleswig‐Holstein (Project no. 122‐09‐053). We thank Sergey Korchak and Salvatore Mamone for help and advice on the NMR spectrometer.
S. Berner, A. B. Schmidt, M. Zimmermann, A. N. Pravdivtsev, S. Glöggler, J. Hennig, D. von Elverfeldt, J.-B. Hövener, ChemistryOpen 2019, 8, 728.
Contributor Information
Stephan Berner, Email: Stephan.berner@uniklinik-freiburg.de.
Prof. Dr. Jan‐Bernd Hövener, Email: jan.hoevener@rad.uni-kiel.de.
References
- 1. Ludwig U., Eisenbeiss A.-K., Scheifele C., Nelson K., Bock M., Hennig J., v. Elverfeldt D., Herdt O., Flügge T., Hövener J.-B., Sci. Rep. 2016, 6, 23301. [DOI] [PMC free article] [PubMed] [Google Scholar]
- 2. Markl M., Frydrychowicz A., Kozerke S., Hope M., Wieben O., J. Magn. Reson. 2012, 36, 1015–1036. [DOI] [PubMed] [Google Scholar]
- 3. Toutios A., Narayanan S. S., APSIPA Trans Signal Inf Process 2016, 5. [DOI] [PMC free article] [PubMed] [Google Scholar]
- 4. Niesporek S., Niesporek C., Umathum R., Lommen J. M., Behl N. G. R., Paech D., Bachert P., Ladd M. E., Nagel A., Magn. Reson. Med. 2018, 79, 2923–2934. [DOI] [PubMed] [Google Scholar]
- 5. Platt T., Umathum R., Fiedler T. M., Nagel A. M., Bitz A. K., Maier F., Bachert P., Ladd M. E., Wielpütz M. O., Kauczor H.-U., Behl N. G. R., Magn. Reson. Med. 2018, 80, 1005–1019. [DOI] [PubMed] [Google Scholar]
- 6. Nagel A. M., Lehmann-Horn F., Weber M.-A., Jurkat-Rott K., Wolf M. B., Radbruch A., Umathum R., Semmler W., Radiology 2014. , 271, 585–595. [DOI] [PubMed] [Google Scholar]
- 7. Borowiak R., Groebner J., Haas M., Hennig J., Bock M., Magn. Reson. Mater. Phys. Biol. Med. 2014, 27, 95–99. [DOI] [PubMed] [Google Scholar]
- 8. Ardenkjaer-Larsen J. H., Fridlund B., Gram A., Hansson G., Hansson L., Lerche M. H., Servin R., Thaning M., Golman K., Proc. Natl. Acad. Sci. U. S. A. 2003, 100, 10158–10163. [DOI] [PMC free article] [PubMed] [Google Scholar]
- 9. Cunningham C. H., Lau J. Y. C., Chen A. P., Geraghty B. J., Perks W. J., Roifman I., Wright G. A., Connelly K. A., Circ. Res. 2016, 119, 117–1182. [DOI] [PMC free article] [PubMed] [Google Scholar]
- 10. Nelson S. J., Kurhanewicz J., Vigneron D. B., Larson P. E. Z., Harzstark A. L., Ferrone M., v. Criekinge M., Chang J. W., Bok R., Park I., Reed G., Carvajal L., Small E. J., Munster P., Weinberg V. K., Ardenkjaer-Larsen J. H., Chen A. P., Hurd R. E., Odegardstuen Liv-Ingrid, Robb F. J., Tropp J., Murray J. A., Sci. Transl. Med. 2014, 5 . [DOI] [PMC free article] [PubMed] [Google Scholar]
- 11. Aggarwal R., Vigneron D. B., Kurhanewicz J., Eur. Urol. 2017, 72, 1028–1029. [DOI] [PMC free article] [PubMed] [Google Scholar]
- 12. Wespi P., Steinhauser J., Kwiatkowski G., Kozerke S. S., Magn. Reson. Med. 2018, 80, 1882–1890. [DOI] [PubMed] [Google Scholar]
- 13. Eisenschmid T. C., Kirss R. U., Deutsch P. P., Hommeltoft S. I., Eisenberg R., Bargon J., Lawler R. G., Balch A. L., J. Am. Chem. Soc. 1989, 109, 8089–8091. [Google Scholar]
- 14. Bowers C. R., Weitekamp D. P., Phys. Rev. Lett. 1986. , 57, 2645–2648. [DOI] [PubMed] [Google Scholar]
- 15. Bowers C. R., Weitekamp D. P., J. Am. Chem. Soc. 1987,109,5541-5542. [Google Scholar]
- 16. Jóhannesson H., Axelsson O., Karlsson M., C. R. Phys. 2004, 5, 315–324. [Google Scholar]
- 17. Hövener J.-B., Chekmenev E. Y., Harris K. C., Perman W. H., Tran T. T., Ross B. D., Bhattacharya P. , MAGMA. 2009, 22, 123–134. [DOI] [PMC free article] [PubMed] [Google Scholar]
- 18. Hövener J.-B., Chekmenev E. Y., Harris K. C., Perman W. H., Robertson L. W., Ross B. D., Bhattacharya P., MAGMA. 2009, 22, 111–121. [DOI] [PMC free article] [PubMed] [Google Scholar]
- 19. Kadlecek S., Vahdat V., Nakayama T., Ng D., Emami K., Rizi R., NMR Biomed. 2011, 24, 933–942. [DOI] [PubMed] [Google Scholar]
- 20. Waddell K. W., Coffey A. M., Chekmenev E. Y., J. Am. Chem. Soc. 2011. 133, 97–101. [DOI] [PMC free article] [PubMed] [Google Scholar]
- 21. Agraz J., Grunfeld A., Cunningham K., Li D., Wagner S., J. Magn. Reson. 2013, 235, 77–84. [DOI] [PubMed] [Google Scholar]
- 22. Agraz J., Grunfeld A., Li D., Cunningham K., Willey C., Pozos R., Wagner S., Rev. Sci. Instrum. 2014, 85, 044705. [DOI] [PubMed] [Google Scholar]
- 23. Coffey A. M., Shchepin R., Truong M. L., Wilkens K., Pham W., Chekmenev E. Y., Anal. Chem. 2016, 88, 8279–8288. [DOI] [PMC free article] [PubMed] [Google Scholar]
- 24. Goldman M., Jóhannesson H., Axelsson O., Karlsson M., C. R. Chim. 2006, 9, 357–363. [Google Scholar]
- 25. Reineri F., Boi T., Aime S., Nat. Commun. 2015, 6, 5858. [DOI] [PubMed] [Google Scholar]
- 26. Borowiak R., Schwaderlapp N., Huethe F., Lickert T., Fischer E., Bär S., Hennig J., v. Elverfeldt D., Hövener J.-B., MAGMA 2013, 491–499. [DOI] [PubMed] [Google Scholar]
- 27. Schmidt A. B., Berner S., Schimpf W., Müller C., Lickert T., Schwaderlapp N., Knecht S., Skinner J. G., Dost A., Rovedo P., Hennig J., v. Elverfeldt D., Hövener J.-B., Nat. Commun. 2017, 8, 14535. [DOI] [PMC free article] [PubMed] [Google Scholar]
- 28. Schmidt A. B., Berner S., Braig M., Zimmermann M., Hennig J., v. Elverfeldt D., Hövener J.-B., PLoS One, 2018, 13. [DOI] [PMC free article] [PubMed] [Google Scholar]
- 29. Bhattacharya P., Chekmenev E. Y., Perman W. H., Harris K. C., Lin A. P., Norton V. A., Tan C. T., Ross B. D., Weitekamp D. P., J. Magn. Reson. 2007, 186, 150–155. [DOI] [PMC free article] [PubMed] [Google Scholar]
- 30. Zacharias N. M., McCullough C. R., Wagner S., Sailasuta N., Chan H. R., Lee Y., Hu J., Perman W. H., Henneberg C., Ross B. D., Bhattacharya P., J. Mol. Imaging Dyn. 2016, 6, 1–9. [DOI] [PMC free article] [PubMed] [Google Scholar]
- 31. Billingsley K. L., Josan S., Park J. M., Tee S. S., Spielman-Sun E., Hurd R., Mayer D., Spielman D., NMR Biomed. 2014, 27, 356–362. [DOI] [PMC free article] [PubMed] [Google Scholar]
- 32. Cavallari E., Carrera C., Boi T., Aime S., Reineri F., J. Phys. Chem. B 2015, 119, 10035–10041. [DOI] [PubMed] [Google Scholar]
- 33. Haake M., Natterer J., Bargon J., J. Am. Chem. Soc. 1996, 118, 8688–8691. [Google Scholar]
- 34. Goldman M., Jóhannesson H., C. R. Phys. 2005, 6, 575–581. [Google Scholar]
- 35. Kadlecek S., Emami K., Ishii M., Rizi R., J. Magn. Reson. 2010, 205, 9–13. [DOI] [PMC free article] [PubMed] [Google Scholar]
- 36. Cai C., Coffey A. M., Shchepin R. V., Chekmenev E. Y., Waddell K. W., J. Phys. Chem. B. 2013, 117, 1219–1224. [DOI] [PMC free article] [PubMed] [Google Scholar]
- 37.V. A Norton, PhD thesis, California Institute of Technology, 2010.
- 38. Stevanato G., Eills J., Bengs C., Pileio G., J. Magn. Reson. 2017, 277, 169–178. [DOI] [PubMed] [Google Scholar]
- 39. Stevanato G., J. Magn. Reson. 2017, 274, 148–162. [DOI] [PubMed] [Google Scholar]
- 40. Korchak S., Yang S., Mamone S., Glöggler S., ChemistryOpen, 2018, 7, 344–348. [DOI] [PMC free article] [PubMed] [Google Scholar]
- 41. Eills J., Stevanato G., Bengs C., Glöggler S., Elliott S. J., Alonso-Valdesueiro J., Pileio G., Levitt M. H., J. Magn. Reson. 2017, 274, 163–172. [DOI] [PubMed] [Google Scholar]
- 42. Levitt M. H., Freeman R., Frenkiel R. T., J. Magn. Reson. 1982, 47, 328–330. [Google Scholar]
- 43. Bär S., Lange T., Leibfritz D., Hennig J., v. Elverfeldt D., Hövener J.-B., J. Magn. Reson. 2012, 225, 25–35. [DOI] [PubMed] [Google Scholar]
- 44. Chekmenev E. Y., Hövener J.-B., Norton V. A., Harris K., Batchelder L. S., Bhattacharya P., Ross B. D., Weitekamp D. P., J. Am. Chem. Soc. 2008, 130, 4212–4213. [DOI] [PMC free article] [PubMed] [Google Scholar]
- 45. Natterer J., Schedletzky O., Barkemeyer J., Bargon J., Glaser S. J., J. Magn. Reson. 1998, 133, 92–97. [DOI] [PubMed] [Google Scholar]
- 46. Sørensen O. W., Eich G. W., Levitt M. H., Bodenhausen G., Ernst R. R., Prog. Nucl. Magn. Reson. Spectrosc. 1984, 16, 163–192. [Google Scholar]
- 47. Hövener J.-B., Bär S., Leupold J., Jenne K., Leibfritz D., Hennig J., Duckett S. B., v. Elverfeldt D., NMR Biomed. 2013, 26, 124–131. [DOI] [PubMed] [Google Scholar]
- 48. Kiryutin A. S., Sauer G., Hadjiali S., Yurkovskaya A. V., Breitzke H., Buntkowsky G., J. Magn. Reson. 2017, 285, 26–36. [DOI] [PubMed] [Google Scholar]
- 49. Koptyug I. V., Kovtunov K. V., Burt S. R., Anwar M. S., Hilty C., Han S., Pines A., Sagdeev R. Z., J. Am. Chem. Soc. 2007, 129, 5580–5586. [DOI] [PubMed] [Google Scholar]
- 50. Kovtunov K. V., Beck I. E., Bukhtiyarov V. I., Koptyug I. V., Angew. Chem. Int. Ed. 2008, 47, 1492–1495; [DOI] [PubMed] [Google Scholar]; Angew. Chem. 2008, 120, 1514–1517. [Google Scholar]
- 51. Kovtunov K. V., Zhivonitko V. V., Corma A., Koptyug I. V., J. Phys. Chem. Lett. 2010, 1, 1705–1708. [Google Scholar]
- 52. Glöggler S., Grundfeld A. M., Ertas Y. N., McCormick J., Wagner S., Schlecker P. P., Bouchard L. S., Angew. Chem. Int. Ed. 2015, 54, 2452–2456; [DOI] [PubMed] [Google Scholar]; Angew. Chem. 2015, 127, 2482–2486. [Google Scholar]
- 53. Reineri F., Viale A., Ellena S., Boi T., Daniele V., Gobetto R., Aime S., Angew. Chem. Int. Ed. 2011, 50, 7350–7353; [DOI] [PubMed] [Google Scholar]; Angew. Chem. 2011, 123, 7488–7491. [Google Scholar]
- 54. Shaka A. J., Keeler J., Frenkiel T., Freeman R., J. Magn. Reson. 1983, 52, 335–338. [Google Scholar]
- 55. Cavallari E., Carrera C., Sorge M., Bonne G., Muchir A., Aime S., Reineri F., Sci. Rep. 2018, 8, 8366. [DOI] [PMC free article] [PubMed] [Google Scholar]
Associated Data
This section collects any data citations, data availability statements, or supplementary materials included in this article.
Supplementary Materials
As a service to our authors and readers, this journal provides supporting information supplied by the authors. Such materials are peer reviewed and may be re‐organized for online delivery, but are not copy‐edited or typeset. Technical support issues arising from supporting information (other than missing files) should be addressed to the authors.
Supplementary


