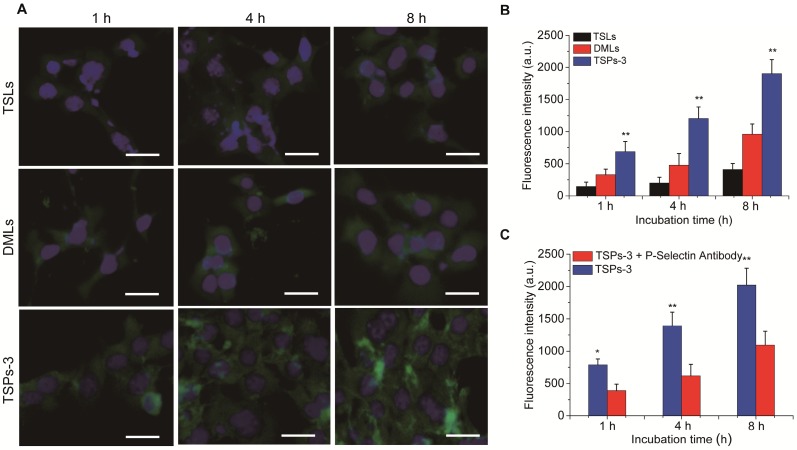
Figure 3.
(A) Intracellular uptake of TopFluor® PC-doped TSLs, DMLs and TSPs-3 at a concentration of 50 μg/mL in HeLa cells after 1, 4 and 8 h of incubation. The scale bar represents 20 μm. (B) Fluorescence intensities of HeLa cells after incubation with TopFluor® PC-doped TSLs, DMLs and TSPs-3 at a concentration of 50 μg/mL for 1, 4 and 8 h. (C) Comparison of the fluorescence intensities of HeLa cells after incubation with TopFluor® PC-doped TSPs-3 and TopFluor® PC-doped TSPs-3 + P-selectin antibody.

