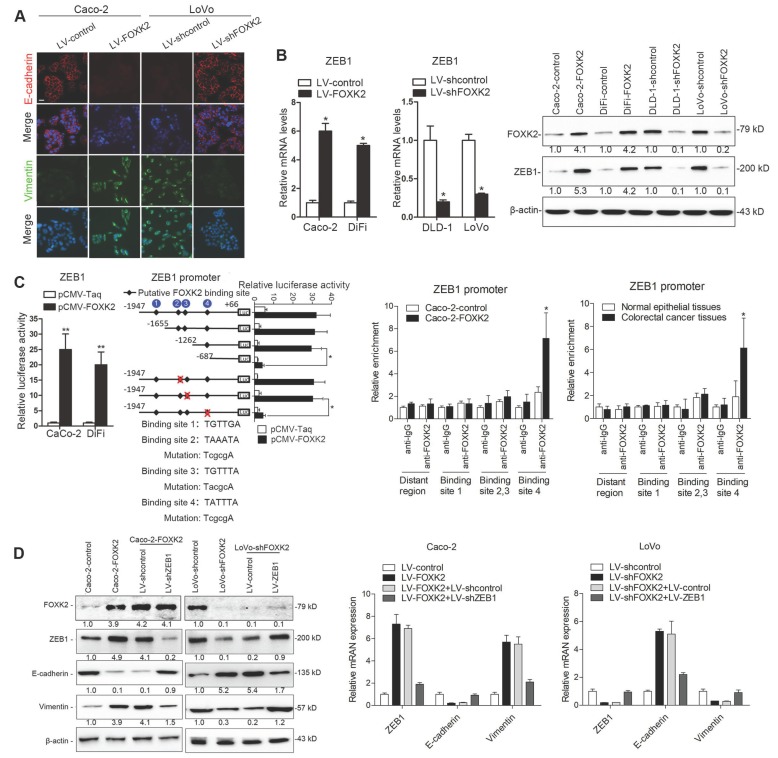
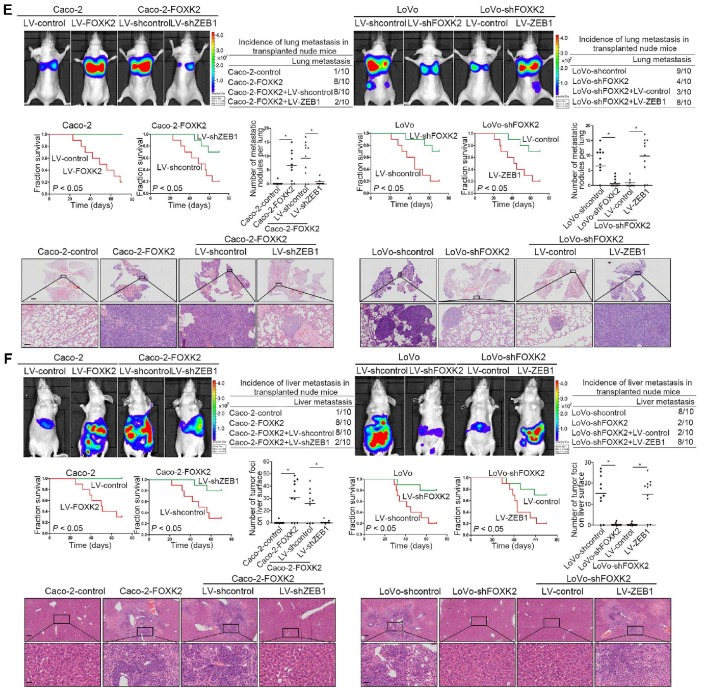
Figure 2.
FOXK2 overexpression induces the EMT by transactivating ZEB1. (A) Immunofluorescence staining of E-cadherin and vimentin. n = 3 independent experiments performed in triplicate. Scale bars: 20 μm. (B) RT-qPCR and Western blotting analysis of FOXK2 and ZEB1 expression in CRC cells. n = 3 independent experiments performed in triplicate. * P < 0.05 compared with the control. The data are presented as the mean±s.d. (C) Luciferase reporter assays of the indicated cells cotransfected with pCMV-FOXK2 and the ZEB1 promoter luciferase construct. ChIP-qPCR assay demonstrated that FOXK2 directly binds to the ZEB1 promoter in human CRC tissues and cells. * P < 0.05; ** P < 0.01 compared with the control. The data are presented as the mean±s.d. (D) Western blotting and RT-qPCR evaluation of the expression of FOXK2, ZEB1, vimentin and E-cadherin in the indicated cells. n = 3 independent experiments performed in triplicate. (E) In vivo lung metastatic assays. Cells were injected into the tail veins of mice (n = 10 mice per group). Bioluminescence imaging 9 weeks after implantation, the incidence of lung metastasis, overall survival times, the number of metastatic lung nodules, and H&E staining of lung tissues from the different groups are shown. Scale bars: top, 500 μm; bottom, 40 μm. * P < 0.05 compared with the control. The data are presented as the mean±s.d. (F) In vivo liver metastasis assays. Cells were injected into the spleens of mice (n = 10 mice per group). Bioluminescence imaging 9 weeks after implantation, the incidence of liver metastasis, overall survival times, the number of metastatic liver nodules, and H&E staining of liver tissues from the different groups are shown. Scale bars: top, 200 μm; bottom, 40 μm. * P < 0.05 compared with the control. The data are presented as the mean±s.d.


