

Abstract
Background
Aneuploidy occurs in more than 20% of acute myeloid leukemia (AML) cases and correlates with an adverse prognosis.
Methods
To understand the molecular bases of aneuploid acute myeloid leukemia (A‐AML), this study examined the genomic profile in 42 A‐AML cases and 35 euploid acute myeloid leukemia (E‐AML) cases.
Results
A‐AML was characterized by increased genomic complexity based on exonic variants (an average of 26 somatic mutations per sample vs 15 for E‐AML). The integration of exome, copy number, and gene expression data revealed alterations in genes involved in DNA repair (eg, SLX4IP, RINT1, HINT1, and ATR) and the cell cycle (eg, MCM2, MCM4, MCM5, MCM7, MCM8, MCM10, UBE2C, USP37, CK2, CK3, CK4, BUB1B, NUSAP1, and E2F) in A‐AML, which was associated with a 3‐gene signature defined by PLK1 and CDC20 upregulation and RAD50 downregulation and with structural or functional silencing of the p53 transcriptional program. Moreover, A‐AML was enriched for alterations in the protein ubiquitination and degradation pathway (eg, increased levels of UHRF1 and UBE2C and decreased UBA3 expression), response to reactive oxygen species, energy metabolism, and biosynthetic processes, which may help in facing the unbalanced protein load. E‐AML was associated with BCOR/BCORL1 mutations and HOX gene overexpression.
Conclusions
These findings indicate that aneuploidy‐related and leukemia‐specific alterations cooperate to tolerate an abnormal chromosome number in AML, and they point to the mitotic and protein degradation machineries as potential therapeutic targets.
Keywords: acute myeloid leukemia, aneuploidy, cell cycle, genomics, mutation, ubiquitination, whole exome sequencing
Short abstract
Aneuploid acute myeloid leukemia (A‐AML) is associated with genomic and transcriptional alterations in the cell cycle and protein degradation pathways. The upregulation of PLK1 and CDC20 and the downregulation of RAD50 and of a p53‐related signature are hallmarks of A‐AML.
Introduction
Aneuploidy originates from defects in chromosome segregation and is detrimental to organism fitness and development.1, 2 At the cellular level, it induces transcriptional reprogramming2, 3, mitotic and proteotoxic stress and metabolic alterations,1, 4, 5 and it impairs proliferation in hematopoietic stem cells, among others.6 As such, aneuploidy per se seems to hamper malignant transformation. However, aneuploidy is a hallmark of cancer.7 More than 20% of acute myeloid leukemia (AML) cases carry a whole‐chromosome trisomy/monosomy either alone or in combination with other cytogenetic abnormalities.8, 9 Chromosome gains and losses are generally preserved from diagnosis to relapse, and this supports their role as disease‐initiating events.10 Moreover, monosomies (eg, −7) and the monosomal karyotype (MK) predict dismal outcomes,9 and isolated trisomies have in some but not all series been associated with an adverse prognosis.8, 11, 12
The study of the genomic determinants of aneuploidy is a very active research field. A number of genes and pathways participate to prevent aneuploidy propagation. Beside TP53, a guardian of ploidy,13 candidate genes are involved in the mitotic checkpoint, DNA damage response, and recombination.14 However, they are rarely mutated in AML, and their deregulated expression in mice can either favor or hamper tumor development according to the presence of threshold levels, the cell type, and the genomic background.15 Recent studies have analyzed the molecular profile of aneuploid acute myeloid leukemia (A‐AML) subsets. Isolated trisomy 13 is associated with RUNX1, ASXL1, BCOR, and spliceosome‐complex mutations, upregulated FOXO1 and FLT3 expression, and downregulated SPRY expression.12, 16 AML with trisomy 8 shows recurrent ASXL1 and RUNX1 mutations17 and deregulation of cell adhesion and apoptosis‐regulating genes.18 CUX1 is a haploinsufficient tumor suppressor in –7/del(7q) cases,19, 20 and monosomy 7 AML displays elevated ID1, MECOM, and PTPRM.21 This evidence suggests that leukemia‐specific and aneuploidy‐related mechanisms may cooperate in the selection of evolved clones able to overcome the unfitness barrier of aneuploidy.
To elucidate the molecular mechanisms associated with A‐AML, we have analyzed the genomic and transcriptomic landscape of A‐AML and euploid acute myeloid leukemia (E‐AML). We show that A‐AML is characterized by genomic complexity and by a cell cycle–related pattern of somatic mutations and copy number (CN) and transcriptomic changes along with alterations in the protein ubiquitination and degradation machinery and downregulation of the p53 transcriptional program.
Materials and Methods
Patients
Samples were obtained from patients with AML after informed consent as approved by the institutional ethics committees (Sant’Orsola‐Malpighi Hospital [protocols 253/2013/O/Tess and 112/2014/U/Tess] and Munich Leukemia Laboratory [an internal board and standard operating procedure EN ISO 15189]) in accordance with the Declaration of Helsinki.
Chromosome Banding Analysis
Karyotypes were examined after G‐banding and were described according to the International System for Human Cytogenomic Nomenclature (2016).
Whole Exome Sequencing (WES) and Identification of Somatic Mutations
Libraries were prepared from matched tumor/germline DNA of 77 patients (TruSeq Exome Enrichment Kit or Nextera Rapid Capture Expanded Kit; Illumina, Inc) according to the manufacturer’s protocol, and 100‐bp paired‐end sequences were generated (Illumina HiSeq1000 or HiScanSQ). Tumor‐specific variants were called by MuTect and VarScan 2. The pipeline was validated with Sanger DNA sequencing and targeted resequencing (Supporting Table 11).
Analysis of WES Data From The Cancer Genome Atlas (TCGA) Data Set
The TCGA data set contains genomic data for 200 adult patients with AML.22 WES and clinical data were downloaded from the Genomic Data Commons data portal (https://gdc.cancer.gov). According to available cytogenetic information, we were able to define 21 TCGA A‐AML cases and 116 TCGA E‐AML cases. Complex karyotype (CK) cases were excluded in the absence of detailed information on chromosome number alterations (monosomy5/del(5q) and monosomy7/del(7q)). The TCGA A‐AML cohort included 11 cases with isolated trisomy (1 case of trisomy 21 and 10 cases of trisomy 8) and 10 cases with CK‐AML.
Copy Number Alteration (CNA) Analysis
A genome‐wide CN analysis was performed with Human CytoScan HD or SNP6.0 arrays (Affymetrix).
Enrichment Analysis
CNA events at the gene level were tested for an association with the aneuploid (A)/euploid (E) condition with the Fisher exact test. An overrepresentation test (based on a hypergeometric distribution) of each pathway was performed at the patient level. P values obtained for a certain pathway across all patients were used as predictor variables in a logistic regression model fitted against the A‐AML/E‐AML classification. Heterozygous and homozygous amplifications were grouped as well as heterozygous and homozygous deletions; multiple events of the same type in the same gene were considered as one. P values were adjusted for multiple testing (false discovery rate < 0.05; 99.9999% confidence interval). An overrepresentation analysis of cytogenetic bands was performed.
Gene Expression Profiling (GEP)
Labeled complementary DNA was prepared and hybridized to GeneChip Human Transcriptome Array 2.0 (Affymetrix) according to the manufacturer’s recommendations.
Results
Genomic Complexity of A‐AML
To investigate the genetic lesions associated with the aneuploid phenotype, we performed WES of 42 A‐AML cases and 35 E‐AML cases (Table 1 and Supporting Table 1). Patients with A‐AML were older (median age, 62 vs 56 years for patients with E‐AML; P = .02), and most of them had an adverse prognosis according to the 2017 European LeukemiaNet recommendations.23
Table 1.
Characteristics of A‐AML and E‐AML Cohorts Analyzed With Whole Exome Sequencing
| Variable | A‐AML (n = 42) | E‐AML (n = 35) | P |
|---|---|---|---|
| Sex, No. (%) | |||
| Male | 20 (47.6) | 14 (40.0) | .645 |
| Female | 22 (52.4) | 21 (60.0) | |
| Age, y | |||
| Median | 62 | 56 | .017 |
| Range | 20‐83 | 18‐80 | |
| Sample type, No. | |||
| Bone marrow | 38 | 34 | .369 |
| Peripheral blood | 4 | 1 | |
| AML, No. (%) | |||
| De novo | 34 (81.0) | 22 (62.9) | .182 |
| t‐AML | 4 (9.5) | 5 (14.3) | |
| Secondary | 4 (9.5) | 8 (22.8) | |
| FAB, No. (%) | |||
| M0‐M1 | 13 (31.0) | 8 (22.9) | .551 |
| M2‐M4 | 12 (28.6) | 15 (42.9) | |
| M5‐M7 | 6 (14.3) | 3 (8.6) | |
| NA | 11 (26.2) | 9 (25.7) | |
| Disease stage, No. | |||
| Diagnosis | 40 | 34 | 1 |
| Relapse | 2 | 1 | |
| Genetic group, No. (%) | |||
| Favorable | 8 (19.0) | 7 (20.0) | <.001 |
| Intermediate | 6 (14.3) | 21 (60.0) | |
| Adverse | 28 (66.7) | 7 (20.0) |
Abbreviations: A‐AML, aneuploid acute myeloid leukemia; AML, acute myeloid leukemia; E‐AML, euploid acute myeloid leukemia; FAB, French‐American‐British; NA, not available; t‐AML, therapy‐related acute myeloid leukemia; y, years; No., number.
Bolded P values are significant.
A‐AML had a significantly higher mutation load with an average number of somatic mutations of 26 (15 for E‐AML; P < .001; Fig. 1A and Supporting Table 2). More than 50% of A‐AML cases displayed 20 or more mutations, whereas 17% of E‐AML cases did (P = .002; Fig. 1B). In silico analysis indicated that 11 and 7 amino acid substitutions on average had an impact on protein function in A‐AML and E‐AML, respectively (P = .008). To validate our results in an independent patient cohort, we analyzed WES data from the TCGA data set. The increased number of mutations in A‐AML was confirmed in the TCGA‐AML data set (16 and 12 mutations in A‐AML and E‐AML, respectively; P = .027); no differences were detected in terms of patients’ ages between the 2 cohorts. To characterize the possible relation between the mutation number and patients’ ages, we performed linear regression analyses in A‐AML and E‐AML separately. We observed a significant age‐related increase in the mutation load only in A‐AML both in our cohort and in the TCGA data set (Supporting Fig. 1). Moreover, no significant difference in the number of somatic mutations was observed between CK–A‐AML and non‐CK–A‐AML cases in both cohorts. Taken together, the data suggest a higher complexity for the A‐AML mutational background.
Figure 1.
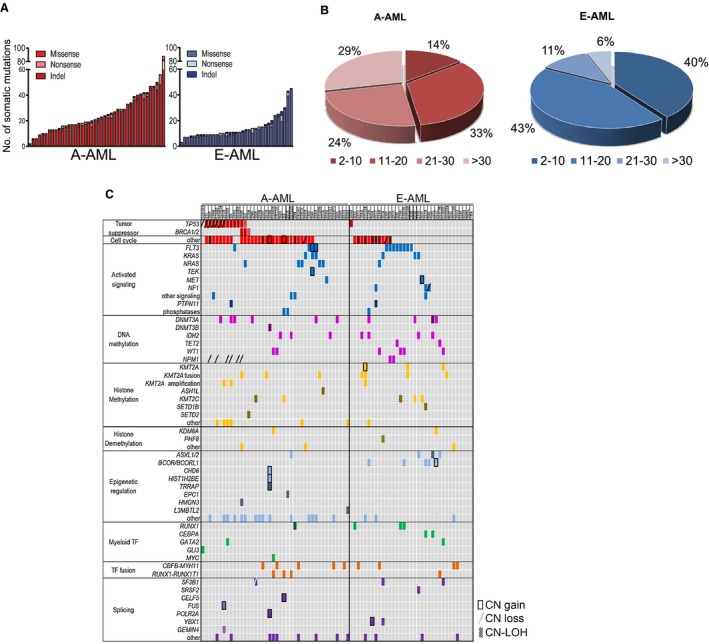
Genomic lesions in A‐AML and E‐AML. (A) Number and type of nonsilent somatic mutations detected by whole exome sequencing. (B) Frequency of A‐AML and E‐AML cases classified according to the number of mutations. (C) Pattern of genomic lesions in A‐AML and E‐AML. Rows denote genes or group of genes (other). Columns represent (from left to right) functional categories (distinguished by colors), mutated genes/groups of genes/other genomic alterations, and single patients. A‐AML indicates aneuploid acute myeloid leukemia; CN, copy number; E‐AML, euploid acute myeloid leukemia; indel, insertion/deletion; LOH, loss of heterozygosity; TF, transcription factor.
Patterns of Gene Mutations in A‐AML and E‐AML
Genes recurrently mutated in A‐AML and E‐AML included DNMT3A, IDH2, KRAS, and FLT3 (Fig. 1C). TP53 was differentially mutated in A‐AML (28.6% vs 2.9% in E‐AML; P = .004), whereas E‐AML was significantly enriched for mutations of BCOR/BCORL1 in our cohort (14.3% vs absent in A‐AML; P = .02) and for mutations of NPM1 in the TCGA cohort (39.7% vs 9.5% in A‐AML; P = .007).
To better investigate the role of the mutated genes in aneuploidy, we compared the percentages of A‐AML and E‐AML cases carrying at least 1 lesion in each functional category (Fig. 2A). Tumor suppressor genes were preferentially mutated in A‐AML (31.0% vs 2.9% in E‐AML; P = .002) along with genes involved in the trafficking of proteins between cellular compartments (50% vs 22.9% in E‐AML; P = .02; Supporting Fig. 2 and Supporting Table 3), ubiquitination (45.2% vs 20% in E‐AML; P = .029; Supporting Fig. 3 and Supporting Table 3), cell adhesion (42.9% vs 11.4% in E‐AML; P = .003; Supporting Fig. 4 and Supporting Table 3), and the cell cycle (69.0% vs 31.4% in E‐AML; P = .001; Fig. 1C and Fig. 2A). Notably, A‐AML was enriched for mutations with a predicted functional impact on ubiquitination (P = .05) and the cell cycle (P = .04).
Figure 2.
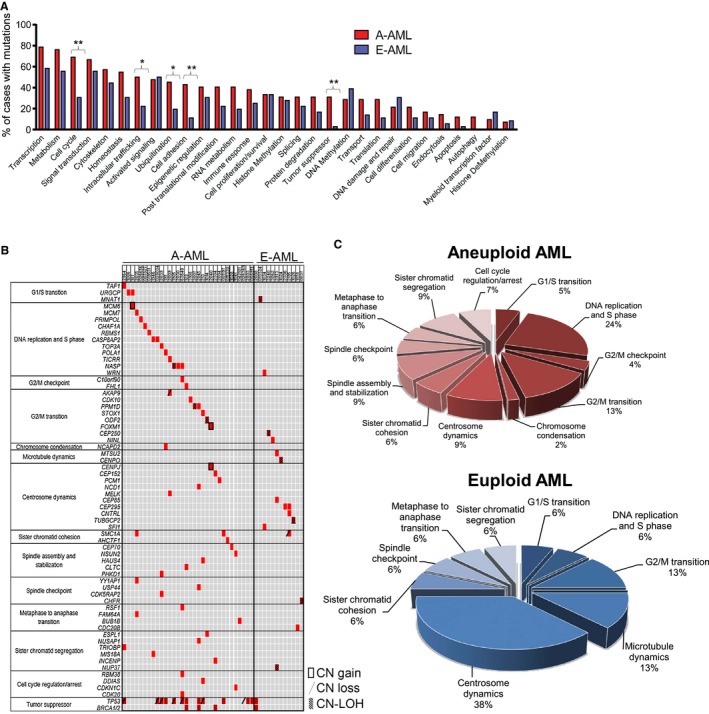
Spectrum of somatic mutation categories distinguishing A‐AML and E‐AML. (A) Frequency of cases carrying mutations according to functional categories. Statistical significance was determined with the Fisher exact test (*P < .05; **P < .01). (B) Distribution of mutations targeting cell cycle–related genes. Each row denotes 1 gene; columns represent (from left to right) cell cycle phases, mutated genes, and single patients. (C) Frequency of mutations according to cell cycle phases. A‐AML indicates aneuploid acute myeloid leukemia; AML, acute myeloid leukemia; CN, copy number; E‐AML, euploid acute myeloid leukemia; LOH, loss of heterozygosity.
Cell cycle–related mutations were enriched in A‐AML independently of karyotypic complexity and were detected in 68.2% of CK–A‐AML cases and in 70.0% of non‐CK–A‐AML cases. They were also enriched in the TCGA A‐AML cohort (P = .04). They were mostly private mutations because alterations in the same gene were not recurrent among patients. In A‐AML, they targeted cell cycle regulators and genes directly involved in cell cycle phases (Fig. 2B), with DNA replication and the S phase, the G2/M transition, spindle and centrosome dynamics, and chromosome segregation being the most frequently mutated (Fig. 2C). Moreover, mutations targeting the same cell cycle phase co‐occurred very rarely. Few cell cycle–related mutations were also detected in E‐AML (Fig. 2C).
These results suggest that deregulated cell cycle functionality and changes in protein balance regulation may sustain aneuploid leukemic cells.
Mutational Signatures in A‐AML and E‐AML
To gain insights into the mutational processes active in A‐AML and E‐AML, we analyzed somatic base substitutions in the 2 cohorts. Both A‐AML and E‐AML showed a preponderance of C>T transitions (37.7% and 39.7% of overall single‐nucleotide variants in A‐AML and E‐AML, respectively), as previously reported,24, 25 and they were followed by C>A transversions (26.0% and 25.1% in A‐AML and E‐AML, respectively).
Mutational signature analysis revealed that 2 signatures contributed to the mutational diversity of our WES cohort (Fig. 3A). Signature 1, which characterized 61.9% of A‐AML cases and 71.4% of E‐AML cases, was dominated by C>T transitions at NpCpG trinucleotides; this mutational process has been linked to spontaneous hydrolytic deamination of 5‐methylcytosines24 and has been correlated with age in many cancer types.26 Signature 2 was characterized by C>A transversions mainly at GpCpN sites and was enriched in 38.1% of A‐AML cases and in 28.6% of E‐AML cases (Fig. 3D). Signature 2 contributed to the genomic complexity of 97.6% of A‐AML cases, whereas 17.1% of E‐AML cases were characterized by signature 1 only (P = .042; Fig. 3D). Signature 2 was associated with an increased disease‐related mutation load (median number of nonsynonymous single‐nucleotide variants: 34.5 and 21 in A‐AML and E‐AML, respectively, with signature 2 enrichment vs 15.5 and 9 in A‐AML and E‐AML, respectively, with signature 1 enrichment; P = .005).
Figure 3.
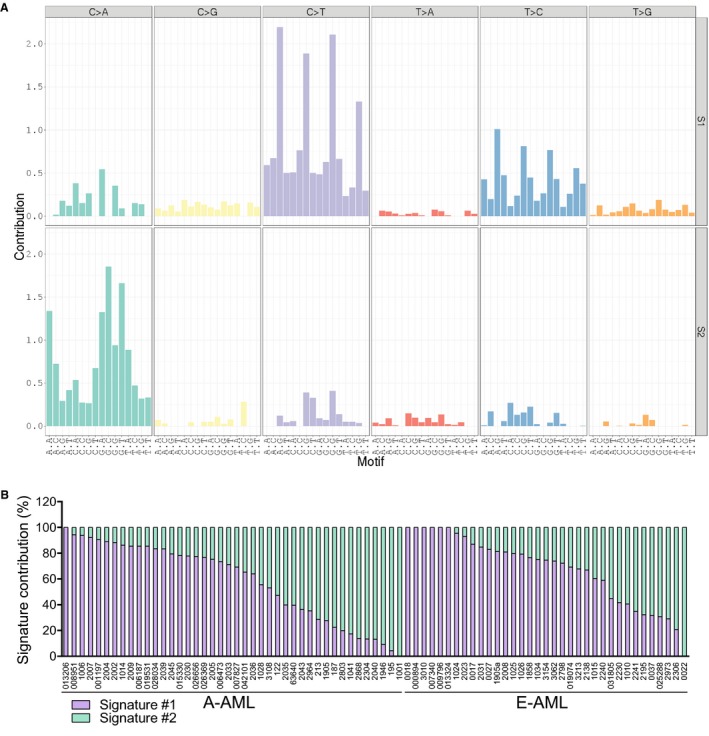
Mutational signatures in A‐AML and E‐AML. (A) Mutational signatures according to the 96‐substitution classification. Mutation types are reported on the horizontal axes with different colors; the percentage of each specific mutation type is represented by vertical axes. (B) Contributions of the identified signatures to the mutational processes. A‐AML indicates aneuploid acute myeloid leukemia; E‐AML, euploid acute myeloid leukemia; S1, Signature #1; S2, Signature #2.
CNAs in A‐AML and E‐AML
Data from single‐nucleotide polymorphism profiling were available for 38 of the 42 patients with A‐AML and for 32 of the 35 patients with E‐AML. When we considered whole‐chromosome and focal CNAs, A‐AML was significantly associated with CN gains affecting the cell cycle; nucleotide biosynthesis; glucose, carbohydrate, and amino acid metabolism; bioenergetics; protein assembly and degradation; response to reactive oxygen species (ROS); stem cell–related pathways; and kinase signaling (Supporting Table 4). No differences occurred between CK–A‐AML and non‐CK–A‐AML cases.
To prioritize CNAs with a putative role in the aneuploid phenotype, we considered events with a significantly different frequency between the 2 cohorts (Fisher exact test) and excluded the events simply caused by whole‐chromosome trisomy and monosomy. The remaining genes defined chromosome cytobands preferentially affected by CNAs in A‐AML (P .05; Supporting Table 5). These included minimal common regions in chromosomes frequently found to be monosomic or trisomic in AML and CNAs in regions rarely targeted by whole‐chromosome gains and losses (eg, a gain at 6p12 and a loss at 11p13), where genes involved in the aneuploid phenotype likely are localized. In particular, a loss of TP53, mapped at 17p13, was detected in 7 A‐AML cases (P = .01), and the remaining allele was mutated in 6 of them. One case had mutated TP53 with a loss of heterozygosity. Moreover, 6 A‐AML cases carried an NPM1 loss at 5q35 (P = .03), whereas NPM1 mutations were detected only in E‐AML (Fig. 1C).
Among the CNAs discriminating A‐AML and E‐AML, we identified 40 genes gained and 23 genes in lost regions with a known role in AML pathogenesis, and we defined hotspots of CN gains localized at 6p22 and CN losses at 5q31 and 12p13 (P < .05; Supporting Table 6). Genes located in the hotspot regions were involved in cell cycle regulation and DNA replication (E2F2, KIF20A, CDKN1B, and PURA), double‐strand break repair (RAD50), chromatin organization (DEK and KDM3B), and regulation of the leukemia stem cell phenotype and differentiation (SOX4, TIFAB, and CTNNA1). For the selected genes, we also computed the frequency of co‐occurring CN events. A‐AML and E‐AML shared the co‐occurrence of a CN loss at 5q with a CN gain of the MYB oncogene or the tyrosine protein kinase JAK2 (Fig. 4A,B), although the frequency of these events was higher in A‐AML. Moreover, in A‐AML, a loss at 5q co‐occurred with a gain of MYC or 8q or a TP53 loss, as previously reported,27 with a loss of CDKN1B and the hematopoietic gene ETV6 (chromosome 12), and with a CN gain of the regulators of hematopoiesis RUNX1 and ERG (chromosome 21), which frequently co‐occurred (Fig. 4B).
Figure 4.

Frequency and co‐occurrence of CNAs in leukemia‐related genes in (A) euploid acute myeloid leukemia and (B) aneuploid acute myeloid leukemia. The Circos plots depict copy number gains/duplications (in red) and loss/deletions (in green) in acute myeloid leukemia–related genes associated with the aneuploid phenotype. The bar plots represent the percentages of patients with copy number events in each gene (0%‐100% scale). Links connect copy number alterations co‐occurring in the same patient; the color intensity reflects the absolute frequency of patients harboring that co‐occurrence (range, 1‐17). Mutually exclusive alterations may exist in areas that are not connected.
Networks of Genomic Events Characterizing A‐AML and E‐AML
We asked whether overall the genomic events (mutations and CNAs) presented with a differential frequency across gene ontology biological process pathways in A‐AML and E‐AML. We built networks in which the nodes and the links represented the pathways and the number of patients with enrichment of the 2 pathways, respectively. By considering links with a weight ≥ 2 (ie, at least 2 patients sharing the same 2 enriched pathways), we identified in A‐AML and E‐AML 165 and 48 nodes and 4768 and 281 edges, respectively. Genomic alterations in A‐AML targeted genes derived from many pathways (Supporting Fig. 5A), whereas they occurred in a more restricted way in patients with E‐AML (Supporting Fig. 5B). Genomic alterations may disrupt many pathways at once, and those most concomitantly affected are highlighted by high degree values in the networks. Regulation of hematopoiesis and myeloid cell differentiation were ranked among the top disease‐related pathways according to their degree and betweenness centrality in both A‐AML and E‐AML (Supporting Table 7). Moreover, A‐AML was characterized by alterations affecting DNA replication–dependent nucleosome organization and assembly and leukocyte differentiation, whereas regulation of the Smoothened signaling pathway and cell‐matrix adhesion distinguished E‐AML.
Deregulated Expression of Leukemia‐Specific and Aneuploidy‐Related Genes in A‐AML
To identify transcriptional properties contributing to the aneuploid phenotype, we performed GEP of 22 A‐AML cases and 27 E‐AML cases (normal karyotype; Supporting Table 1). A principal component analysis of GEP data showed no separation between CK–A‐AML and non‐CK–A‐AML cases (data not shown). A supervised analysis identified differential expression of 204 coding genes (56 upregulated and 148 downregulated) between A‐AML and E‐AML. We detected increased levels of CDKN2C, MCM2, and PLK1 and decreased expression of HINT1 and HOXB5, which were also identified in a previous A‐AML microarray data set,28 along with overexpression of genes associated with chromosome instability in solid tumors (MCM2, CDC20, and UBE2C).29
A panel of genes was related to AML pathogenesis (Fig. 5A); they included HOX transcription factors, the KMT2A partner MLLT10, and the DNA hydroxymethylation regulator WT1, which showed lower expression in A‐AML. RUNX3 and the WNT‐related gene FRAT2 were upregulated in A‐AML. Additional signaling molecules showed reduced expression in A‐AML; they included the inositol 1,4,5‐trisphosphate receptor ITPR2, the leukemia stem cell marker CD47, the CALM/AF10‐related gene COMMD3, and the RAS pathway genes BRAF, PIK3CB, SOS1, and PIK3C3. This suggests that distinct molecular mechanisms drive A‐AML and E‐AML.
Figure 5.
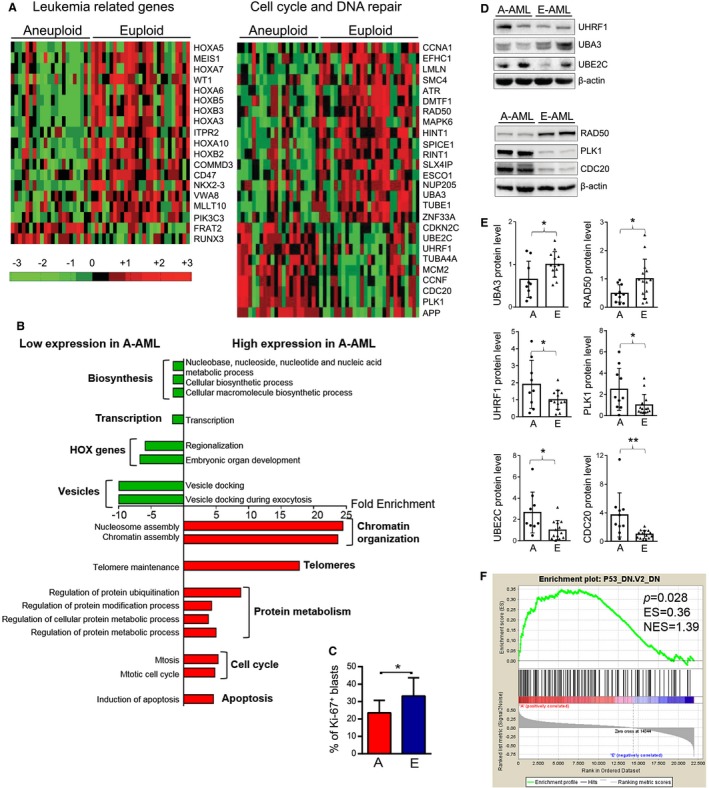
Gene expression profile analysis of A‐AML and E‐AML. (A) Gene expression differences in leukemia‐related and cell cycle– and DNA repair–related genes between A‐AML (n = 22) and E‐AML (n = 27). Data are standardized through a z‐score transform; color changes within a row indicate expression levels relative to the mean and rescaled on the transcript standard deviation. (B) Biological processes significantly enriched among differentially expressed genes in A‐AML versus E‐AML (P < .05). (C) Percentage of Ki‐67+ cells on bone marrow blasts of patients with A‐AML and E‐AML according to flow cytometry analysis. Statistical significance was determined with the Student t test (*P < .05). (D,E) Expression of UHRF1, UBA3, UBE2C, RAD50, PLK1, and CDC20 proteins. (D) Western blot of representative cases. (E) Densitometry after normalization for the mean value across E‐AML. Statistical significance was determined with the Student t test (*P < .05; **P < .01). (F) Signature of p53‐downregulation in A‐AML identified by gene set enrichment analysis. A and A‐AML indicate aneuploid acute myeloid leukemia; E and E‐AML, euploid acute myeloid leukemia; ES, enrichment score; NES, normalized enrichment score.
Notably, A‐AML was enriched for upregulated genes with known functions in protein modification, ubiquitination, metabolic processes, and telomere maintenance (Fig. 5B and Supporting Table 8), and this was coupled with the downregulation of genes involved in macromolecule biosynthesis and nucleic acid metabolic processes (Fig. 5B and Supporting Table 9). Such a profile may indicate that A‐AML cells attempt to face the unfavorable aneuploid condition by managing the unbalanced protein load and by controlling the proliferation rate. Indeed, A‐AML cases had a reduced percentage of Ki‐67+ blasts in the bone marrow (23.5% in A‐AML vs 33.2% in E‐AML; P = .03; Fig. 5C) and a lower white blood cell count in comparison with E‐cases AML both in our cohort (median, 7.1 × 10⁹/L for A‐AML vs 15.6 × 10⁹/L for E‐AML; P = .038; Supporting Table 1) and in the TCGA data set (10.0 × 10⁹/L for A‐AML vs 29.5 × 10⁹/L for E‐AML; P = .02).
Transcriptomic Signatures of A‐AML
A significant fraction of the differentially expressed genes were involved in the cell cycle and DNA repair (Fig. 5A). These included the DNA damage sensors ATR and RAD50 along with the interacting protein RINT1 and the positive p53‐mediated program regulators DMTF1 and HINT1, which were downregulated in A‐AML. Moreover, A‐AML showed deregulated expression of ubiquitin‐related genes involved in cell cycle progression (Fig. 5A and Supporting Table 8): reduced levels of the ubiquitin‐activating enzyme UBA3 and upregulation of CCNF, a subunit of the SCF complex; the ubiquitin ligase UHRF1; the ubiquitin‐conjugating enzyme UBE2C; and CDC20, which regulates APC/C activity. The differential expression of these genes was validated at the protein level (Fig. 5D,E) except for CCNF, which was not confirmed (data not shown). The level of total protein ubiquitination did not differ between A‐AML and E‐AML (Supporting Fig. 6). We sought to identify a suitable transcriptomic signature of A‐AML with therapeutic potential. By combining computational analysis and biological significance, we defined a 3‐gene signature composed of overexpressed PLK1 and CDC20 and downregulated RAD50, which discriminated 73% of patients between A‐AML and E‐AML. RAD50 downregulation (P = .041) and PLK1 (P = .024) and CDC20 upregulation (P = .004) were confirmed at the protein level (Fig. 5D,E), and this indicates that a multistep process involving different cell cycle phases is finely tuned in A‐AML.
Gene set enrichment analysis identified a significant association of A‐AML with a gene expression signature of p53 deficiency (P = .03; Fig. 5F). This finding was particularly relevant because 27% of the A‐AML cases analyzed with GEP were MK‐AML/CK‐AML, and we expected an overall rate of TP53 abnormalities of approximately 16% in our A‐AML cohort.27 To verify this hypothesis, we screened the mutational hotspots of TP53 by Sanger sequencing. Four of the 22 patients (18%) carried TP53 genomic alterations (2 mutations and 2 chromosome 17 monosomies; Supporting Table 10). The signature enrichment remained significant with the exclusion of these cases from the analysis (Supporting Fig. 7), and this indicates that nonmutational p53 inactivation cooperates with structural abnormalities to silence the p53 transcriptional program.
Discussion
The study of aneuploidy is of clinical and biological relevance in AML because more than 20% of cases display numerical chromosome aberrations,8 which can be associated with additional driver mutations.30 However, few studies have so far investigated the entire coding genome of a limited number of aneuploid cases.12, 19, 20, 31, 32 To shed light onto the molecular processes associated with A‐AML, we integrated the analyses of the mutational, transcriptional, and CN profiles of a large A‐AML cohort and compared them with E‐AML. This approach highlighted A‐AML features that were independent of the specific chromosomal aneuploidy.
Aneuploidy is associated with genomic complexity in AML, as observed in solid tumors.33 We found average numbers of coding mutations of 26 and 15 per sample in A‐AML and E‐AML, respectively. The average number of mutations was higher in our data set in comparison with the TCGA cohort because we integrated 2 variant calling tools for single‐nucleotide variant detection; this is a recently suggested strategy for improving cancer genome analysis.34 We observed a significant age‐related increase in the mutation number specifically in A‐AML. This observation rules out (or at least highly reduces) the role of age as a potential confounding factor in the study and suggests that genomic instability increases with age in A‐AML. The stress caused by aneuploidy may provide a selective pressure toward an accumulation of mutations leading to phenotypic changes that enable cells to tolerate chromosome imbalances, as observed in different models.35, 36 The reduced number of circulating white blood cells and the lower percentage of proliferating bone marrow blasts in A‐AML may reflect the proliferative disadvantage of aneuploid leukemic cells and a more quiescent stem cell–like state.37 The overall mutational spectrum of A‐AML and E‐AML was dominated by C>T base substitutions, as previously reported,24, 25 and by signature 1, which is prevalent in AML and other solid tumors.24 However, signature 2, which is associated with a higher mutation load, contributed to the genomic profile of almost all A‐AML cases, whereas it was not present in a fraction of E‐AML cases. Future studies of larger AML data sets will clarify its role and potential origin in AML.
The integration of the genomic and transcriptomic patterns characterizing A‐AML highlights cellular functions with a potential causal role in aneuploid leukemia, including deregulation of cell cycle–related processes occurring inside or outside mitosis (Fig. 6). Moreover, our data indicate that aneuploidy shapes the transcriptional profile of leukemic cells by affecting the expression of a set of genes, which is independent of the identity of the single chromosomes, as observed in aneuploid models.1, 2, 3, 5 The identified lesions may promote genomic instability, hamper cell cycle checkpoints, and force its progression.38 Evidence is available in the literature for some genes, including BUB1B,39 NSUN2,40 ESPL1,41 CDK5RAP2,42 NDC1,43 and USP44,44 which are mutated in A‐AML, and NPM1,45 which is targeted by CN loss. Among the mutated genes, the tumor suppressor TP53 has been associated with A‐AML30 and CK‐AML.27 We show here that the p53 transcriptional program is generally silenced in A‐AML through either structural or functional inactivation, which can be mediated by a number of events,46 including mutations of the p53 regulators SETD2, DDX31, USP10, and USP4, decreased expression of DMTF1 and HINT1, and increased levels of PRKCA. Reduced expression of RAD50, suggestive of an impaired DNA damage response and checkpoint arrest, and upregulation of PLK1 may hamper p53 activation in A‐AML, whereas overexpression of CDC20 could help in bypassing the spindle assembly checkpoint (Fig. 6) and thus allow the propagation of A‐AML cells.
Figure 6.

Mechanisms that potentially induce and support aneuploidy in AML: a model incorporating the genomic and transcriptomic results. AML indicates acute myeloid leukemia; SAC, spindle assembly checkpoint.
Genomic abnormalities and deregulated expression of genes involved in the protein ubiquitination and degradation pathway and in metabolism may sustain the process.1, 2, 36 The first maintains protein homeostasis, as suggested by the comparable levels of protein ubiquitination between aneuploid and euploid cases. Moreover, CN gains of genes involved in responses to ROS, glucose uptake/catabolism, and biosynthetic processes may help in facing ROS accumulation, which causes oxidative DNA damage,47 and support energy metabolism in A‐AML.1
Our findings may be relevant to the design of ad hoc therapeutic strategies that take advantage of aneuploid cell dependency on chaperone pathways, protein turnover, heightened metabolism, and a deregulated cell cycle. Although drugs inhibiting some of these cellular functions have shown poor activity (eg, NCT00666588 and NCT00830518) and/or an adverse risk‐benefit ratio (eg, NCT01721876 and NCT02030405) in previous trials, pretreatment omics analyses may favor the selection of patient subgroups that will likely benefit from these targeted agents in the near future. Novel biological insights into disease mechanisms, such as those obtained in our study, could boost the development of new personalized medicine–based trials. Moreover, our results suggest potential targets for multidrug regimens based on the concept of synthetic lethality. Candidate strategies include a combination of microtubule depolymerizing drugs and PLK1 inhibitors, which drove BCL2 inactivation in a rhabdomyosarcoma model,48 dual topoisomerase I and CHK1 inhibition, which achieved a curative response in the context of decreased expression of RAD50 in carcinoma,49 and simultaneous targeting of glycolytic metabolism and Aurora kinases, which killed AML cells.50 CDC20 is also a promising target for anticancer therapies,51 and preclinical data suggest that chemical inhibition of APC/C alone or in combination with topoisomerase poisons52 or defective sister chromatid cohesion53 may be explored as potential synthetic lethal strategies under the aneuploid condition.
Funding Support
The study was supported by the European Union Seventh Framework Programme (FP7/2007‐2013) (GA 306242‐NGS‐PTL), Associazione Italiana per la Ricerca sul Cancro (AIRC‐IG 19226 to Giovanni Martinelli and AIRC‐IG 15762 and AIRC5x1000 10007 to Stefano A. Pileri), and Programma di Ricerca Regione‐Università (2010‐2012). Lars Bullinger was partly supported by the German Research Foundation (Heisenberg‐Professur BU1339/8‐1).
Conflict of Interest Disclosures
Lars Bullinger reports personal fees and nonfinancial support from Bristol‐Myers Squibb; personal fees from Novartis, Jazz Pharmaceuticals, and Pfizer; grants and personal fees from Sanofi; and nonfinancial support from Amgen outside the submitted work. Michele Cavo reports personal fees from Janssen, Celgene, Bristol‐Myers Squibb, Amgen, and Takeda and other from Novartis outside the submitted work. Torsten Haferlach reports partial ownership of the Munich Leukemia Laboratory. Giovanni Martinelli reports compensation or nonfinancial support from Amgen (consulting or advisory role), Ariad/Incyte (consulting or advisory role), Pfizer (consulting or advisory role and speakers’ bureau), Celgene (consulting or advisory role and speakers’ bureau), Janssen (consulting or advisory role), Jazz Pharmaceuticals (consulting or advisory role), AbbVie (consulting or advisory role), Novartis (speakers’ bureau), Daiichi Sankyo (travel), Shire (travel), J&J, and Roche (consulting or advisory role and travel) outside the submitted work.
Author Contributions
Giorgia Simonetti: Conceptualization, methodology, data curation, and writing–original draft. Antonella Padella: Methodology, data curation, and writing–original draft. Italo Farìa do Valle: Methodology and writing–review and editing. Maria Chiara Fontana: Methodology and validation. Eugenio Fonzi: Methodology and writing–review and editing. Samantha Bruno: Methodology and validation. Carmen Baldazzi: Methodology and validation. Viviana Guadagnuolo: Methodology and validation. Marco Manfrini: Methodology and writing–review and editing. Anna Ferrari: Methodology and validation. Stefania Paolini: Data curation. Cristina Papayannidis: Data curation. Giovanni Marconi: Data curation. Eugenia Franchini: Methodology and validation. Elisa Zuffa: Methodology and validation. Maria Antonella Laginestra: Methodology and validation. Federica Zanotti: Methodology and validation. Annalisa Astolfi: Methodology and validation. Ilaria Iacobucci: Data curation and writing–review and editing. Simona Bernardi: Methodology and validation. Marco Sazzini: Data curation and writing–review and editing. Elisa Ficarra: Data curation and writing–review and editing. Jesus Maria Hernandez: Data curation and writing–review and editing. Peter Vandenberghe: Data curation and writing–review and editing. Jan Cools: Data curation and writing–review and editing. Lars Bullinger: Data curation and writing–review and editing. Emanuela Ottaviani: Methodology and validation. Nicoletta Testoni: Methodology and validation. Michele Cavo: Data curation and writing–review and editing. Torsten Haferlach: Resources, methodology, and writing–review and editing. Gastone Castellani: Methodology and writing–review and editing. Daniel Remondini: Methodology and writing–review and editing. Giovanni Martinelli: Conceptualization, funding acquisition, supervision, and writing–original draft.
Supporting information
The first 2 authors contributed equally to this article.
We thank the Next Generation Sequencing Platform for Targeted Personalized Therapy of Leukemia consortium, Stefano A. Pileri and Guido Biasco (for access to sequencing facilities), and Clelia Tiziana Storlazzi (for discussion).
Contributor Information
Giorgia Simonetti, Email: giorgia.simonetti3@unibo.it.
Giovanni Martinelli, Email: giovanni.martinelli@irst.emr.it.
References
- 1. Torres EM, Sokolsky T, Tucker CM, et al. Effects of aneuploidy on cellular physiology and cell division in haploid yeast. Science. 2007;317:916‐924. [DOI] [PubMed] [Google Scholar]
- 2. Sheltzer JM, Torres EM, Dunham MJ, Amon A. Transcriptional consequences of aneuploidy. Proc Natl Acad Sci U S A. 2012;109:12644‐12649. [DOI] [PMC free article] [PubMed] [Google Scholar]
- 3. Upender MB, Habermann JK, McShane LM, et al. Chromosome transfer induced aneuploidy results in complex dysregulation of the cellular transcriptome in immortalized and cancer cells. Cancer Res. 2004;64:6941‐6949. [DOI] [PMC free article] [PubMed] [Google Scholar]
- 4. Dephoure N, Hwang S, O’Sullivan C, et al. Quantitative proteomic analysis reveals posttranslational responses to aneuploidy in yeast. Elife. 2014;3:e03023. [DOI] [PMC free article] [PubMed] [Google Scholar]
- 5. Williams BR, Prabhu VR, Hunter KE, et al. Aneuploidy affects proliferation and spontaneous immortalization in mammalian cells. Science. 2008;322:703‐709. [DOI] [PMC free article] [PubMed] [Google Scholar]
- 6. Pfau SJ, Silberman RE, Knouse KA, Amon A. Aneuploidy impairs hematopoietic stem cell fitness and is selected against in regenerating tissues in vivo. Genes Dev. 2016;30:1395‐1408. [DOI] [PMC free article] [PubMed] [Google Scholar]
- 7. Mitelman F, Johansson B, Mertens F. Mitelman Database of Chromosome Aberrations and Gene Fusions in Cancer. https://cgap.nci.nih.gov/Chromosomes/Mitelman.
- 8. Grimwade D, Hills RK, Moorman AV, et al. Refinement of cytogenetic classification in acute myeloid leukemia: determination of prognostic significance of rare recurring chromosomal abnormalities among 5876 younger adult patients treated in the United Kingdom Medical Research Council trials. Blood. 2010;116:354‐365. [DOI] [PubMed] [Google Scholar]
- 9. Breems DA, Van Putten WL, De Greef GE, et al. Monosomal karyotype in acute myeloid leukemia: a better indicator of poor prognosis than a complex karyotype. J Clin Oncol. 2008;26:4791‐4797. [DOI] [PubMed] [Google Scholar]
- 10. Parkin B, Ouillette P, Li Y, et al. Clonal evolution and devolution after chemotherapy in adult acute myelogenous leukemia. Blood. 2013;121:369‐377. [DOI] [PMC free article] [PubMed] [Google Scholar]
- 11. Farag SS, Archer KJ, Mrozek K, et al. Isolated trisomy of chromosomes 8, 11, 13 and 21 is an adverse prognostic factor in adults with de novo acute myeloid leukemia: results from Cancer and Leukemia Group B 8461. Int J Oncol. 2002;21:1041‐1051. [PubMed] [Google Scholar]
- 12. Herold T, Metzeler KH, Vosberg S, et al. Isolated trisomy 13 defines a homogeneous AML subgroup with high frequency of mutations in spliceosome genes and poor prognosis. Blood. 2014;124:1304‐1311. [DOI] [PubMed] [Google Scholar]
- 13. Thompson SL, Compton DA. Proliferation of aneuploid human cells is limited by a p53‐dependent mechanism. J Cell Biol. 2010;188:369‐381. [DOI] [PMC free article] [PubMed] [Google Scholar]
- 14. Yuen KW, Warren CD, Chen O, Kwok T, Hieter P, Spencer FA. Systematic genome instability screens in yeast and their potential relevance to cancer. Proc Natl Acad Sci U S A. 2007;104:3925‐3930. [DOI] [PMC free article] [PubMed] [Google Scholar]
- 15. Schvartzman JM, Sotillo R, Benezra R. Mitotic chromosomal instability and cancer: mouse modelling of the human disease. Nat Rev Cancer. 2010;10:102‐115. [DOI] [PMC free article] [PubMed] [Google Scholar]
- 16. Dicker F, Haferlach C, Kern W, Haferlach T, Schnittger S. Trisomy 13 is strongly associated with AML1/RUNX1 mutations and increased FLT3 expression in acute myeloid leukemia. Blood. 2007;110:1308‐1316. [DOI] [PubMed] [Google Scholar]
- 17. Alpermann T, Haferlach C, Eder C, et al. AML with gain of chromosome 8 as the sole chromosomal abnormality (+8sole) is associated with a specific molecular mutation pattern including ASXL1 mutations in 46.8% of the patients. Leuk Res. 2015;39:265‐272. [DOI] [PubMed] [Google Scholar]
- 18. Virtaneva K, Wright FA, Tanner SM, et al. Expression profiling reveals fundamental biological differences in acute myeloid leukemia with isolated trisomy 8 and normal cytogenetics. Proc Natl Acad Sci U S A. 2001;98:1124‐1129. [DOI] [PMC free article] [PubMed] [Google Scholar]
- 19. Jerez A, Sugimoto Y, Makishima H, et al. Loss of heterozygosity in 7q myeloid disorders: clinical associations and genomic pathogenesis. Blood. 2012;119:6109‐6117. [DOI] [PMC free article] [PubMed] [Google Scholar]
- 20. McNerney ME, Brown CD, Wang X, et al. CUX1 is a haploinsufficient tumor suppressor gene on chromosome 7 frequently inactivated in acute myeloid leukemia. Blood. 2013;121:975‐983. [DOI] [PMC free article] [PubMed] [Google Scholar]
- 21. Eisfeld AK, Kohlschmidt J, Mrozek K, et al. Mutational landscape and gene expression patterns in adult acute myeloid leukemias with monosomy 7 as a sole abnormality. Cancer Res. 2017;77:207‐218. [DOI] [PMC free article] [PubMed] [Google Scholar]
- 22. Ley TJ, Miller C, Ding L, et al. Cancer Genome Atlas Research Network. Genomic and epigenomic landscapes of adult de novo acute myeloid leukemia. N Engl J Med. 2013;368:2059‐2074. [DOI] [PMC free article] [PubMed] [Google Scholar]
- 23. Dohner H, Estey E, Grimwade D, et al. Diagnosis and management of AML in adults: 2017 ELN recommendations from an international expert panel. Blood. 2017;129:424‐447. [DOI] [PMC free article] [PubMed] [Google Scholar]
- 24. Alexandrov LB, Nik‐Zainal S, Wedge DC, et al. Signatures of mutational processes in human cancer. Nature. 2013;500:415‐421. [DOI] [PMC free article] [PubMed] [Google Scholar]
- 25. Garg M, Nagata Y, Kanojia D, et al. Profiling of somatic mutations in acute myeloid leukemia with FLT3‐ITD at diagnosis and relapse. Blood. 2015;126:2491‐2501. [DOI] [PMC free article] [PubMed] [Google Scholar]
- 26. Alexandrov LB, Jones PH, Wedge DC, et al. Clock‐like mutational processes in human somatic cells. Nat Genet. 2015;47:1402‐1407. [DOI] [PMC free article] [PubMed] [Google Scholar]
- 27. Rucker FG, Schlenk RF, Bullinger L, et al. TP53 alterations in acute myeloid leukemia with complex karyotype correlate with specific copy number alterations, monosomal karyotype, and dismal outcome. Blood. 2012;119:2114‐2121. [DOI] [PubMed] [Google Scholar]
- 28. Neben K, Tews B, Wrobel G, et al. Gene expression patterns in acute myeloid leukemia correlate with centrosome aberrations and numerical chromosome changes. Oncogene. 2004;23:2379‐2384. [DOI] [PubMed] [Google Scholar]
- 29. Carter SL, Eklund AC, Kohane IS, Harris LN, Szallasi Z. A signature of chromosomal instability inferred from gene expression profiles predicts clinical outcome in multiple human cancers. Nat Genet. 2006;38:1043‐1048. [DOI] [PubMed] [Google Scholar]
- 30. Papaemmanuil E, Gerstung M, Bullinger L, et al. Genomic classification and prognosis in acute myeloid leukemia. N Engl J Med. 2016;374:2209‐2221. [DOI] [PMC free article] [PubMed] [Google Scholar]
- 31. Larsson N, Lilljebjorn H, Lassen C, Johansson B, Fioretos T. Myeloid malignancies with acquired trisomy 21 as the sole cytogenetic change are clinically highly variable and display a heterogeneous pattern of copy number alterations and mutations. Eur J Haematol. 2012;88:136‐143. [DOI] [PubMed] [Google Scholar]
- 32. McNerney ME, Brown CD, Peterson AL, et al. The spectrum of somatic mutations in high‐risk acute myeloid leukaemia with –7/del(7q). Br J Haematol. 2014;166:550‐556. [DOI] [PMC free article] [PubMed] [Google Scholar]
- 33. Solomon DA, Kim T, Diaz‐Martinez LA, et al. Mutational inactivation of STAG2 causes aneuploidy in human cancer. Science. 2011;333:1039‐1043. [DOI] [PMC free article] [PubMed] [Google Scholar]
- 34. Bodini M, Ronchini C, Giaco L, et al. The hidden genomic landscape of acute myeloid leukemia: subclonal structure revealed by undetected mutations. Blood. 2015;125:600‐605. [DOI] [PMC free article] [PubMed] [Google Scholar]
- 35. Sheltzer JM, Blank HM, Pfau SJ, et al. Aneuploidy drives genomic instability in yeast. Science. 2011;333:1026‐1030. [DOI] [PMC free article] [PubMed] [Google Scholar]
- 36. Torres EM, Dephoure N, Panneerselvam A, et al. Identification of aneuploidy‐tolerating mutations. Cell. 2010;143:71‐83. [DOI] [PMC free article] [PubMed] [Google Scholar]
- 37. Kusumbe AP, Bapat SA. Cancer stem cells and aneuploid populations within developing tumors are the major determinants of tumor dormancy. Cancer Res. 2009;69:9245‐9253. [DOI] [PubMed] [Google Scholar]
- 38. Janssen A, van der Burg M, Szuhai K, Kops GJ, Medema RH. Chromosome segregation errors as a cause of DNA damage and structural chromosome aberrations. Science. 2011;333:1895‐1898. [DOI] [PubMed] [Google Scholar]
- 39. Hanks S, Coleman K, Reid S, et al. Constitutional aneuploidy and cancer predisposition caused by biallelic mutations in BUB1B. Nat Genet. 2004;36:1159‐1161. [DOI] [PubMed] [Google Scholar]
- 40. Hussain S, Benavente SB, Nascimento E, et al. The nucleolar RNA methyltransferase Misu (NSun2) is required for mitotic spindle stability. J Cell Biol. 2009;186:27‐40. [DOI] [PMC free article] [PubMed] [Google Scholar]
- 41. Zhang N, Ge G, Meyer R, et al. Overexpression of Separase induces aneuploidy and mammary tumorigenesis. Proc Natl Acad Sci U S A. 2008;105:13033‐13038. [DOI] [PMC free article] [PubMed] [Google Scholar]
- 42. Lizarraga SB, Margossian SP, Harris MH, et al. Cdk5rap2 regulates centrosome function and chromosome segregation in neuronal progenitors. Development. 2010;137:1907‐1917. [DOI] [PMC free article] [PubMed] [Google Scholar]
- 43. Chial HJ, Giddings TH Jr, Siewert EA, Hoyt MA, Winey M. Altered dosage of the Saccharomyces cerevisiae spindle pole body duplication gene, NDC1, leads to aneuploidy and polyploidy. Proc Natl Acad Sci U S A. 1999;96:10200‐10205. [DOI] [PMC free article] [PubMed] [Google Scholar]
- 44. Zhang Y, Foreman O, Wigle DA, et al. USP44 regulates centrosome positioning to prevent aneuploidy and suppress tumorigenesis. J Clin Invest. 2012;122:4362‐4374. [DOI] [PMC free article] [PubMed] [Google Scholar]
- 45. Grisendi S, Bernardi R, Rossi M, et al. Role of nucleophosmin in embryonic development and tumorigenesis. Nature. 2005;437:147‐153. [DOI] [PubMed] [Google Scholar]
- 46. Prokocimer M, Molchadsky A, Rotter V. Dysfunctional diversity of p53 proteins in adult acute myeloid leukemia: projections on diagnostic workup and therapy. Blood. 2017;130:699‐712. [DOI] [PMC free article] [PubMed] [Google Scholar]
- 47. Li M, Fang X, Baker DJ, et al. The ATM‐p53 pathway suppresses aneuploidy‐induced tumorigenesis. Proc Natl Acad Sci U S A. 2010;107:14188‐14193. [DOI] [PMC free article] [PubMed] [Google Scholar]
- 48. Hugle M, Belz K, Fulda S. Identification of synthetic lethality of PLK1 inhibition and microtubule‐destabilizing drugs. Cell Death Differ. 2015;22:1946‐1956. [DOI] [PMC free article] [PubMed] [Google Scholar]
- 49. Al‐Ahmadie H, Iyer G, Hohl M, et al. Synthetic lethality in ATM‐deficient RAD50‐mutant tumors underlies outlier response to cancer therapy. Cancer Discov. 2014;4:1014‐1021. [DOI] [PMC free article] [PubMed] [Google Scholar]
- 50. Liu LL, Long ZJ, Wang LX, et al. Inhibition of mTOR pathway sensitizes acute myeloid leukemia cells to aurora inhibitors by suppression of glycolytic metabolism. Mol Cancer Res. 2013;11:1326‐1336. [DOI] [PubMed] [Google Scholar]
- 51. Kapanidou M, Curtis NL, Bolanos‐Garcia VM. Cdc20: at the crossroads between chromosome segregation and mitotic exit. Trends Biochem Sci. 2017;42:193‐205. [DOI] [PubMed] [Google Scholar]
- 52. Eguren M, Alvarez‐Fernandez M, Garcia F, et al. A synthetic lethal interaction between APC/C and topoisomerase poisons uncovered by proteomic screens. Cell Rep. 2014;6:670‐683. [DOI] [PubMed] [Google Scholar]
- 53. de Lange J, Faramarz A, Oostra AB, et al. Defective sister chromatid cohesion is synthetically lethal with impaired APC/C function. Nat Commun. 2015;6:8399. [DOI] [PMC free article] [PubMed] [Google Scholar]
Associated Data
This section collects any data citations, data availability statements, or supplementary materials included in this article.
Supplementary Materials