

Abstract
Adult B‐lymphoblastic leukemia (B‐ALL) is a hematological malignancy characterized by genetic heterogeneity. Despite successful remission induction with classical chemotherapeutics and novel targeted agents, enduring remission is often hampered by disease relapse due to outgrowth of a pre‐existing subclone resistant against the treatment. In this study, we show that small glycophosphatidylinositol (GPI)‐anchor deficient CD52‐negative B‐cell populations are frequently present already at diagnosis in B‐ALL patients, but not in patients suffering from other B‐cell malignancies. We demonstrate that the GPI‐anchor negative phenotype results from loss of mRNA expression of the PIGH gene, which is involved in the first step of GPI‐anchor synthesis. Loss of PIGH mRNA expression within these B‐ALL cells follows epigenetic silencing rather than gene mutation or deletion. The coinciding loss of CD52 membrane expression may contribute to the development of resistance to alemtuzumab (ALM) treatment in B‐ALL patients resulting in the outgrowth of CD52‐negative escape variants. Additional treatment with 5‐aza‐2′‐deoxycytidine may restore expression of CD52 and revert ALM resistance.
Abbreviations
- 5‐aza
5‐aza‐2′‐deoxycytidine
- ALM
Alemtuzumab
- APC
allophycocyanin
- B‐ALL
B‐lymphoblastic leukemia
- BD
Becton Dickinson
- BM
bone marrow
- ChIP
chromatin immunoprecipitation
- CLL
chronic lymphocytic leukemia
- FLAER
inactivated toxin pro‐aerolysin coupled to AlexaFluor488
- GPI
glycophosphatidylinositol
- GPIneg
GPI/CD52‐negative
- GPIpos
GPI/CD52‐positive
- HCL
hairy cell leukemia
- MCL
mantle cell lymphoma
- MFI
median fluoresce intensity
- MLL
mixed‐lineage leukemia
- MNC
mononuclear cells
- MS‐MCA
methylation specific melting curve analysis
- PB
peripheral blood
- PE
phycoerythrin
- PNH
paroxysmal nocturnal hemoglobinuria
- refDNA
nonimmunoprecipitated DNA reference sample
- SNP
single nucleotide polymorphisms
- tNGFR
truncated nerve growth factor receptor
- TSS
transcription start site
1. INTRODUCTION
Despite introduction of new treatment modalities, such as immunotherapeutics and kinase inhibitors, the survival rate for adult patients with B‐lymphoblastic leukemia (B‐ALL) remains disappointing due to a high risk of relapse after initial successful induction of complete remission.1 Relapse often results from outgrowth of subclones carrying mutations that confer resistance to therapy.2, 3
Incorporation of alemtuzumab (ALM, Campath‐1H) in treatment protocols can lead to successful disease control in a wide variety of hematological malignancies.4, 5, 6 In contrast, introduction of ALM as a single drug treatment for B‐ALL resulted in only modest clinical efficacy. Despite similarly high membrane expression of the glycophosphatidylinositol (GPI)‐anchored ALM target antigen CD52 across all the B‐ALL molecular subtypes (with t(4;11) as the only exception),7 only a minority of the patients achieved an enduring complete remission due to early relapses.8, 9 This could be the result of outgrowth of CD52‐negative B‐ALL escape variants,10, 11 as demonstrated in a mouse model engrafted with human B‐ALL.10 These CD52‐negative B‐ALL cells displayed normal CD52 gene expression, but remarkably loss of CD52 membrane expression coincided with loss of other GPI‐linked proteins like CD55 and CD59, indicating that loss of GPI‐anchor expression had been the underlying cause. This loss of GPI‐anchor expression was not the result of mutations in the X‐linked PIGA gene,10 one of 28 genes essential for GPI‐anchor synthesis,12 which causes loss of GPI‐anchor expression in paroxysmal nocturnal hemoglobinuria (PNH).13, 14
The aim of this study was to unravel the mechanisms underlying loss of GPI‐anchor expression and coinciding loss of CD52 membrane expression in B‐ALL. We show that small pre‐existing GPI/CD52‐negative B‐cell populations are frequently present in peripheral blood (PB) and bone marrow (BM) of B‐ALL patients already at diagnosis, but not in patients suffering from other B‐cell malignancies or in healthy donor B cells. We demonstrate that loss of mRNA expression of the PIGH gene, which is involved in the first step of GPI‐anchor synthesis, was the underlying cause of loss of GPI‐anchor expression in B‐ALL cells. This loss of PIGH mRNA expression was not due to genetic aberrations, but rather due to epigenetic silencing. These data describe a new mechanism of loss of GPI‐anchor expression. The resulting loss of CD52 membrane expression may confer ALM resistance to B‐ALL patients due to the outgrowth of CD52‐negative escape variants.
2. MATERIALS AND METHODS
2.1. Patient samples
Residual BM or PB samples from ALM‐naïve patients with B‐ALL, chronic lymphocytic leukemia (CLL), hairy cell leukemia (HCL), or mantle cell lymphoma (MCL) which were taken at diagnosis and stored anonymously were used for this study. Mononuclear cells (MNC) were isolated by Ficoll‐Isopaque separation and cryopreserved in Iscove's Modified Dulbecco's Media (IMDM, Lonza, Verviers, Belgium) supplemented with 25% fetal calf serum (FCS, Lonza) and 10% dimethyl sulfoxide (DMSO, Sigma‐Aldrich, Zwijdrecht, The Netherlands). MNC isolated from PB of healthy donors were taken as control. The use of these materials for research was approved by the Leiden University Medical Center medical ethical committee.
For one patient (ALL‐06), a PB sample taken 1 month after relapse that occurred after ALM‐treatment was available. In this patient, successful ALM‐treatment, as indicated by the absence of circulating lymphocytes 2 months after treatment initiation, was followed by an early relapse at month 4.
2.2. Flow cytometry and cell sorting
GPI‐anchor expression was analyzed by flow cytometry on thawed MNC samples stained with the GPI‐anchor specific inactivated toxin pro‐aerolysin coupled to AlexaFluor488 (FLAER‐ALX488, Sanbio, Uden, The Netherlands), allophycocyanin (APC)‐conjugated anti‐CD52 (ITK diagnostics, Uithoorn, The Netherlands), anti‐CD3‐phycoerythrin/cyanine7 (ITK) or anti‐CD3‐PacificBlue (BD, Becton Dickinson, Breda, The Netherlands), and phycoerythrin (PE)‐conjugated anti‐CD19 (BD) and analyzed on an LSRII (BD) (gating strategy in Supporting Information Figure S1). Samples containing FLAER‐negative cells, were further characterized by staining with FLAER, anti‐CD45‐PE (BD), and anti‐CD19‐APC (BD). FACS‐sorting was performed using the same antibodies on a FACSARIA III (BD).
2.3. Fluorescent in situ hybridization analysis
High‐resolution karyotype analysis on primary B‐ALL samples was performed by combined binary ratio labeling fluorescent in situ hybridization as described before.15 Fluorescent in situ hybridization analysis specific for cytogenetic aberrations t[9;22] and del7q on FACS‐sorted GPI‐anchor negative (FLAER‐) malignant B cells (CD19+/CD45dim) was performed using Vysis probe combinations LSI BCR/ABL ES and D7S486/CEP 7 (both Abbott Molecular, Des Plaines, IL), respectively.
2.4. Expression analysis of GPI‐anchor synthesis pathway genes
For each patient sample, equal numbers of GPI‐anchor negative and positive B cells (range 3000‐670 000 cells) were isolated from thawed MNC samples by FACS‐sorting. mRNA was isolated using the RNAqueous‐Micro Kit (Thermo Fisher scientific, Bleiswijk, The Netherlands), which included DNAse treatment, quantified using a spectrophotometer (ND‐1000, Thermo Fisher scientific), and completely converted to cDNA using M‐MLV transcriptase (Thermo Fisher) and oligo‐dT primers. cDNA input was equalized for the different samples using the mRNA Nanodrop measurements as reference (minimum of 6 ng of converted mRNA per sample). PCR amplification was performed using specific primers for the 28 GPI‐anchor synthesis genes (Supporting Information Table S1) and PWO SuperYield DNA polymerase with a touchdown protocol which consisted of initial denaturing at 95°C (2 min), 7 cycles at 95°C (15 s), 65°C‐58°C with a 1°C decrement per cycle (30 s), and 72°C (60 s), 25 cycles at 95°C (15 s), 58°C (30 s), and 72°C (60 s + 5 s/cycle), and a final extension step at 72°C (7 min).
Expression analysis of the full protein coding region of PIGH was performed by amplification using specific primers (Supporting Information Table S2) and Phusion Flash High‐Fidelity PCR Master Mix (Thermo fisher scientific) with a touchdown protocol which consisted of initial denaturing at 98°C (2 min), 7 cycles at 98°C (1 s), 65°C‐58°C with a 1°C decrement per cycle (5 s), and 72°C (30 s), 30 cycles (PIGH) or 20 cycles (GAPDH) at 98°C (1 s), 58°C (5 s), and 72°C (60 s), and a final extension step at 72°C (7 min). As cDNA loading control, GAPDH was amplified.
2.5. Cell culture conditions and generation of subcultures
Cell lines Leiden‐ALL‐BV and Leiden‐ALL‐HP were generated previously in our laboratory from primary B‐ALL cells.15 B‐ALL cell lines were maintained in Iscove's Modified Dulbecco's Media (IMDM, Lonza) supplemented with 6 mg/mL human serum albumin (HSA, Sanquin, Amsterdam, The Netherlands), 10 μg/mL cholesterol, 1 μg/mL insulin, 50 μM 2‐mercaptoethanol (all three from Sigma‐Aldrich), 200 μg/mL human apo‐transferrin (Invitrogen, Carlsbad, Ca, USA), 2 mM glutamine (Lonza), 0.5 μg/mL amphotericin (Bristol‐Myers Squibb, Utrecht, The Netherlands) and 50 units/mL penicillin/streptomycin (Lonza).
GPI‐anchor negative and GPI‐anchor positive subcultures of Leiden‐ALL‐BV and Leiden‐ALL‐HP were generated by FACS‐sorting using counterstaining with FLAER‐ALX488 and APC‐conjugated anti‐CD52. Upon subsequent expansion the four new subcultures were termed Leiden‐ALL‐BV‐GPI‐positive (BV GPIpos), Leiden‐ALL‐BV‐GPI‐negative (BV GPIneg), Leiden‐ALL‐HP‐GPI‐positive (HP GPIpos), and Leiden‐ALL‐HP‐GPI‐negative (HP GPIneg). Purity of the newly formed subcultures was analyzed by flow cytometry staining with FLAER‐ALX488 and APC‐conjugated anti‐CD52.
2.6. Generation of PIGH, PIGA, and mock expression constructs and retroviral transduction
A construct encoding wtPIGH coupled via a GSG linker and a self‐cleaving T2A peptide sequence to a truncated form of the nerve growth factor receptor (tNGFR), which served as a marker gene, were cloned into the LZRS plasmid. As controls, constructs encoding wtPIGA coupled to tNGFR (PIGA) or tNGFR only (mock) were used. The constructs were transfected into the φ‐NX‐A retroviral packaging cell line using Fugene HD Transfection Reagent (Roche, Woerden, The Netherlands). After 4 days, transfected cells were selected by addition of 2 μg/mL puromycin (Clontech, TaKaRa Bio, Mountain View, CA) to the culture medium. After 24 hr, selected cells were further expanded in absence of puromycin for several weeks before supernatant was collected and stored at −80°C.
Retroviral transduction was performed as described before.16 Supernatant containing the retroviral particles was added to wells of a flat bottom non tissue culture treated 24‐well plate coated with human fibronectin fragments (CH‐296, Retronectin, TaKaRa Bio) and centrifuged for 20 min at 3000g. After removal of the supernatant, 1.5 × 10⁵ B‐ALL cells were added per well and incubated for 24 hr at 37°C and 5% CO2. Transduced cells were transferred to tissue culture treated plates and allowed to expand for 5 days before analysis by flow cytometry, counterstaining with FLAER‐Alx488, APC‐conjugated anti‐CD52, and PE‐conjugated anti‐NGFR (BD).
2.7. PIGH mRNA expression and mutational analysis
mRNA was isolated from 5.0 × 10⁵ cells and partial PIGH transcription variants were amplified by PCR using specific primers (Supporting Information Table S2) and Phusion Flash High‐Fidelity PCR Master Mix using the protocol described above.
For mutational analysis, DNA was isolated from 2.0 × 10⁶ cells using the Gentra Puregene Cell Kit (Qiagen, Venlo, The Netherlands). Amplification of the 10 kb PIGH genomic region was performed using specific primers (Supporting Information Table S2) and the Expand Long Template PCR System with the following parameters, initial denaturing at 94°C (5 min), 10 cycles at 94°C(30 s), 59°C (30 s), and 68°C (8 min), 30 cycles at 94°C (30 s), 59°C (30 s), and 68°C (8 min + 20 s/cycle), and a final extension step at 72°C (7 min). The resulting product was analyzed by gel electrophoresis using the SmartLadder LF (Eurogentec) as a marker. The correctly sized bands were excised and cleaned using the Wizard SV Gel and PCR Clean‐Up System (Promega, Leiden, The Netherlands). Nested PCR's were performed using specific primers (Supporting Information Table S2) and PWO SuperYield DNA polymerase with the following parameters, initial denaturing at 94°C (5 min), 10 cycles at 94°C (15 s), 58°C (30 s), and 72°C (150 s), 25 cycles at 94°C (15 s), 58°C (30 s), and 72°C (150 s), and a final extension step at 72°C (7 min). Products from the nested PCR's were analyzed for mutation in the promoter region, exon boundaries, and gene body by Sanger sequencing using the same primers. All Sanger sequencing was performed by Baseclear (Leiden, The Netherlands) and analyzed using Geneious 8 software (Biomatters limited, Auckland, New Zeeland).
2.8. Microarray analysis
Total RNA of 2 × 10⁶ cells of subcultures BV GPIpos, BV GPIneg, HP GPIpos, and HP GPIneg was isolated using an RNAqueous Total RNA Kit (Thermo Fisher scientific), cleaned using an RNeasy mini kit (Qiagen), and quality checked using Agilent RNA6000 chips and the Agilent Bioanalyser (Santa Clara, CA, USA). RNA was amplified using the TotalPrep RNA amplification kit (Ambion). Samples were analyzed using a whole‐genome gene expression direct hybridization assay with Human HT‐12 v4 Expression BeadChips on a BeadArray 500GX device (all Illumina, San Diego, CA). Data was analyzed using R 2.15 as described before.17
2.9. ChIP‐qPCR
Chromatin immunoprecipitation (ChIP) was performed as described before.18 For each subculture 100 × 106 cells were fixed using 1% formaldehyde for 10 min at 20°C. Formaldehyde was quenched by addition of 1/20 volume 2.5 M glycine for 15 min at 20°C. Cells were washed twice using PBS, supernatant was discarded, and the cell pellet was snap frozen at −80°C. The cell pellet was thawed and resuspended in lysis buffer, sonicated twice for 15 min using a Bioruptor (30s ON/OFF interval, output high, Diagenode, Seraing, Belgium), and split into four identical samples of which three were incubated with 200 μL Dynabeads Protein G pre‐incubated with 5 μg of either anti‐histone H3, anti‐histone H3K4me3 and anti‐histone H3K27me3 overnight at 4°C. The fourth sample was used as untreated reference (refDNA). Beads were washed in a Dynamag‐2 magnet (Thermo Fisher scientific) followed by elution (50 mM Tris‐HCl, 10 mM EDTA, 1% SDS). All samples were reverse cross‐linked by overnight heating at 65°C. DNA was purified using phenol‐chloroform extraction. DNA was quantified using a ND‐1000 spectrophotometer.
Per condition, 5 ng of DNA was analyzed in duplicate by qPCR using specific primers targeting PIGH (Supporting Information Table S2), FastStart Taq DNA polymerase (Roche), and Evagreen (Biotium, Fremont, CA) using the following protocol, initial denaturing at 95°C (10 min), followed by 45 cycles at 95°C (10 s), 65°C (30 s), 72°C (20 s), and a plate read. GAPDH (promoter region) and MYOD1 (gene body) were amplified as positive controls for histone marks H3K4me3 or H3K27me3, respectively. qPCR analysis was performed on a LightCycler‐480 (Roche). An average Ct‐value was calculated from the duplicate measurement. For the positive control genes an average Ct‐value was calculated from the two primer sets. Presence of PIGH coding DNA in the histone mark ChIP DNA samples relative to refDNA and normalized for a positive control gene (GAPDH for H3K4me3, MYOD1 for H3K27me3) was calculated using the 2−ΔΔCt method,19 where ΔΔCt = (CtPIGH − CtGAPDH or MYOD1)refDNA − (CtPIGH − CtGAPDH or MYOD1)ChIPDNA. The difference between the GPIneg and GPIpos subcultures of Leiden‐ALL‐BV or Leiden‐ALL‐HP were calculated by dividing the 2−ΔΔCt from the GPIneg sample by the 2−ΔΔCt from the GPIpos sample. Results were normalized for the GPIpos subcultures.
2.10. Promoter methylation analysis
DNA was extracted using the QIAamp DNA Blood Mini Kit (Qiagen) and 1 μg was bisulfite‐converted using the EZ DNA Methylation Kit (Zymo Research, Orange, CA). Amplification and methylation specific melting curve analysis (MS‐MCA) was performed by using specific primers (Supporting Information Table S2) on a CFX384 Touch Real‐Time PCR Detection System (Bio‐Rad, Veenendaal, the Netherlands) using a touchdown PCR protocol with the following parameters, initial denaturing at 95°C (30 s), 7 cycles at 95°C (30 s), 65°C‐58°C with a 1°C decrement per cycle (40 s), and 72°C (40 s), following by 33 cycles at 95°C (30 s), 60°C (40 s), and 72°C (40 s), and a final extension step at 72°C (3 min). Following amplification, melting curves were acquired in the presence of iQ SYBR Green Supermix (Bio‐Rad) during a linear temperature transition from 65°C to 90°C with increments of 0.2°C/10 s. Bisulfite converted CpGenome Universal Methylated DNA (Chemicon, Hampshire, United Kingdom) and unmethylated male DNA were used as references. Methylation levels of individual CpGs were analyzed by Sanger sequencing (ratio between height of cytosine signal relative to thymine signal).
2.11. Demethylation assay
For each subculture, 1.0 × 10⁵ cells were cultured in 200 μL medium with or without 0.5 μM 5‐aza‐2′‐deoxycytidine (5‐aza, Vidaza, Pharmion Corporation, Boulder, CO, USA) for 15 days. Daily, 100 μL culture supernatant was replaced with 100 μL fresh medium containing 1.0 μM 5‐aza. Presence of GPI‐positive cells was evaluated by flow cytometry using counterstaining with FLAER‐ALX488.
3. RESULTS
3.1. GPI/CD52‐deficient cells are commonly present in B‐ALL, but not in other B‐cell malignancies
To examine whether pre‐existing populations of GPI/CD52‐negative malignant B cells were already present at diagnosis in patients with B‐ALL who had not previously received ALM‐treatment, we screened primary PB (n = 13) or BM (n = 12) samples from 25 patients with B‐ALL who carried various cytogenetic aberrations (Table 1). In 13/22 evaluable samples (both PB and BM) clear (>0.025%) GPI‐anchor negative populations (median 0.25%) were detected within the B‐cell compartment (representative examples in Figure 1; aggregated result in Table 1). These GPI‐anchor negative B cells consistently lacked CD52 membrane expression. Detailed flow cytometric analysis demonstrated that the GPI‐anchor negative B cells were present in the malignant (CD45dim) but not in normal B‐cells (CD45bright) within the same sample (representative examples for three cases in Supporting Information Figure S2). The malignant nature of the GPI‐anchor negative B cells was further confirmed for these three B‐ALL cases by flow cytometric cell sorting of the GPI‐anchor negative populations and subsequent FISH analysis. The GPI‐anchor negative B cells contained the same cytogenetic aberrations as the bulk of the malignancy (del7q for ALL‐03, and t(9;22) for ALL‐05 and ALL‐12) (data not shown). In the samples of three patients carrying a mixed‐lineage leukemia (MLL) translocation t(4;11) (samples 23‐25) an atypical pattern of low GPI‐anchor expression was observed (Supporting Information Figure S3), hampering proper discrimination of potential GPI‐anchor negative B cells. The GPI‐anchor positive B‐cells within the other B‐ALL samples displayed broad, but clearly positive CD52 expression patterns (Table 1), with the exception of sample ALL‐08. Whereas the presence of GPI/CD52‐negative cells in the malignant B cell populations was a frequent event, within the T cells of the same samples no clear GPI/CD52‐negative cells were detected (representative examples in Figure 1). No overt GPI/CD52‐negative B‐cells were found in PB samples from healthy donors (n = 6, representative examples in Supporting Information Figure S4). To investigate whether GPI/CD52‐negative cells were common in patients carrying B‐cell malignancies, we screened samples from patients with CLL (PB, n = 5), HCL (PB, n = 5; spleen, n = 1), and MCL (PB, n = 2; BM, n = 2) taken at diagnosis. No GPI/CD52‐negative cells were detected within these malignant B cells (Supporting Information Figure S5).
Table 1.
GPI‐anchor deficiency in B‐lymphoblastic leukemia
| Sample | Number of B‐cells screened | GPIneg/CD52neg B cells (%)a | CD52 expression of GPIpos B cells (MFI) | Sample type | Cytogenetic abnormalitiesb |
|---|---|---|---|---|---|
| ALL‐01 | 260 013 | 5.46 | 1139 | PB | t(9;22) |
| ALL‐02 | 1 163 689 | 3.99 | 999 | PB | t(9;22) |
| ALL‐03 | 262 365 | 2.26 | 707 | PB | Del 7q |
| ALL‐04 | 533 748 | 0.92 | 973 | PB | |
| ALL‐05 | 711 323 | 0.66 | 605 | BM | t(9;22) |
| ALL‐06 | 813 639 | 0.38 | 2033 | BM | |
| ALL‐07 | 369 534 | 0.25 | 1390 | BM | t(9;22) |
| ALL‐08 | 860 812 | 0.19 | 57 | BM | Trisomy 5 and 20 |
| ALL‐09 | 500 711 | 0.10 | 775 | PB | |
| ALL‐10 | 298 157 | 0.04 | 1604 | PB | Hypodiploid |
| ALL‐11 | 1 073 541 | 0.04 | 1654 | BM | t(9;22) |
| ALL‐12 | 608 951 | 0.03 | 1333 | BM | t(9;22) |
| ALL‐13 | 736 663 | 0.03 | 1967 | PB | t(9;22) |
| ALL‐14 | 230 537 | <0.025 | 1172 | PB | |
| ALL‐15 | 621 516 | <0.025 | 628 | BM | Hyperdiploid |
| ALL‐16 | 334 908 | <0.025 | 754 | BM | |
| ALL‐17 | 303 145 | <0.025 | 1734 | PB | t(9;22) |
| ALL‐18 | 411 442 | <0.025 | 755 | BM | t(9;22) |
| ALL‐19 | 253 089 | <0.025 | 4563 | BM | |
| ALL‐20 | 481 892 | <0.025 | 1731 | PB | t(9;22), hyperdiploid |
| ALL‐21 | 643 042 | <0.025 | 236 | BM | t(9;22) |
| ALL‐22 | 856 455 | <0.025 | 1089 | PB | |
| ALL‐23 | 456 449 | c | c | BM | t(4;11), MLL |
| ALL‐24 | 596 098 | c | c | PB | t(4;11), MLL |
| ALL‐25 | 527 922 | c | c | PB | t(4;11), MLL |
MFI, median fluoresce intensity; BM, bone marrow; PB, peripheral blood.
A cut‐off percentage of 0.025% was used to exclude back‐ground events.
Most frequent cytogenetic aberration.
Not able to discriminate (see Supporting Information Figure S3).
Figure 1.
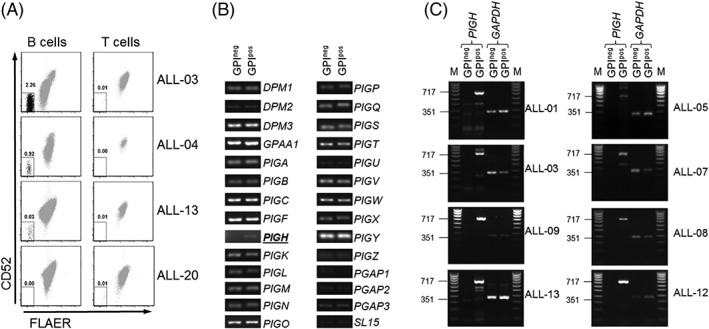
Loss of GPI/CD52‐expression is due to absence of PIGH mRNA expression in B‐ALL samples at diagnosis. A, Four representative flow cytometric analyses of GPI‐anchor (FLAER) and CD52 membrane expression on B cells (CD19+ CD3−, left panels) or T cells (CD3+ CD19−, right panels) in MNC samples taken at diagnosis from patients with B‐ALL. The percentages of GPI/CD52‐negative cells are indicated. B, Representative example of mRNA expression analysis for the 28 genes comprising the GPI‐anchor synthesis pathway on equimolar amounts of cDNA from GPI/CD52‐negative (GPIneg) and GPI/CD52‐positive (GPIpos) B cells purified from MNC sample ALL‐04. C, mRNA expression analyses of the PIGH protein‐coding region (717 bp) performed on equimolar amounts of cDNA from purified GPIneg and GPIpos B cells from PB (n = 4, left panels) or BM (n = 4, right panels) samples of patients with B‐ALL, using GAPDH (351 bp) as a loading control (M defines the marker lane)
For one patient (ALL‐06), material taken at diagnosis and material of the relapse that occurred after ALM‐treatment was available for analysis. An enlarged GPI/CD52‐negative B‐cell population (32.5%) was found in the sample taken 1 month after relapse (Supporting Information Figure S6).
These data demonstrate that the presence of GPI/CD52‐negative B‐cells is a frequent event in B‐ALL, but not in other B‐cell malignancies and in healthy donor B cells.
3.2. Loss of PIGH mRNA expression in GPI‐anchor negative primary B‐ALL cells
To unravel the underlying mechanism resulting in GPI‐anchor deficiency within GPI/CD52‐negative B‐ALL cells, we performed mRNA expression analysis for all 28 genes that are essential for GPI‐anchor synthesis in FACS purified GPI‐anchor negative B‐ALL cells (from ALL‐01, ALL‐04, and ALL‐05), using GPI‐anchor positive B cells from the same samples as controls. In all three cases, no PIGH mRNA expression was detected in the GPI‐anchor negative cells, whereas normal PIGH mRNA expression was detected in the GPI‐anchor positive cells (Figure 1B, representative example). Transcriptional activity for all other 27 GPI‐anchor synthesis genes was observed in both the GPI‐anchor negative and positive cell populations.
To explore whether absence of PIGH mRNA expression was a common phenomenon in GPI‐anchor negative B‐ALL cells, mRNA expression analysis for the protein‐coding region of PIGH was performed in purified GPI‐anchor negative B‐cells derived from PB (n = 4) or BM (n = 4) samples of eight patients. Absence of PIGH mRNA expression was observed within the GPI‐anchor negative cells and not within the GPI‐anchor positive cells for all patients (Figure 1C).
These data show that loss of PIGH mRNA expression is a common phenomenon and associated with the GPI‐anchor negative phenotype in B‐ALL cells.
3.3. GPI‐anchor expression is restored by enforced PIGH expression
To assess whether absence of PIGH mRNA expression was the sole cause of the GPI‐anchor negative phenotype in B‐ALL cells, we restored PIGH expression by retroviral transduction. We used cell lines Leiden‐ALL‐BV and Leiden‐ALL‐HP which were generated from primary B‐ALL cells of samples ALL‐02 and ALL‐06 (after relapse following ALM‐treatment), respectively. These cell lines contained 10.4% (Leiden‐ALL‐BV) and 0.4% (Leiden‐ALL‐HP) GPI‐anchor negative cells. GPI‐anchor negative and GPI‐anchor positive subpopulations were purified by FACS‐sorting (Supporting Information Figure S7). The GPI‐anchor phenotype of these subcultures was stable during culturing. Absence of PIGH mRNA within GPI‐anchor negative, but not within GPI‐anchor positive subcultures was shown by mRNA expression analysis (Supporting Information Figure S8). In contrast, identical transcriptional activity was observed between the GPI‐anchor negative and positive subcultures for the remaining GPI‐anchor synthesis genes (Supporting Information Figure S9). High levels of CD52 mRNA were present in both the GPI‐anchor negative and positive subcultures (Supporting Information Figure S9). Restored GPI‐anchor and coinciding CD52 membrane expression was observed in the GPI‐anchor negative subcultures upon retroviral transduction with a construct encoding PIGH, but not with PIGA or a mock construct (Figure 2A). In the GPI‐anchor positive subcultures no effect on GPI‐anchor or CD52 membrane expression was observed upon transduction (Figure 2B).
Figure 2.
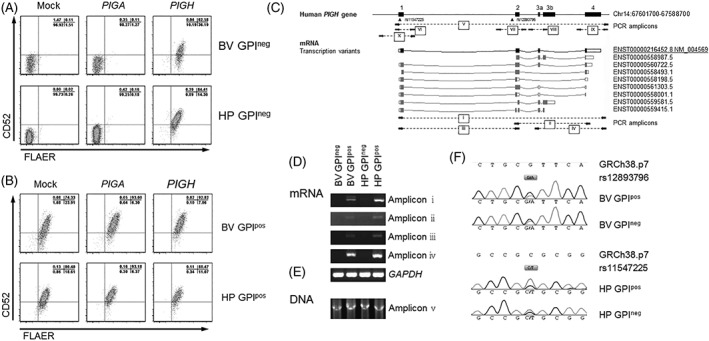
Retroviral transduction with PIGH, and genomic analysis of the PIGH gene loci in the GPIneg and GPIpos B‐ALL subcultures. A and B, Flow cytometric analysis of GPI‐anchor (FLAER) and CD52 membrane expression in (A) GPIneg and (B) GPIpos subcultures of cell lines Leiden‐ALL‐BV (BV‐GPIneg and BV‐GPIpos) and Leiden‐ALL‐HP (HP‐GPIneg and HP‐GPIpos) retrovirally transduced with an empty control construct (mock) or with constructs encoding PIGA or PIGH, coupled to tNGFR as marker gene. Transduction efficiency ranged between 13.6% and 52.9%. Dot plots are gated on tNGFR positive cells. C, Schematic representation of analyses performed on DNA and mRNA isolated from GPIneg and GPIpos subcultures of cell lines Leiden‐ALL‐BV (BV‐GPIneg and BV‐GPIpos) and Leiden‐ALL‐HP (HP‐GPIneg and HP‐GPIpos). The PIGH genomic locus (chromosome 14:67601700‐67588700, GRCh38.p7) is shown, numbered black boxes represent coding exons connected by straight black lines representing intronic regions. SNPs rs12893796 and rs11547225 (dbSNP build 144) are depicted by triangles. PCR amplicons are numbered and indicated as stripped lines connecting the relevant primers (arrows). mRNA transcription variants are depicted by boxes connected with curved lines and identified by their Ensemble transcript number. The protein coding transcript is in black, predicted protein coding mRNA transcription variants are in gray. Closed boxes illustrate the protein coding region and open boxes the 5′ and 3′ untranslated regions. D and E, Gel electrophoresis results for the indicated PCR amplifications on (D) mRNA or (E) DNA isolated from the GPIneg and GPIpos subcultures (GAPDH as loading control). F, Sanger sequencing results from nested PCR amplifications VII (Leiden‐ALL‐BV) and VI (Leiden‐ALL‐HP) with assembly GRCh38.p7 as reference sequence. SNPs rs12893796 and rs11547225 are presented as gray boxes containing the allelic variants
In conclusion, the GPI‐anchor negative phenotype in B‐ALL cells was solely mediated by absence of PIGH mRNA expression.
3.4. Loss of PIGH mRNA expression does not result from a genetic aberration
To investigate if genetic aberrations resulted in loss of PIGH mRNA expression in GPI‐anchor negative B‐ALL cells, we first tested whether the inability to detect PIGH mRNA expression in the GPI‐anchor negative subcultures of the Leiden‐ALL‐BV and ‐HP cell lines was the result of loss of a primer binding site due to alternative splicing of the pre‐mRNA. We performed PCR specific for sections of PIGH mRNA that include all possible transcription variants (Figure 2C, amplicons i‐iv). No amplicons were generated for the GPI‐anchor negative subcultures, whereas all amplicons were generated for the GPI‐anchor positive subcultures (Figure 2D). This shows that inability to detect PIGH mRNA in GPI‐anchor negative subcultures was due to complete absence of PIGH mRNA expression.
To examine if loss of PIGH mRNA expression in the GPI‐anchor negative subcultures resulted from genomic deletion of PIGH, we performed PCR using primers designed to amplify the complete 10 kb PIGH genomic region (Figure 2C, amplicon v). Amplicons of the correct size were obtained for both the GPI‐anchor negative and positive subcultures (Figure 2E), indicating that the gene was present at the genomic level with no detectable deletions or insertions. Nested PCR (Figure 2C, amplicons vi‐vii) followed by Sanger sequencing identified two single nucleotide polymorphisms (SNP, rs12893796 in Leiden‐ALL‐BV, rs11547225 in Leiden‐ALL‐HP) for which both allelic variants were detected in the GPI‐anchor positive subcultures. Both allelic variants were also detected in the GPI‐anchor negative subcultures (Figure 2F), indicating that both alleles of the PIGH gene had been amplified and thus were present at the genomic level. Absence of a focal genomic deletion was further implied by comparable transcriptional activity of genes proximal to the PIGH genetic locus in the GPI‐anchor positive and negative subcultures (Supporting Information Figure S10).
To investigate if a mutation, small deletion, or insertion in the promoter region (starting 630 bp before the transcription start site), at one of the splice sites, or in the gene body was the cause of loss of PIGH mRNA expression, we examined these genetic loci by Sanger sequencing (Figure 2C, amplicons vii‐x). No differences in DNA sequences were found between the GPI‐anchor negative and positive subcultures. Within each amplicon, at least one known SNP was identified for which both allelic variants were detected (data not shown). These SNPs were always detected in both the GPI‐anchor negative and positive subcultures, indicating that each analyzed amplicon originated from both alleles of the PIGH gene.
In summary, the intact PIGH gene was present in both GPI‐anchor negative B‐ALL subcultures, illustrating that loss of PIGH expression in these cells could not be explained by obvious genetic aberrations in the coding gene.
3.5. Loss of PIGH mRNA could be explained by epigenetic control of gene transcription
To explore whether loss of PIGH mRNA expression in GPI‐anchor negative B‐ALL cells resulted from epigenetic down regulation, we analyzed the presence of two predominant types of histone modifications at the PIGH gene locus. We considered histone mark H3K4me3, of which presence is strongly correlated with actively transcribed genes, and histone mark H3K27me3, of which presence correlates with transcriptional gene silencing.20 We performed H3K4me3 and H3K27me3 specific ChIP on DNA isolated from the GPI‐anchor negative subcultures, using the GPI‐anchor positive subcultures as references, followed by qPCR to quantify the relative presence of these histone marks at the PIGH gene locus. Almost complete loss of histone mark H3K4me3 from the PIGH promoter region was found in both GPI‐anchor negative subcultures (Figure 3A). In contrast, presence of histone mark H3K27me3 was increased in both GPI‐anchor negative subcultures, with the largest effect between the Leiden‐ALL‐BV subcultures (Figure 3A). These data imply that the PIGH gene in the GPI‐anchor negative subcultures was transcriptionally silenced.
Figure 3.
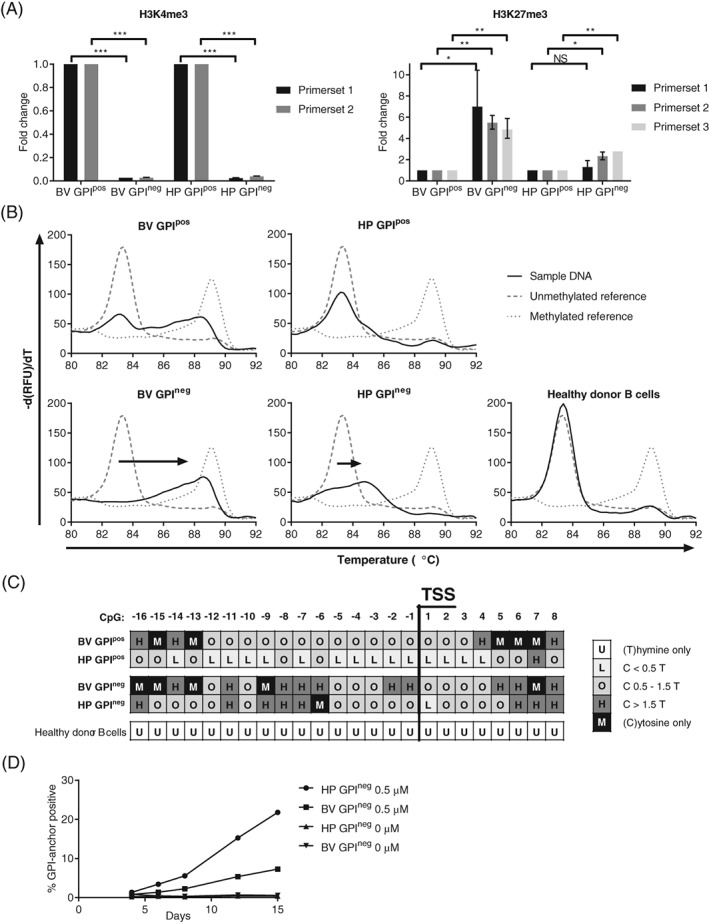
Epigenetic down regulation of PIGH gene transcription in GPIneg B‐ALL subcultures. A, ChIP‐qPCR analysis of the relative presence of histone marks H3K4me3 and H3K27me3 at the PIGH gene location in the GPIneg subcultures compared with the GPIpos subcultures of Leiden‐ALL‐BV and Leiden‐ALL‐HP. PIGH DNA was quantified in H3K4me3 and H3K27me3 ChIP samples by qPCR and compared with a nonimmunoprecipitated DNA reference sample (refDNA) and normalized for a positive control gene (GAPDH for H3K4me3 and MYOD1 for H3K27me3). Bars represent the relative presence of PIGH DNA in the GPIneg compared with the GPIpos subcultures (whiskers represent SD; *P < .05, **P < .01, ***P < .001, NS = not significant; two‐sided unpaired T‐test). Primer set 1 (targeting the region 246‐371 bp downstream of the TSS) and primer set 2 (329‐496 bp downstream of the TSS) used for qPCR of H3K4me3 targeted the PIGH promoter region. Primer set 1 used for qPCR of H3K4me3 doubled as primer set 1 for qPCR of H3K27me3. Primer set 2 (4486‐4570 bp downstream of the TSS) and primer set 3 (6261‐6373 bp downstream of the TSS) used for qPCR of H3K27me3 targeted the PIGH gene body. B, MS‐MCA curves for the PIGH promoter region (−212 bp to +101 bp relative to the TSS, CpGs −19 to +15) on bisulfite converted DNA from the GPIpos and GPIneg B‐ALL subcultures (solid black line). Bisulfite converted DNA from purified healthy donor B cells served as a control. MS‐MCA curves for unmethylated reference DNA (striped gray line, peak T m 83.4°C) and methylated reference DNA (dotted gray line, peak T m 89.0°C) are plotted in each graph. C, Sanger sequencing analysis of the methylation state of 24 individual CpGs in the PIGH promoter region (−161 bp to +51 bp relative to the TSS, CpGs −16 to +8) on bisulfite converted DNA from the GPIpos and GPIneg B‐ALL subcultures and from purified healthy donor B cells. The levels of methylation of individual CpGs were determined by the ratio between the height of the cytosine signal and the thymine signal. D, Percentages of GPI‐anchor positive cells in the GPIneg B‐ALL subcultures following treatment with or without 0.5 μM 5‐aza for 15 days as analyzed by flow cytometry counterstaining with FLAER
Histone modifications are only one part of the interrelated epigenetic code that directs gene transcription. To further investigate whether loss of PIGH mRNA expression resulted from epigenetic down regulation of gene transcription, we analyzed the level of DNA methylation at the PIGH promoter region, which contains a CpG‐island. We performed MS‐MCA (Figure 3B) and Sanger sequencing (Figure 3C) on bisulfite converted DNA from the GPI‐anchor negative and positive subcultures. In the GPI‐anchor positive subcultures, mono‐allelic DNA methylation (Leiden‐ALL‐BV) and unmethylated DNA (Leiden‐ALL‐HP) were observed by MS‐MCA, compatible with transcriptional activity of at least one allele and expression of PIGH mRNA. Since Sanger sequencing cannot distinguish between individual alleles, average levels from the two alleles were measured resulting in mostly intermediate (Leiden‐ALL‐BV) and low (Leiden‐ALL‐HP) levels of methylation at individual CpGs. In the GPI‐anchor negative subculture of Leiden‐ALL‐BV, a shift toward high level of DNA methylation was observed by MS‐MCA and by Sanger sequencing, consistent with bi‐allelic DNA methylation and loss of PIGH transcription. In the GPI‐anchor negative subculture of Leiden‐ALL‐HP, a shift away from unmethylated was observed by MS‐MCA, indicating partial methylation of the analyzed region, and Sanger sequencing analysis showed high levels of methylation in the region directly preceding the transcription start site (TSS) (CpG −11 to −6), but not in the bordering CpGs. Since high levels of methylation in this region were shared between the GPI‐anchor negative subcultures of both Leiden‐ALL‐BV and Leiden‐ALL‐HP, CpGs at this position are likely to be essential for regulation of PIGH transcription and function as a so‐called CpG “traffic light.”21 No CpG methylation was detected at the PIGH promoter region in bisulfite converted DNA from purified healthy donor B cells, further highlighting the abnormal DNA methylation in B‐ALL cells.
To test if PIGH promoter methylation is essential in retaining the GPI‐anchor negative phenotype in B‐ALL cells, we tested whether treatment of the GPI‐anchor negative subcultures with the demethylating agent 5‐aza would restore GPI‐anchor expression. Gradual increase of the percentages of GPI‐anchor positive cells was observed over time in samples treated with 5‐aza in the GPI‐anchor negative subcultures, and not in samples incubated without 5‐aza (Figure 3D).
This illustrates that epigenetic down regulation of PIGH mRNA transcription results in loss of GPI‐anchor expression in B‐ALL cells and can be reverted by 5‐aza treatment.
4. DISCUSSION
Durable remission in patients with B‐ALL is often hampered by early disease relapse due to outgrowth of pre‐existing subclones resistant to treatment.2, 3 In this study, we showed that small GPI/CD52‐negative B‐cell populations were found already at diagnosis in the majority of patients with B‐ALL at frequencies that are in line with previous reports.10, 11 We showed that GPI‐anchor negative B‐cell populations were present in B‐ALL patients carrying various cytogenetic abnormalities, implying that this phenotype can be acquired independent of the primary cause of malignant transformation. Nevertheless, these cells are part of the malignancy as demonstrated by their phenotype and genotype, and their presence within the cell lines generated from primary malignant B‐ALL cells. No GPI‐anchor negative B cells were detected in leukemic samples from patients suffering from mature B‐cell malignancies such as CLL, HCL, and MCL, suggesting that the GPI‐anchor negative phenotype in B‐ALL develops as result of a cellular process that is part of the early stage of B‐cell maturation in which B‐ALL cells are arrested.
Considering the low frequencies of GPI‐anchor negative cells in B‐ALL, loss of GPI‐anchor expression and coinciding loss of the GPI‐anchor associated proteins unlikely provides a direct significant clonal growth advantage. This notion is supported by knock‐out experiments in mice which demonstrated that GPI‐anchor negative lymphocytes do not have intrinsic survival or growth benefits.22, 23 However, loss of the GPI‐anchored protein CD52 renders the cells resistant to the CD52‐targeting therapeutic antibody ALM, as demonstrated by outgrowth of GPI/CD52‐negative escape variants mice engrafted with human B‐ALL.10 This may explain why ALM mono‐therapy displays only limited efficacy in treatment of B‐ALL.8, 9
In PNH, lack of GPI‐anchor expression is linked to a defect in the PIGA gene. We have previously shown that no mutations were present in PIGA in GPI‐anchor negative B‐ALL cells.10 Here, we demonstrated that the GPI‐anchor negative phenotype in B‐ALL cells resulted from loss of PIGH mRNA expression. The PIGH gene is essential in GPI‐anchor synthesis as was previously shown in a CRISPR‐Cas9 knock‐out screen.12 Our study is the first to associate an anomaly related to the PIGH gene with a hematological disorder. Exploration of cancer genome databases did not yield an association between a genetic anomaly in PIGH and B‐ALL (or any other malignancy), potentially as a result of the small contribution of the GPI‐anchor negative cells to the total malignancy.
In contrast to the X‐linked PIGA, PIGH is an autosomal gene located on chromosome 14q24.1, implying that two affected alleles are required for complete loss of PIGH mRNA expression. Molecular analysis revealed that epigenetic silencing rather than gene mutation or deletion resulted in loss of PIGH mRNA expression. Epigenetic silencing of tumor suppressor genes is a frequent event in cancer. B‐ALL cells may be particularly affected by this mechanism as they are arrested in an early stage of B‐cell development at which major epigenetic changes take place to lock‐in the lineage commitment and to initiate and maintain allelic exclusion of one of the immunoglobulin genes.24, 25 Continued exposure to cellular processes triggering these epigenetic changes may lead to silencing of genes that are normally unaffected. In concordance, genome‐wide de novo promoter DNA methylation was recently shown to be common in pediatric patients with B‐ALL.26, 27
Crosstalk between the various components of the epigenetic code and transcription factors renders it difficult to predict whether active gene silencing, via direct targeting by histone‐modifying enzymes or DNA methyltransferases, or passive gene silencing, following the loss of an activating transcription factor or gain of a transcription repressor, had initiated silencing of PIGH gene transcription.26, 28, 29, 30 Irrespective of the mechanism, we demonstrated that silenced PIGH gene expression could be reversed in B‐ALL cells, as illustrated by re‐expression of the GPI‐anchor following treatment with the epigenetic modifying agent 5‐aza. Therefore, addition of epigenetic modifying drugs to ALM monotherapy may prevent ALM resistance.
In summary, the majority of patients with B‐ALL harbor a small GPI/CD52‐negative B‐cell population already at diagnosis. These cells lost PIGH mRNA expression, a key component in GPI‐anchor synthesis. This was not due to a genomic aberration, but rather to epigenetic silencing of PIGH gene transcription. Selective pressure provided by ALM‐treatment may result in the outgrowth of GPI/CD52‐negative escape variants in B‐ALL patients and may be canceled by additional 5‐aza‐2′‐deoxycytidine treatment.
AUTHOR CONTRIBUTIONS
F.C.L. designed and performed research, discussed data, and wrote the article. K.R., H.M.E., W.G.M.K., and S.A.J.V. performed research. W.H.Z. helped with design and performed the promoter methylation assay and discussed data. X.Q. helped with design and performing the chromatin immunoprecipitation and discussed data. M.H.V. designed research and discussed data related to the promoter methylation assay. M.G. and J.N. designed research and discussed data. J.H.F.F., C.J.M.H., and I.J. designed research, discussed data, and wrote the article. All auteurs read and approved the final manuscript.
CONFLICT OF INTEREST
Nothing to report.
Supporting information
Figure S1 Gating strategy for detection of GPI/CD52 negative B cells in primary samples
Representative example of flow cytometric analysis to detect and quantify the presence of GPI/CD52 negative cells in primary samples. Shown is the analysis for sample ALL‐07. Lymphocytes were selected based on forward scatter (FSC) and side scatter (SSC) (25 000 events shown). Within the lymphocyte gate, B cells were defined as CD19+/CD3‐ and T cells as CD3+/CD19‐ (25 000 events shown). Within these gates GPI/CD52 negative cells were defined as FLAER/CD52 negative (lower left quadrant) (all 369 534 events shown).
Figure S2 GPI‐anchor negative B cells were present in the malignant and absent in normal B‐cells within the same sample
Representative examples of flow cytometric analysis of primary B‐ALL samples ALL‐03, ALL‐05, and ALL‐12. Horizontally distributed panels belong to the same sample. Lymphocytes were selected based on forward scatter (FSC) and side scatter (SSC). Within the lymphocyte gate, malignant B cells were defined as CD19+/CD45dim and normal B cells as CD19+/CD45bright. Within these gates FLAER‐staining is shown, showing GPI‐negative cells in the lower left quadrant.
Figure S3 GPI‐anchor and CD52 expression in B‐ALL cells carrying t(4;11) MLL translocation and in sample ALL‐08
Flow cytometric analysis of GPI‐anchor expression (FLAER) and expression of CD52 on samples from patients carrying the t 4, 11 MLL translocation (Sample ALL‐23, ALL‐24, and ALL‐25) and from nonMLL sample ALL‐08. Shown are cells within the lymphocyte gate that were CD19 + CD3‐ (B cells, upper panels) or CD3 + CD19‐(T cells, lower panels). Numbers indicate the percentage of cells within the quadrants.
Figure S4 GPI‐anchor and CD52 expression in PB samples from healthy donors
Flow cytometric analysis of GPI‐anchor expression (FLAER) and expression of CD52 on PB samples from healthy donors. Shown are all cells within the lymphocyte gate (left panels) and cells within the lymphocyte gate that were CD19 + CD3‐ (B cells, right panels). Numbers indicate the percentage of cells within the respective quadrant.
Figure S5 GPI‐anchor and CD52 expression in samples from patients with CLL, HCL, or MCL
Flow cytometric analysis for GPI‐anchor expression (FLAER) and expression of CD52 on PB, BM, or spleen samples from patients with CLL, HCL, or MCL. Shown are cells within the lymphocyte gate that were positive for CD19 and negative for CD3 (B cells). Numbers indicate the percentage of cells within the respective quadrant.
Figure S6 GPI‐anchor and CD52 expression before and after ALM‐treatment in patient ALL‐06
Flow cytometric analysis of GPI‐anchor expression (FLAER) and expression of CD52 on samples taken 3 months before start of ALM‐treatment (left) and 1 month after secession of treatment due to relapse (right). Shown are cells within the lymphocyte gate that were positive for CD19 and negative for CD3 (B cells). Numbers indicate the percentage of cells within the respective quadrant.
Figure S7 GPI‐anchor and CD52 expression on the subcultures of cell lines Leiden‐ALL‐BV and Leiden‐ALL‐HP
Flow cytometric analysis of GPI‐anchor (FLAER) and CD52 membrane expression in the GPI neg and GPI pos subcultures of B‐ALL cell lines Leiden‐ALL‐HP (HP GPI neg and HP GPI pos , respectively) and Leiden‐ALL‐BV (BV GPI neg and BV GPI pos , respectively). Numbers indicate the percentage of cells within the quadrants.
Figure S8 Loss of PIGH mRNA expression in GPI‐anchor negative B‐ALL subcultures
Gel electrophoresis results for PIGH mRNA expression analysis in the GPI neg and GPI pos subcultures of cell lines Leiden‐ALL‐HP (HP GPI neg and HP GPI pos , respectively) and Leiden‐ALL‐BV (BV GPI neg and BV GPI pos , respectively). Equimolar amounts of cDNA were used for PCR amplification. GAPDH was used as a loading control.
Figure S9 Global mRNA expression analysis of the GPI‐anchor synthesis genes in the GPI/CD52‐negative and GPI/CD52‐positve cell cultures
Global mRNA expression analysis of the GPI‐anchor synthesis genes, CD19, and CD52 in cell cultures BV GPI neg , HP GPI neg , BV GPI pos , and HP GPI pos as determined by microarray analysis. Probe background fluorescence is generally between 40‐60.17
Figure S10 No difference in expression of genes proximal to PIGH in GPI/CD52‐negative cell cultures compared with GPI/CD52‐positve cell cultures
Global mRNA expression analysis of genes proximal (1.1Mbp upstream to 1.2Mbp downstream) to the PIGH chromosomal location in cell cultures BV GPI neg , HP GPI neg , BV GPI pos , and HP GPI pos as determined by microarray analysis. Nearest 10 genes for which probes were present on the Human HT‐12 v4 chip are depicted.
Supplementary Table S1 Primer sequences for mRNA expression analysis
Supplementary Table S2 Primer sequences for construct generation, mutational screening, and bisulfite sequencing
ACKNOWLEDGMENTS
We would like to thank Willy Honders and Margot Pont for performing and analyzing the microarray experiments. This work was supported by ‘Frank Sanderse Stichting’ and ‘Doelfonds Leukemie van de Bontius Stichting’. The funding bodies had no role in the design of the study and collection, analysis, and interpretation of data and in writing the manuscript.
Loeff FC, Rijs K, van Egmond EHM, et al. Loss of the GPI‐anchor in B‐lymphoblastic leukemia by epigenetic downregulation of PIGH expression. Am J Hematol. 2019;94:93–102. 10.1002/ajh.25337
Funding information: Doelfonds Leukemie van de Bontius Stichting; Frank Sanderse Stichting
REFERENCES
- 1. Fielding AK, Richards SM, Chopra R, et al. Outcome of 609 adults after relapse of acute lymphoblastic leukemia (ALL); an MRC UKALL12/ECOG 2993 study. Blood. 2007;109(3):944‐950. [DOI] [PubMed] [Google Scholar]
- 2. Mullighan CG, Phillips LA, Su X, et al. Genomic analysis of the clonal origins of relapsed acute lymphoblastic leukemia. Science. 2008;322(5906):1377‐1380. [DOI] [PMC free article] [PubMed] [Google Scholar]
- 3. Hunger SP, Mullighan CG. Redefining ALL classification: toward detecting high‐risk ALL and implementing precision medicine. Blood. 2015;125(26):3977‐3987. [DOI] [PMC free article] [PubMed] [Google Scholar]
- 4. Alinari L, Lapalombella R, Andritsos L, Baiocchi RA, Lin TS, Byrd JC. Alemtuzumab (Campath‐1H) in the treatment of chronic lymphocytic leukemia. Oncogene. 2007;26(25):3644‐3653. [DOI] [PubMed] [Google Scholar]
- 5. Moreton P, Hillmen P. Alemtuzumab therapy in B‐cell lymphoproliferative disorders. Semin Oncol. 2003;30(4):493‐501. [DOI] [PubMed] [Google Scholar]
- 6. Zinzani PL, Corradini P, Gallamini A, et al. Overview of alemtuzumab therapy for the treatment of T‐cell lymphomas. Leuk Lymphoma. 2012;53(5):789‐795. [DOI] [PubMed] [Google Scholar]
- 7. Golay J, Cortiana C, Manganini M, et al. The sensitivity of acute lymphoblastic leukemia cells carrying the t(12;21) translocation to campath‐1H‐mediated cell lysis. Haematologica. 2006;91(3):322‐330. [PubMed] [Google Scholar]
- 8. Angiolillo AL, Yu AL, Reaman G, Ingle AM, Secola R, Adamson PC. A phase II study of Campath‐1H in children with relapsed or refractory acute lymphoblastic leukemia: a Children's Oncology Group report. Pediatr Blood Cancer. 2009;53(6):978‐983. [DOI] [PMC free article] [PubMed] [Google Scholar]
- 9. Gorin NC, Isnard F, Garderet L, et al. Administration of alemtuzumab and G‐CSF to adults with relapsed or refractory acute lymphoblastic leukemia: results of a phase II study. Eur J Haematol. 2013;91(4):315‐321. [DOI] [PubMed] [Google Scholar]
- 10. Nijmeijer BA, van Schie ML, Halkes CJ, Griffioen M, Willemze R, Falkenburg JH. A mechanistic rationale for combining alemtuzumab and rituximab in the treatment of ALL. Blood. 2010;116(26):5930‐5940. [DOI] [PubMed] [Google Scholar]
- 11. Araten DJ, Sanders KJ, Anscher D, Zamechek L, Hunger SP, Ibrahim S. Leukemic blasts with the paroxysmal nocturnal hemoglobinuria phenotype in children with acute lymphoblastic leukemia. Am J Pathol. 2012;181(5):1862‐1869. [DOI] [PMC free article] [PubMed] [Google Scholar]
- 12. Koike‐Yusa H, Li Y, Tan EP, Velasco‐Herrera Mdel C, Yusa K. Genome‐wide recessive genetic screening in mammalian cells with a lentiviral CRISPR‐guide RNA library. Nat Biotechnol. 2014;32(3):267‐273. [DOI] [PubMed] [Google Scholar]
- 13. Ware RE, Rosse WF, Howard TA. Mutations within the Piga gene in patients with paroxysmal nocturnal hemoglobinuria. Blood. 1994;83(9):2418‐2422. [PubMed] [Google Scholar]
- 14. Rosse WF. Paroxysmal nocturnal hemoglobinuria as a molecular disease. Medicine (Baltimore). 1997;76(2):63‐93. [DOI] [PubMed] [Google Scholar]
- 15. Nijmeijer BA, Szuhai K, Goselink HM, et al. Long‐term culture of primary human lymphoblastic leukemia cells in the absence of serum or hematopoietic growth factors. Exp Hematol. 2009;37(3):376‐385. [DOI] [PubMed] [Google Scholar]
- 16. Loeff FC, van Egmond HME, Nijmeijer BA, Falkenburg JHF, Halkes CJ, Jedema I. Complement‐dependent cytotoxicity induced by therapeutic antibodies in B‐cell acute lymphoblastic leukemia is dictated by target antigen expression levels and augmented by loss of membrane‐bound complement inhibitors. Leuk Lymphoma. 2017;58(9):1‐14. [DOI] [PubMed] [Google Scholar]
- 17. Pont MJ, Honders MW, Kremer AN, et al. Microarray gene expression analysis to evaluate cell type specific expression of targets relevant for immunotherapy of hematological malignancies. PloS One. 2016;11(5):e0155165. [DOI] [PMC free article] [PubMed] [Google Scholar]
- 18. Schmidt D, Wilson MD, Spyrou C, Brown GD, Hadfield J, Odom DT. ChIP‐seq: using high‐throughput sequencing to discover protein‐DNA interactions. Methods. 2009;48(3):240‐248. [DOI] [PMC free article] [PubMed] [Google Scholar]
- 19. Livak KJ, Schmittgen TD. Analysis of relative gene expression data using real‐time quantitative PCR and the 2(−Delta Delta C[T]) Method. Methods. 2001;25(4):402‐408. [DOI] [PubMed] [Google Scholar]
- 20. Barski A, Cuddapah S, Cui K, et al. High‐resolution profiling of histone methylations in the human genome. Cell. 2007;129(4):823‐837. [DOI] [PubMed] [Google Scholar]
- 21. Medvedeva YA, Khamis AM, Kulakovskiy IV, et al. Effects of cytosine methylation on transcription factor binding sites. BMC Genomics. 2014;15:119. [DOI] [PMC free article] [PubMed] [Google Scholar]
- 22. Kulkarni S, Bessler M. The effect of GPI‐anchor deficiency on apoptosis in mice carrying a Piga gene mutation in hematopoietic cells. J Leukoc Biol. 2002;72(6):1228‐1233. [PubMed] [Google Scholar]
- 23. Keller P, Tremml G, Rosti V, Bessler M. X inactivation and somatic cell selection rescue female mice carrying a Piga‐null mutation. Proc Natl Acad Sci U S A. 1999;96(13):7479‐7483. [DOI] [PMC free article] [PubMed] [Google Scholar]
- 24. Cedar H, Bergman Y. Epigenetics of haematopoietic cell development. Nat Rev Immunol. 2011;11(7):478‐488. [DOI] [PubMed] [Google Scholar]
- 25. Lee ST, Xiao Y, Muench MO, et al. A global DNA methylation and gene expression analysis of early human B‐cell development reveals a demethylation signature and transcription factor network. Nucleic Acids Res. 2012;40(22):11339‐11351. [DOI] [PMC free article] [PubMed] [Google Scholar]
- 26. Burke MJ, Bhatla T. Epigenetic modifications in pediatric acute lymphoblastic leukemia. Front Pediatr. 2014;2:2296‐2360. [DOI] [PMC free article] [PubMed] [Google Scholar]
- 27. Lee ST, Muench MO, Fomin ME, et al. Epigenetic remodeling in B‐cell acute lymphoblastic leukemia occurs in two tracks and employs embryonic stem cell‐like signatures. Nucleic Acids Res. 2015;43(5):2590‐2602. [DOI] [PMC free article] [PubMed] [Google Scholar]
- 28. Cedar H, Bergman Y. Linking DNA methylation and histone modification: patterns and paradigms. Nat Rev Genet. 2009;10(5):295‐304. [DOI] [PubMed] [Google Scholar]
- 29. McCabe MT, Brandes JC, Vertino PM. Cancer DNA methylation: molecular mechanisms and clinical implications. Clin Cancer Res. 2009;15(12):3927‐3937. [DOI] [PMC free article] [PubMed] [Google Scholar]
- 30. Tycko B. Epigenetic gene silencing in cancer. J Clin Invest. 2000;105(4):401‐407. [DOI] [PMC free article] [PubMed] [Google Scholar]
Associated Data
This section collects any data citations, data availability statements, or supplementary materials included in this article.
Supplementary Materials
Figure S1 Gating strategy for detection of GPI/CD52 negative B cells in primary samples
Representative example of flow cytometric analysis to detect and quantify the presence of GPI/CD52 negative cells in primary samples. Shown is the analysis for sample ALL‐07. Lymphocytes were selected based on forward scatter (FSC) and side scatter (SSC) (25 000 events shown). Within the lymphocyte gate, B cells were defined as CD19+/CD3‐ and T cells as CD3+/CD19‐ (25 000 events shown). Within these gates GPI/CD52 negative cells were defined as FLAER/CD52 negative (lower left quadrant) (all 369 534 events shown).
Figure S2 GPI‐anchor negative B cells were present in the malignant and absent in normal B‐cells within the same sample
Representative examples of flow cytometric analysis of primary B‐ALL samples ALL‐03, ALL‐05, and ALL‐12. Horizontally distributed panels belong to the same sample. Lymphocytes were selected based on forward scatter (FSC) and side scatter (SSC). Within the lymphocyte gate, malignant B cells were defined as CD19+/CD45dim and normal B cells as CD19+/CD45bright. Within these gates FLAER‐staining is shown, showing GPI‐negative cells in the lower left quadrant.
Figure S3 GPI‐anchor and CD52 expression in B‐ALL cells carrying t(4;11) MLL translocation and in sample ALL‐08
Flow cytometric analysis of GPI‐anchor expression (FLAER) and expression of CD52 on samples from patients carrying the t 4, 11 MLL translocation (Sample ALL‐23, ALL‐24, and ALL‐25) and from nonMLL sample ALL‐08. Shown are cells within the lymphocyte gate that were CD19 + CD3‐ (B cells, upper panels) or CD3 + CD19‐(T cells, lower panels). Numbers indicate the percentage of cells within the quadrants.
Figure S4 GPI‐anchor and CD52 expression in PB samples from healthy donors
Flow cytometric analysis of GPI‐anchor expression (FLAER) and expression of CD52 on PB samples from healthy donors. Shown are all cells within the lymphocyte gate (left panels) and cells within the lymphocyte gate that were CD19 + CD3‐ (B cells, right panels). Numbers indicate the percentage of cells within the respective quadrant.
Figure S5 GPI‐anchor and CD52 expression in samples from patients with CLL, HCL, or MCL
Flow cytometric analysis for GPI‐anchor expression (FLAER) and expression of CD52 on PB, BM, or spleen samples from patients with CLL, HCL, or MCL. Shown are cells within the lymphocyte gate that were positive for CD19 and negative for CD3 (B cells). Numbers indicate the percentage of cells within the respective quadrant.
Figure S6 GPI‐anchor and CD52 expression before and after ALM‐treatment in patient ALL‐06
Flow cytometric analysis of GPI‐anchor expression (FLAER) and expression of CD52 on samples taken 3 months before start of ALM‐treatment (left) and 1 month after secession of treatment due to relapse (right). Shown are cells within the lymphocyte gate that were positive for CD19 and negative for CD3 (B cells). Numbers indicate the percentage of cells within the respective quadrant.
Figure S7 GPI‐anchor and CD52 expression on the subcultures of cell lines Leiden‐ALL‐BV and Leiden‐ALL‐HP
Flow cytometric analysis of GPI‐anchor (FLAER) and CD52 membrane expression in the GPI neg and GPI pos subcultures of B‐ALL cell lines Leiden‐ALL‐HP (HP GPI neg and HP GPI pos , respectively) and Leiden‐ALL‐BV (BV GPI neg and BV GPI pos , respectively). Numbers indicate the percentage of cells within the quadrants.
Figure S8 Loss of PIGH mRNA expression in GPI‐anchor negative B‐ALL subcultures
Gel electrophoresis results for PIGH mRNA expression analysis in the GPI neg and GPI pos subcultures of cell lines Leiden‐ALL‐HP (HP GPI neg and HP GPI pos , respectively) and Leiden‐ALL‐BV (BV GPI neg and BV GPI pos , respectively). Equimolar amounts of cDNA were used for PCR amplification. GAPDH was used as a loading control.
Figure S9 Global mRNA expression analysis of the GPI‐anchor synthesis genes in the GPI/CD52‐negative and GPI/CD52‐positve cell cultures
Global mRNA expression analysis of the GPI‐anchor synthesis genes, CD19, and CD52 in cell cultures BV GPI neg , HP GPI neg , BV GPI pos , and HP GPI pos as determined by microarray analysis. Probe background fluorescence is generally between 40‐60.17
Figure S10 No difference in expression of genes proximal to PIGH in GPI/CD52‐negative cell cultures compared with GPI/CD52‐positve cell cultures
Global mRNA expression analysis of genes proximal (1.1Mbp upstream to 1.2Mbp downstream) to the PIGH chromosomal location in cell cultures BV GPI neg , HP GPI neg , BV GPI pos , and HP GPI pos as determined by microarray analysis. Nearest 10 genes for which probes were present on the Human HT‐12 v4 chip are depicted.
Supplementary Table S1 Primer sequences for mRNA expression analysis
Supplementary Table S2 Primer sequences for construct generation, mutational screening, and bisulfite sequencing