

Abstract
Aims
Glucagon‐like peptide‐1 (GLP‐1) receptor agonists are appealing as glucose‐lowering therapy for individuals with type 2 diabetes mellitus (T2DM) as they also reduce body weight and are associated with low rates of hypoglycaemia. This analysis assessed the long‐term cost‐effectiveness of semaglutide 0.5 and 1 mg vs dulaglutide 1.5 mg (two once‐weekly GLP‐1 receptor agonists) from a UK healthcare payer perspective, based on the head‐to‐head SUSTAIN 7 trial, to inform healthcare decision making.
Materials and Methods
Long‐term outcomes were projected using the IQVIA CORE Diabetes Model (version 9.0). Baseline cohort characteristics, changes in physiological parameters and adverse event rates were derived from the 40‐week SUSTAIN 7 trial. Costs to a healthcare payer were assessed, and these captured pharmacy costs and costs of complications. Utilities were taken from published sources.
Results
Once‐weekly semaglutide 0.5 and 1 mg were associated with improvements in quality‐adjusted life expectancy of 0.04 and 0.10 quality‐adjusted life years, respectively, compared with dulaglutide 1.5 mg. Clinical benefits were achieved at reduced costs, with lifetime cost savings of GBP 35 with once‐weekly semaglutide 0.5 mg and GBP 106 with the once‐weekly semaglutide 1 mg, resulting from fewer diabetes‐related complications due to better glycaemic control. Therefore, both doses of once‐weekly semaglutide were considered dominant vs dulaglutide 1.5 mg (improving outcomes and reducing costs).
Conclusions
Compared with treatment with dulaglutide, once‐weekly semaglutide represents a cost‐effective option for treating individuals in the UK with T2DM who are not achieving glycaemic control with metformin, projected to both improve clinical outcomes and reduce costs.
Keywords: antidiabetic drug, cost‐effectiveness, GLP‐1 analogue, incretin therapy
1. INTRODUCTION
Improving glycaemic control remains a key focus of care for individuals with type 2 diabetes mellitus (T2DM), and landmark studies show that good glycaemic control can reduce the incidence of diabetes‐related complications.1, 2, 3, 4, 5 Guidelines from the National Institute for Health and Care Excellence (NICE) recommend a glycated haemoglobin (HbA1c) target of 6.5% (48 mmol/mol) for individuals with T2DM who are managed with lifestyle modifications and a single drug, and a target of 7% (53 mmol/mol) for individuals with T2DM who are not adequately controlled by a single glucose‐lowering drug.6 In addition, there is substantial evidence that multifactorial care, targeting not only glycaemic control but also blood pressure, serum lipids, body weight and hypoglycaemia risk, is associated with a reduced risk of complications.7, 8, 9, 10 Consequently, NICE guidelines recommend a weight loss target of 5% to 10% of body weight and a blood pressure target of below 140/80 mmHg, in conjunction with glycaemic control targets.6
A significant number of individuals with T2DM in the UK are not reaching recommended targets. Data from the National Diabetes Audit show that during 2016–2017, one third of the individuals with T2DM in England and Wales had an HbA1c value above 7.5% (58 mmol/mol), and one quarter had blood pressure above 140/80 mmHg.11 In Scotland, over 40% of the individuals with T2DM had an HbA1c value above 7.5% (58 mmol/mol) and one quarter had systolic blood pressure greater than 140 mmHg in 2016.12 Therefore, there is a significant need to improve care for individuals with T2DM in the UK. Bringing a greater proportion of individuals with T2DM to glycaemic control and multifactorial treatment targets can improve long‐term outcomes for patients and reduce the costs of treating diabetes‐related complications for healthcare providers and UK society as a whole. This is key in optimizing the use of the limited resources within the National Health Service (NHS).
In addition to its impact on glycaemic control, glucagon‐like peptide 1 (GLP‐1) receptor agonist therapy is associated with weight loss, as opposed to other treatment options, such as sulfonylurea and thiazolidinediones which are associated with weight gain, or dipeptidyl peptidase‐4 (DPP‐4) inhibitors which are weight neutral.13 Sodium‐glucose co‐transporter‐2 (SGLT‐2) inhibitors are the only other second‐line treatment option associated with weight loss, but these are less efficacious than GLP‐1 receptor agonists in terms of glucose‐lowering.14, 15 Once‐weekly semaglutide, a novel GLP‐1 receptor analogue, has been approved for use in Europe.16 Other GLP‐1 receptor agonists that are approved for once‐weekly administration include dulaglutide and exenatide extended‐release.17, 18 The SUSTAIN clinical trial programme found that once‐weekly semaglutide was more efficacious in terms of both HbA1c and weight reduction than exenatide extended‐release and dulaglutide, with a similar side‐effect profile, in head‐to‐head studies.19, 20 Additionally, a network meta‐analysis (NMA) has shown that once‐weekly semaglutide is more efficacious than other GLP‐1 receptor agonists.21
The SUSTAIN 7 clinical trial assessed the efficacy and safety of once‐weekly semaglutide vs dulaglutide.20 The SUSTAIN 7 trial was a 40‐week, randomized, open‐label trial comparing once‐weekly semaglutide 0.5 mg with dulaglutide 0.75 mg, and comparing once‐weekly semaglutide 1 mg with dulaglutide 1.5 mg. The study included individuals with T2DM who were not achieving glycaemic control, defined as HbA1c 7.0% to 10.5% (53‐91 mmol/mol) with metformin. Pre‐specified statistical analyses indicated that once‐weekly semaglutide 1 mg was associated with significantly greater reductions in HbA1c (−1.8% vs −1.4% [−19.4 vs −14.9 mmol/mol]; P < 0.001) and body weight (−6.5 kg vs −3.0 kg; P < 0.001) vs dulaglutide 1.5 mg.20 Post‐hoc analysis has shown that both once‐weekly semaglutide and dulaglutide were associated with greater weight reduction in patients with a higher body mass index (BMI) at baseline, and once‐weekly semaglutide was associated with greater reductions than dulaglutide across all baseline BMI sub‐groups.22 As dulaglutide 0.75 mg is not considered a maintenance dose in dual therapy by the European Medicines Agency (EMA), it is not included in the present analysis.17
The aim of the present study was to assess the long‐term cost‐effectiveness of both doses of once‐weekly semaglutide vs dulaglutide 1.5 mg for treatment of individuals with T2DM who are not achieving glycaemic control with metformin, based on SUSTAIN 7 clinical trial data from the perspective of a UK healthcare payer.
2. MATERIALS AND METHODS
2.1. IQVIA CORE Diabetes Model
A cost‐effectiveness analysis was performed using the IQVIA CORE Diabetes Model (CDM), the architecture and capabilities of which have been previously published.23 Projected long‐term outcomes have been validated against real‐life data in 2004 and more recently in 2014.24, 25 Model outputs include complication rates and time to onset of complications, life expectancy, quality‐adjusted life expectancy expressed in quality‐adjusted life years (QALYs), direct costs and incremental cost‐effectiveness ratios (ICERs), as well as cost‐effectiveness scatterplots and acceptability curves. Version 9.0 is the most recent release of the CDM and was used for all analyses, with the UKPDS 68 risk equations applied for prediction of risk of cardiovascular complications.26 Base case and sensitivity analyses were performed using a first‐order Monte Carlo approach, with probabilistic sensitivity analysis (PSA) performed separately using a second‐order Monte Carlo approach. Clinical and cost outcomes were discounted at 3.5% per annum, as per NICE guidelines.27 Outcomes were projected over patient lifetimes, in line with guidance on the assessment of cost‐effectiveness of interventions for diabetes.27, 28 The model takes into account mortality as a result of diabetes‐related complications and background mortality based on UK‐specific life tables.29
2.2. Baseline cohort characteristics and initial treatment effects
Baseline cohort characteristics for the modelling analysis were taken from the SUSTAIN 7 study.20 The mean (standard deviation [SD]) age of the cohort was 56 (10.6) years, with a mean duration of T2DM of 7.4 (5.7) years, mean HbA1c of 8.2 (0.9)% (66.1 [10.1] mmol/mol), and mean BMI of 33.5 (6.8) kg/m2. Alcohol and tobacco consumption were assumed to be the same as that of the general UK population, as these data were not collected in the SUSTAIN 7 study.30, 31 Changes in physiological parameters with once‐weekly semaglutide and dulaglutide were based on mean changes from baseline at 40 weeks in the SUSTAIN 7 study, with hypoglycaemic events assessed across the duration of the trial (Table 1).20 Both statistically and non‐statistically significant differences between the treatment arms were included. Pre‐specified statistical analyses assessed the statistical significance of differences in treatment effects between once‐weekly semaglutide 1 mg and dulaglutide 1.5 mg, but post‐hoc analyses were required to determine the statistical significance of differences in treatment effects between once‐weekly semaglutide 0.5 mg and dulaglutide 1.5 mg. Data were taken from pre‐specified endpoints wherever possible, but in order to fulfil all data requirements for an analysis using the CDM, a number of analyses of post‐hoc endpoints were required, including serum lipids and hypoglycaemic events, to ensure that definitions met those used in the IQVIA CORE Diabetes Model.
Table 1.
Treatment effects and adverse event rates
| Parameter | Mean (standard error) | ||
|---|---|---|---|
| Once‐weekly semaglutide 0.5 mg | Once‐weekly semaglutide 1 mg | Dulaglutide 1.5 mg | |
| Physiological parameters (applied in the first year of the analysis) | |||
| HbA1c (%) | −1.5 (0.06) | −1.8 (0.06)* | −1.4 (0.06) |
| HbA1c (mmol/mol) | −16.5 (0.6)) | −19.4 (0.6)* | −14.9 (0.6) |
| Systolic blood pressure (mmHg) | −2.4 (0.8) | −4.9 (0.8) | −2.9 (0.8) |
| Diastolic blood pressure (mmHg) | −0.6 (0.5) | −2.0 (0.5)* | 0.0 (0.5) |
| Total cholesterol (mg/dL) | −7.0 (1.7) | −5.2 (1.8) | −2.6 (1.8) |
| HDL cholesterol (mg/dL) | −0.5 (0.3)* | 0.7 (0.4) | 0.8 (0.4) |
| LDL cholesterol (mg/dL) | −3.1 (1.5) | −0.2 (1.6) | 0.7 (1.5) |
| Triglycerides (mg/dL) | −14.3 (3.1) | −21.8 (2.9) | −16.5 (3.0) |
| BMI (kg/m2) | −1.6 (0.1)* | −2.3 (0.1)* | −1.1 (0.1) |
| Estimated glomerular filtration rate (mL/min/1.73 m2) | −2.5 (0.6) | −2.7 (0.6) | −3.8 (0.5) |
| Adverse event rates (applied in the first 3 years of the analysis) | |||
| Non‐severe hypoglycaemia event rate (events per 100 patient years) | 1.3 | 2.6 | 1.3 |
| Severe hypoglycaemia event rate (events per 100 patient years) | 0.00 | 0.4 | 0.8 |
| Proportion of non‐severe hypoglycaemic events that are nocturnal | 0.00 | 0.00 | 0.00 |
| Proportion of severe hypoglycaemic events that are nocturnal | 0.00 | 0.00 | 0.00 |
Abbreviations: BMI, body mass index; HbA1c, glycated haemoglobin; HDL, high‐density lipoprotein; LDL, low‐density lipoprotein.
Statistically significant difference at 95% confidence level vs dulaglutide 1.5 mg. Lipid values are presented in mg/dL, as these are required by the IQVIA CORE Diabetes Model. Total cholesterol, HDL cholesterol and LDL cholesterol values can be converted from mg/dL to mmol/L by multiplying by 38.67. Triglyceride values can be converted from mg/dL to mmol/L by multiplying by 88.5.
2.3. Treatment switching and long‐term parameter progression
A simple treatment algorithm which assumed that patients received once‐weekly semaglutide or dulaglutide for 3 years was employed, as per previous long‐term cost‐effectiveness analyses of GLP‐1 receptor agonists submitted to NICE and published in peer‐reviewed journals.32, 33, 34, 35 This is also supported by data from general practice in the European Union big five markets, which reported a mean duration of treatment with GLP‐1 receptor agonists of 29.35 months, rounded to 3 years, as treatment switching can occur only at the end of an annual cycle in the CDM.36 After 3 years, treatment with once‐weekly semaglutide or dulaglutide was discontinued and patients were assumed to intensify to basal insulin therapy with the most commonly used basal insulin analogue available in the UK, insulin glargine, with the cost of the least expensive, biosimilar version of insulin glargine applied (Abasaglar). Patients continued this treatment for the remainder of their lifetimes. It should be noted that further treatment switching, such as switching to basal‐bolus insulin, would not have affected the differences in clinical outcomes and the costs between treatment arms, provided that it occurred at the same time point. Hypoglycaemic events following intensification were modelled based on the UK Hypoglycaemia Study Group and were equal in all treatment arms.37
After applying the treatment effects in the first year of the analysis, benefits in terms of HbA1c and BMI were assumed to persist for the 3 years during which patients received GLP‐1 receptor agonist treatment, with differences abolished upon treatment intensification. Upon intensification, HbA1c was brought to 7% (53 mmol/mol) in all treatment arms, based on guidelines released by NICE (although a patient‐centred approach may result in modification of this goal).6 HbA1c remained equal in all treatment arms for the remainder of the analysis. BMI returned to baseline following intensification. Therefore, no differences in HbA1c and BMI were seen following treatment intensification and, while clinical practice may vary among patients in the UK, this resulted in a balanced cost‐effectiveness analysis, with differences maintained only while there were differences in costs. Alternative treatment‐switching and parameter‐progression assumptions were explored in sensitivity analyses.
2.4. Costs and utilities
Costs were accounted from the perspective of a UK healthcare payer, with all costs expressed in 2016 pounds sterling (GBP). Unit costs of T2DM medications were taken from the Monthly Index of Medical Specialities (MIMS) database and were used to calculate annual treatment costs, with resource use based on the SUSTAIN 7 trial.20, 38 Annual costs of treatment with once‐weekly semaglutide and dulaglutide were equivalent. Following intensification after 3 years, patients were assumed to receive 40 IU of basal insulin, based on the defined daily dose.
Costs associated with treatment of diabetes‐related complications were sourced from a systematic literature review, conducted in 2017, which identified UK‐specific costs from published sources.39, 40, 41, 42, 43, 44, 45, 46, 47, 48, 49, 50 Costs were inflated to 2016 values where necessary, using the Health and Community Health Services Index (Appendix S1).51
Utilities were taken from a 2014 review by Beaudet et al, with the cost of hypoglycaemia disutilities coming from Evans et al 2013, published after the literature searches by Beaudet et al had been completed.52, 53 Beaudet et al reviewed the methods of identified publications to ensure that they met the criteria of the NICE reference case. Values used in the present analysis are shown in Appendix S1. Quality‐adjusted life expectancy was assessed using the CORE Default Method, which involves taking the lowest state utility associated with existing complications and adding event disutilities for any events that occur during that year to create annual utility scores for each simulated patient.
2.5. Identifying key drivers of clinical outcomes
To identify the key drivers of outcomes with once‐weekly semaglutide 0.5 and 1 mg compared with dulaglutide 1.5 mg, a series of five simulations were run for each comparison. In each analysis, only the difference in one of the following was applied in the once‐weekly semaglutide arm: HbA1c, blood pressure (systolic and diastolic), serum lipids, BMI and hypoglycaemic event rates. All other parameters were equal to the dulaglutide 1.5 mg arm, allowing assessment of the relative impact of each aspect on long‐term outcomes.
2.6. Sensitivity analyses
A series of sensitivity analyses were performed to assess the robustness of the base case findings. An analysis was performed with only the statistically significant differences in treatment effects applied in the once‐weekly semaglutide arms: high‐density lipoprotein (HDL) cholesterol and BMI in the once‐weekly semaglutide 0.5 mg comparison, HbA1c, diastolic blood pressure and BMI in the once‐weekly semaglutide 1 mg comparison (Table 1). Simulations were run with time horizons of 10, 25 and 35 years. It should be noted that a time horizon of 50 years was required for all modelled patients to have died; therefore, shorter time horizons do not capture all complications and costs. Simulations were performed with discount rates of 0% and 6%. Treatment effects were applied in an alternative cohort, with baseline data taken from the NICE THIN cohort (Appendix S1), chosen, as in the development of the NICE T2DM treatment guidelines (NG28), to reflect a typical cohort of individuals with T2DM in the UK.54
Alternative parameter progressions and treatment effects were assessed in a series of analyses. Base case analyses assumed that the BMI benefit associated with once‐weekly semaglutide was abolished upon treatment switching so an alternative was explored, with BMI differences maintained for the duration of the simulation. In a separate analysis, the UKPDS HbA1c progression equation was applied in all arms from initiation of the simulation, resulting in an increase in HbA1c over time, with the differences between arms gradually reduced. Simulations were also performed, applying the upper and lower limits of the 95% confidence intervals of the estimated treatment differences in HbA1c and BMI.
Simulations were performed with the year of treatment switching brought forward to the end of year 2 and pushed back to the end of year 5. An additional scenario was prepared, applying the UKPDS HbA1c progression equation and with treatment switching occurring when HbA1c exceeded 7.5% (58 mmol/mol), the threshold for treatment intensification according to the NICE guidelines.6 The impact of alternative insulin costs following intensification was explored by applying the cost of neutral protamine Hagedorn (NPH) insulin. The effect of over‐ or underestimating the direct cost of treating diabetes‐related complications was investigated in two scenarios, with costs increased and decreased by 10%.
An update to the CDM, incorporating data from the UKPDS 82, has been released and an analysis using these risk equations to predict cardiovascular events was run. Whilst a validation study of the revised model has been published, the proprietors of the model suggest that the update is used in a sensitivity analysis, with the previous version being used in the base case.25 Alternative utilities relating to BMI and hypoglycaemic events were applied to two scenarios, applying a BMI disutility from Lee et al and disutilities relating to hypoglycaemic events from Currie et al (Appendix S1).55
PSA was performed using the predefined function in the CDM. Cohort characteristics, treatment effects, and complication costs and utilities were sampled from distributions and the simulation was carried out using a second‐order Monte Carlo approach. Sampling around model inputs allows the uncertainty around these inputs to be captured and the confidence in the model outputs to be assessed.
3. RESULTS
3.1. Base case analysis
Projections of long‐term clinical outcomes in individuals with T2DM in the UK who were not achieving glycaemic control with metformin indicated that once‐weekly semaglutide 0.5 and 1 mg were associated with improvements in discounted life expectancy of 0.04 and 0.10 years, respectively, and discounted quality‐adjusted life expectancy of 0.04 and 0.10 QALYs, respectively, compared with dulaglutide 1.5 mg, with all differences found to be statistically significant (Table 2). Improved clinical outcomes were the result of reduced cumulative incidence and delayed time to onset of diabetes‐related complications over patient lifetimes, with benefits observed across all micro‐ and macrovascular complications included in the analysis (Appendix S1).
Table 2.
Long‐term cost‐effectiveness outcomes in the base case analysis
| Health outcomes | Once‐weekly semaglutide 0.5 mg | Dulaglutide 1.5 mg | Difference |
|---|---|---|---|
| Discounted life expectancy (years) | 13.64 (0.18) | 13.60 (0.18) | +0.04 (+0.02 to +0.05) |
| Discounted quality‐adjusted life expectancy (QALYs) | 9.00 (0.12) | 8.96 (0.12) | +0.04 (+0.03 to +0.05) |
| Discounted direct costs (GBP) | 21 659 (562) | 21 693 (538) | −35 (−81 to +12) |
| ICER (GBP per QALY gained) | Once‐weekly semaglutide dominant | ||
| Health outcomes | Once‐weekly semaglutide 1 mg | Dulaglutide 1.5 mg | Difference |
|---|---|---|---|
| Discounted life expectancy (years) | 13.70 (0.19) | 13.60 (0.18) | +0.10 (+0.08 to +0.11) |
| Discounted quality‐adjusted life expectancy (QALYs) | 9.06 (0.13) | 8.96 (0.12) | +0.10 (+0.09 to +0.11) |
| Discounted direct costs (GBP) | 21 588 (557) | 21 693 (538) | −106 (−151 to −60) |
| ICER (GBP per QALY gained) | Once‐weekly semaglutide dominant | ||
Abbreviations: GBP, 2016 pounds sterling; ICER, incremental cost‐effectiveness ratio; QALYs, quality‐adjusted life years. Values are means (standard deviation) for outcomes in each arm and mean (95% confidence interval) for differences. Life expectancy and quality‐adjusted life expectancy outcomes are rounded to two decimal places.
Once‐weekly semaglutide 0.5 and 1 mg were associated with overall cost savings of GBP 35 (not statistically significant) and GBP 106 (statistically significant), respectively, vs dulaglutide 1.5 mg over a patient's lifetime (Table 2). Differences between the treatment arms are relatively small, as differences in HbA1c and BMI were assumed to be maintained for only 3 years in the modelling analysis. Both doses of once‐weekly semaglutide were associated with small increases in treatment costs because of increased survival, despite equivalent treatment costs with once‐weekly semaglutide and dulaglutide. However, this was entirely offset by the reduced costs associated with diabetes‐related complications, most notably, ophthalmic and cardiovascular complications, with once‐weekly semaglutide 0.5 mg (both resulting in cost savings of GBP 17) and avoided cardiovascular complications with once‐weekly 1 mg (resulting in cost savings of GBP 96).
Projection of long‐term outcomes indicated that both life expectancy and quality‐adjusted life expectancy were improved with once‐weekly semaglutide 0.5 and 1 mg treatment compared with dulaglutide 1.5 mg, at a reduced cost from a healthcare payer perspective. Therefore, once‐weekly semaglutide 0.5 and 1 mg were considered dominant vs dulaglutide 1.5 mg for treatment of individuals with T2DM in the UK who were not achieving glycaemic control with metformin.
3.2. Key drivers of clinical outcomes
Testing for the key drivers of quality‐adjusted life expectancy benefits showed differences between the two once‐weekly semaglutide doses (Table 3). With once‐weekly semaglutide 0.5 mg, the greater HbA1c reduction vs dulaglutide (−1.5% vs −1.4% [16.5 vs 14.9 mmol/mol]) was the biggest contributor to improved clinical outcomes. In the comparison of once‐weekly semaglutide 1 mg vs dulaglutide, the greater BMI reduction (−2.33 kg/m2 vs −1.08 kg/m2) was the biggest contributor to improved clinical outcomes, followed by the greater reductions in HbA1c (−1.8% vs −1.4% [19.4 vs 14.9 mmol/mol]) and blood pressure (systolic blood pressure, −4.9 mm Hg vs −2.9 mm Hg and diastolic blood pressure, −2.1 mm Hg vs 0.0 mmHg).
Table 3.
Key drivers of clinical differences between once‐weekly semaglutide and dulaglutide
| Difference in quality‐adjusted life expectancy (QALYs) | ||
|---|---|---|
| Analysis | Once‐weekly semaglutide 0.5 mg versus dulaglutide 1.5 mg | Once‐weekly semaglutide 1 mg versus dulaglutide 1.5 mg |
| Base case analysis | +0.04 | +0.10 |
| HbA1c difference only | +0.02 | +0.02 |
| Blood pressure difference only | 0.00 | +0.02 |
| Lipid difference only | 0.00 | 0.00 |
| BMI difference only | +0.01 | +0.03 |
| Hypoglycaemia difference only | 0.00 | 0.00 |
Abbreviations: BMI, body mass index; HbA1c, glycated haemoglobin; QALY, quality‐adjusted life year. Quality‐adjusted life expectancy outcomes are rounded to two decimal places.
3.3. Sensitivity analyses
Sensitivity analyses showed that the base case results were robust to changes in the input parameters and assumptions used, with both doses of once‐weekly semaglutide remaining dominant in all except one scenario each (Table 4). Including only the statistically significant differences between semaglutide 0.5 mg and dulaglutide 1.5 mg led to decreased clinical benefits and increased incremental costs, yielding an ICER of GBP 18446 per QALY gained. The only differences between treatment arms in this scenario were in BMI and HDL cholesterol; as such, the greater reduction in HbA1c with once‐weekly semaglutide 0.5 mg, the key driver of improved clinical outcomes, was no longer applied.
Table 4.
Sensitivity analysis results
| Analysis | Discounted quality‐adjusted life expectancy (QALYs) | Discounted direct costs (GBP) | ICER (GBP per QALY gained) | ||||
|---|---|---|---|---|---|---|---|
| Once‐weekly semaglutide 1 mg | Dulaglutide 1.5 mg | Difference | Once‐weekly semaglutide 1 mg | Dulaglutide 1.5 mg | Difference | ||
| Base case | 9.06 | 8.96 | +0.10 | 21 588 | 21 693 | −106 | Once‐weekly semaglutide dominant |
| Statistically significant differences only | 9.03 | 8.96 | +0.07 | 21 642 | 21 693 | −52 | Once‐weekly semaglutide dominant |
| 35‐year time horizon | 9.01 | 8.92 | +0.08 | 21 266 | 21 467 | −201 | Once‐weekly semaglutide dominant |
| 20‐year time horizon | 7.81 | 7.74 | +0.07 | 16 957 | 17 136 | −179 | Once‐weekly semaglutide dominant |
| 10‐year time horizon | 5.17 | 5.13 | +0.04 | 10 167 | 10 287 | −120 | Once‐weekly semaglutide dominant |
| 0% discount rates | 13.69 | 13.53 | +0.16 | 35 436 | 35 564 | −128 | Once‐weekly semaglutide dominant |
| 6% discount rates | 7.13 | 7.05 | +0.08 | 16 238 | 16 329 | −90 | Once‐weekly semaglutide dominant |
| NICE (THIN) baseline cohort data | 8.86 | 8.78 | +0.08 | 19 261 | 19 471 | −210 | Once‐weekly semaglutide dominant |
| BMI difference maintained for patient lifetimes | 9.15 | 8.96 | +0.19 | 21 586 | 21 693 | −107 | Once‐weekly semaglutide dominant |
| UKPDS HbA1c creep for duration of the analysis (no change upon treatment intensification) | 8.57 | 8.47 | +0.11 | 24 517 | 24 722 | −205 | Once‐weekly semaglutide dominant |
| Upper 95% CI of HbA1c estimated treatment difference | 9.06 | 8.96 | +0.10 | 21 498 | 21 693 | −196 | Once‐weekly semaglutide dominant |
| Lower 95% CI of HbA1c estimated treatment difference | 9.03 | 8.96 | +0.07 | 21 614 | 21 693 | −79 | Once‐weekly semaglutide dominant |
| Upper 95% CI of BMI estimated treatment difference | 9.06 | 8.96 | +0.10 | 21 537 | 21 693 | −156 | Once‐weekly semaglutide dominant |
| Lower 95% CI of BMI estimated treatment difference | 9.05 | 8.96 | +0.09 | 21 604 | 21 693 | −89 | Once‐weekly semaglutide dominant |
| Treatment switching at 2 years | 8.99 | 8.93 | +0.06 | 21 220 | 21 360 | −140 | Once‐weekly semaglutide dominant |
| Treatment switching at 5 years | 9.14 | 9.02 | +0.12 | 22 112 | 22 377 | −265 | Once‐weekly semaglutide dominant |
| Treatment switching at 7.5% (58 mmol/mol) HbA1c threshold (using UKPDS progression) | 8.60 | 8.47 | +0.13 | 24 874 | 24 722 | +152 | 1135 |
| NPH basal insulin cost upon treatment intensification | 9.06 | 8.96 | +0.10 | 20 205 | 20 322 | −117 | Once‐weekly semaglutide dominant |
| Cost of complications +10% | 9.06 | 8.96 | +0.10 | 22 761 | 22 883 | −122 | Once‐weekly semaglutide dominant |
| Cost of complications −10% | 9.06 | 8.96 | +0.10 | 20 408 | 20 497 | −89 | Once‐weekly semaglutide dominant |
| UKPDS 82 risk equations applied | 9.35 | 9.31 | +0.04 | 22 160 | 22 338 | −178 | Once‐weekly semaglutide dominant |
| Lee et al BMI disutility applied | 8.61 | 8.50 | +0.11 | 21 588 | 21 693 | −106 | Once‐weekly semaglutide dominant |
| Currie et al hypoglycaemia disutilities | 9.18 | 9.09 | +0.10 | 21 588 | 21 693 | −106 | Once‐weekly semaglutide dominant |
| Analysis | Discounted quality‐adjusted life expectancy (QALYs) | Discounted direct costs (GBP) | ICER (GBP per QALY gained) | ||||
|---|---|---|---|---|---|---|---|
| Once‐weekly semaglutide 0.5 mg | Dulaglutide 1.5 mg | Difference | Once‐weekly semaglutide 0.5 mg | Dulaglutide 1.5 mg | Difference | ||
| Base case | 9.00 | 8.96 | +0.04 | 21 659 | 21 693 | −35 | Once‐weekly semaglutide dominant |
| Statistically significant differences only | 8.97 | 8.96 | +0.01 | 21 824 | 21 693 | +131 | 18 446 |
| 35‐year time horizon | 8.94 | 8.92 | +0.01 | 21 384 | 21 467 | −83 | Once‐weekly semaglutide dominant |
| 20‐year time horizon | 7.76 | 7.74 | +0.01 | 17 052 | 17 136 | −84 | Once‐weekly semaglutide dominant |
| 10‐year time horizon | 5.15 | 5.13 | +0.02 | 10 235 | 10 287 | −51 | Once‐weekly semaglutide dominant |
| 0% discount rates | 13.58 | 13.53 | +0.06 | 35 512 | 35 564 | −52 | Once‐weekly semaglutide dominant |
| 6% discount rates | 7.08 | 7.05 | +0.03 | 16 301 | 16 329 | −28 | Once‐weekly semaglutide dominant |
| NICE (THIN) baseline cohort data | 8.81 | 8.78 | +0.02 | 19 463 | 19 471 | −8 | Once‐weekly semaglutide dominant |
| BMI difference maintained for patient lifetimes | 9.03 | 8.96 | +0.07 | 21 671 | 21 693 | −23 | Once‐weekly semaglutide dominant |
| UKPDS HbA1c creep for duration of the analysis (no change upon treatment intensification) | 8.50 | 8.47 | +0.03 | 24 643 | 24 722 | −78 | Once‐weekly semaglutide dominant |
| Upper 95% CI of HbA1c estimated treatment difference | 9.00 | 8.96 | +0.04 | 21 599 | 21 693 | −94 | Once‐weekly semaglutide dominant |
| Lower 95% CI of HbA1c estimated treatment difference | 8.97 | 8.96 | +0.01 | 21 671 | 21 693 | −23 | Once‐weekly semaglutide dominant |
| Upper 95% CI of BMI estimated treatment difference | 9.00 | 8.96 | +0.04 | 21 683 | 21 693 | −10 | Once‐weekly semaglutide dominant |
| Lower 95% CI of BMI estimated treatment difference | 8.98 | 8.96 | +0.02 | 21 679 | 21 693 | −14 | Once‐weekly semaglutide dominant |
| Treatment switching at 2 years | 8.94 | 8.93 | +0.01 | 21 324 | 21 360 | −36 | Once‐weekly semaglutide dominant |
| Treatment switching at 5 years | 9.04 | 9.02 | +0.02 | 22 212 | 22 377 | −165 | Once‐weekly semaglutide dominant |
| Treatment switching at 7.5% (58 mmol/mol) HbA1c threshold (using UKPDS progression) | 8.50 | 8.47 | +0.03 | 24 643 | 24 722 | −78 | Once‐weekly semaglutide dominant |
| NPH basal insulin cost upon treatment intensification | 9.00 | 8.96 | +0.04 | 20 283 | 20 322 | −39 | Once‐weekly semaglutide dominant |
| Cost of complications +10% | 9.00 | 8.96 | +0.04 | 22 843 | 22 883 | −41 | Once‐weekly semaglutide dominant |
| Cost of complications −10% | 9.00 | 8.96 | +0.04 | 20 468 | 20 497 | −29 | Once‐weekly semaglutide dominant |
| UKPDS 82 risk equations applied | 9.33 | 9.31 | +0.02 | 22 252 | 22 338 | −86 | Once‐weekly semaglutide dominant |
| Lee et al BMI disutility applied | 8.55 | 8.50 | +0.04 | 21 659 | 21 693 | −35 | Once‐weekly semaglutide dominant |
| Currie et al hypoglycaemia disutilities | 9.12 | 9.09 | +0.04 | 21 659 | 21 693 | −35 | Once‐weekly semaglutide dominant |
Abbreviations: BMI, body mass index; CI, confidence interval; GBP, 2016 pounds sterling; HbA1c, glycated haemoglobin; NPH, neutral protamine Hagedorn; QALY, quality‐adjusted life year. Quality‐adjusted life expectancy outcomes are rounded to two decimal places.
When the UKPDS HbA1c progression equation was applied with treatment switching when HbA1c exceeded 7.5% (58 mmol/mol), once‐weekly semaglutide 1 mg was associated with greater clinical benefits but increased costs vs dulaglutide 1.5 mg, resulting in an ICER of GBP 1135 per QALY gained. This was the result of asymmetric timing of treatment switching in the two treatment arms. Patients received once‐weekly semaglutide 1 mg for 4 years, while patients received dulaglutide 1.5 mg for only 3 years and received the less costly insulin abasaglar during the fourth year of analysis.
While the magnitude of clinical benefits and cost savings varied, once‐weekly semaglutide 0.5 and 1 mg were considered dominant vs dulaglutide 1.5 mg in all other analyses.
PSA showed mean results similar to those of the base case, but increased measures of variance around the mean outcomes, with both doses of once‐weekly semaglutide remaining dominant. Based on this analysis, assuming a willingness‐to‐pay threshold of GBP 20 000 per QALY gained, the probabilities of once‐weekly semaglutide 0.5 and 1 mg being cost‐effective vs dulaglutide 1.5 mg were 57.2% and 77.8%, respectively. A cost‐effectiveness acceptability curve is shown in Figure 1, and the cost‐effectiveness scatterplot is shown in Appendix S1.
Figure 1.
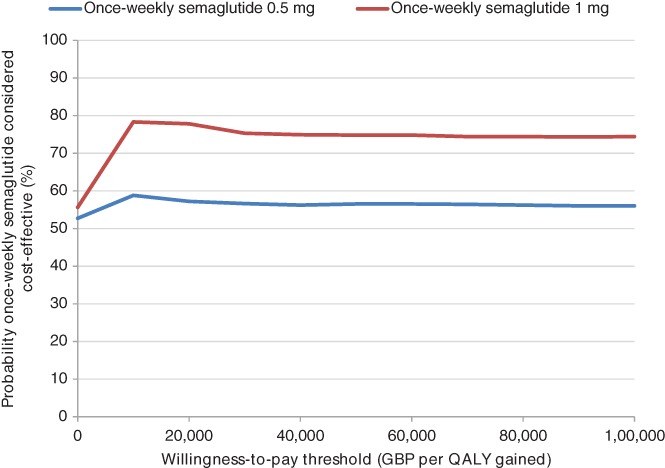
Cost‐effectiveness acceptability curve from the probabilistic sensitivity analysis. Abbreviations: GBP, 2016 pounds sterling; QALY, quality‐adjusted life year
4. DISCUSSION
Once‐weekly semaglutide 0.5 and 1 mg were found to be dominant over dulaglutide 1.5 mg based on the SUSTAIN 7 trial, improving clinical outcomes and reducing direct costs in individuals with T2DM. Greater reductions in HbA1c and BMI were the key drivers of improved long‐term outcomes. Once‐weekly semaglutide was associated with increased treatment costs compared with dulaglutide, despite equal acquisition costs, because of the increase in survival resulting from improved outcomes. However, cost savings resulting from the avoided diabetes‐related complications entirely offset this increase. While overall cost savings per patient were small, these were found to be statistically significant for the higher dose of once‐weekly semaglutide. These small cost savings at a per patient level would translate to a substantially larger amount when extrapolated over a national patient population with type 2 diabetes using once‐weekly GLP‐1 receptor agonist therapy.
Achievement of treatment goals and tolerability can affect adherence, which may impact cost‐effectiveness. In the SUSTAIN 7 clinical trial, once‐weekly semaglutide 0.5 mg was associated with proportions of patients achieving glycaemic control targets similar to those associated with dulaglutide 1.5 mg, while once‐weekly semaglutide was associated with a significantly greater proportion of patients achieving HbA1c targets.20 Discontinuation rates were slightly higher with once‐weekly semaglutide 0.5 mg (16%) and 1 mg (17%) compared with dulaglutide 1.5 mg (12%).20 The percentages of patients experiencing adverse events, adverse events that led to premature treatment discontinuation, and gastrointestinal adverse events were similar with once‐weekly semaglutide 0.5 mg, once‐weekly semaglutide 1 mg and dulaglutide 1.5 mg. Further studies are required to determine how the outcomes identified in randomized, controlled trials translate to clinical practice.
There is increasing interest in the impact of medications for T2DM on cardiovascular risk, in addition to their impact on conventional risk factors for cardiovascular events. Once‐weekly semaglutide demonstrated cardiovascular benefits in the SUSTAIN 6 trial (NCT01720446). Once‐weekly semaglutide was associated with a significantly lower risk of cardiovascular death, non‐fatal myocardial infarction and non‐fatal stroke compared with placebo plus standard of care.56 The REWIND study (NCT01394952) to assess the impact of dulaglutide on cardiovascular risk has not yet been reported. Until data from the REWIND study are available, it is not possible to include further information concerning differential impact on cardiovascular risk with once‐weekly semaglutide and dulaglutide.
NICE guidelines currently recommend GLP‐1 receptor agonists as part of triple therapy for individuals with T2DM and a BMI over 35 kg/m2, those for whom insulin therapy would have significant occupational implications and those for whom weight loss would benefit other significant obesity‐related comorbidities.6 This is not in agreement with the present analysis in which dual therapy following metformin failure was considered. However, the joint guidelines released by the American Diabetes Association (ADA) and the European Association for the Study of Diabetes (EASD) recommend the use of GLP‐1 receptor agonists as a second‐line treatment option. The draft update to ADA/EASD consensus guidelines states that GLP‐1 receptor agonists are a preferred second‐line treatment if weight gain is a concern, and that interventions with a proven cardiovascular benefit are preferred (new guidelines are due to be released following the 54th EASD Annual Meeting 2018 in Berlin, Germany).13, 57 Other second‐line options for individuals with T2DM include DPP‐4 inhibitors, SGLT‐2 inhibitors and basal insulin.6 In the SUSTAIN 2 trial, both doses of once‐weekly semaglutide were associated with significantly larger reductions in HbA1c, systolic blood pressure and BMI vs the DPP‐4 inhibitor sitagliptin.58 There are currently no head‐to‐head clinical trials comparing once‐weekly semaglutide with SGLT‐2 inhibitors, but an NMA suggests that both doses of once‐weekly semaglutide are associated with greater reductions in HbA1c, that once‐weekly semaglutide 1 mg is associated with greater reductions in body weight, and that once‐weekly semaglutide 0.5 mg is associated with weight loss similar to that with SGLT‐2 inhibitors.14 The SUSTAIN 8 trial (NCT03136484) will provide a head‐to‐head comparison of once‐weekly semaglutide with SGLT‐2 inhibitors (canagliflozin 300 mg). As well as in the SUSTAIN 7 trial (NCT02648204), once‐weekly semaglutide was compared with other GLP‐1 receptor agonists in the SUSTAIN 3 trial (exenatide extended‐release, NCT01885208) and in an NMA (liraglutide, dulaglutide, exenatide twice‐daily, exenatide extended‐release, lixisenatide and albiglutide) in which once‐weekly semaglutide was associated with greater reductions in HbA1c and body weight in all comparisons.19, 21 Once‐weekly semaglutide was compared with basal insulin in the SUSTAIN 4 trial (NCT02128932) and was associated with significant improvements in HbA1c and body weight.59 Additionally, sub‐group analyses based on baseline HbA1c and BMI have shown that once‐weekly semaglutide is consistently more efficacious than other treatment options included in the SUSTAIN trial programme in all sub‐groups, rather than simply in groups with a high BMI at baseline.22, 60, 61 As once‐weekly semaglutide has been shown to be more efficacious than a number of treatment options for individuals with T2DM, further analyses are required to assess its cost‐effectiveness at each stage of the T2DM treatment algorithm, to elucidate the optimal place for once‐weekly semaglutide and to maximize value for money within the NHS.
A limitation of this study was the reliance on short‐term clinical trial data to make long‐term projections. However, this remains one of the essential tenets of health economic modelling and it is arguably one of the best available options to inform decision making in the absence of long‐term data. Moreover, projecting outcomes over patient lifetimes is recommended in guidelines for economic evaluation of interventions for T2DM.28 Whilst there is always an element of clinical doubt concerning the accuracy of such an approach, every effort was made in the present analysis to minimize this doubt, primarily by using a model of diabetes that has been extensively published and validated, in addition to extensive sensitivity analyses.24, 25 The aim of health economic analyses, such as the present study, is to inform and to reduce uncertainty concerning decision making when long‐term data are lacking.
A further limitation of the present analysis is that the model does not reflect personalization of treatment. EASD and ADA guidelines indicate that patients should be routinely assessed and their therapy should be modified and their treatment goals revised accordingly.13, 58 The 3‐year treatment switch presented in this analysis could therefore be subject to criticism. The modelling analysis also did not include addition of basal insulin with continuation of GLP‐1 receptor agonists. This approach is recommended in treatment guidelines, but all studies have assessed addition of a GLP‐1 receptor agonist to a basal insulin regimen rather than addition of basal insulin to a GLP‐1 receptor agonist regime.13, 58 Therefore, changes in risk factors upon addition of basal insulin to once‐weekly semaglutide and dulaglutide would be associated with significant uncertainty. Despite these limitations, the present study offers a clear and simple direct comparison of the two interventions, aiming to assess the cost‐effectiveness of once‐weekly semaglutide and dulaglutide in the UK.
In conclusion, once‐weekly semaglutide represents a cost‐effective option for treating individuals with T2DM in the UK who are not achieving glycaemic control with metformin and it is projected to both improve quality‐adjusted life expectancy and reduce costs compared with treatment with dulaglutide.
CONFLICTS OF INTEREST
A. V. has conducted clinical trials funded by and has received lecture and advisory board fees from Astra Zeneca, Boehringer‐Ingelheim, Ely Lilly, Merck Sharpe Dohme, Napp, Novo Nordisk, Takeda and Sanofi. C. S. H. is an employee of Novo Nordisk Ltd and owns shares in Novo Nordisk A/S. P. J. is an employee of Novo Nordisk A/S. S. M. and B. H. are employees of Ossian Health Economics and Communications, which received consulting fees from Novo Nordisk A/S to support preparation of the analysis. S. C. B. has received honoraria, teaching and research sponsorship/grants from Astra‐Zeneka, Boehringer Ingelheim, BMS, Eli Lilly, GlaxoSmithKline, Merck Sharp & Dohme, Novo Nordisk, Pfizer, Sanofi and Takeda. S. C. B. owns a share of Glycosmedia.
Author contributions
The study was designed by all authors. B. H. and S. M. conducted the study. All authors contributed to analysis of the results. S. M. and B. H. drafted the manuscript and A. V., S. C. B., C. S. H and P. J. critically reviewed the manuscript and revised it for important intellectual content. All authors approved the final manuscript and agree to be accountable for all aspects of the work.
Supporting information
Table S1. Costs of treating diabetes‐related complications.
Table S2. Health state utilities used in the base case analysis.
Table S3. Baseline cohort characteristics of the NICE THIN cohort.
Table S4. Health state utilities used in sensitivity analysis.
Table S5. Cumulative incidence of diabetes‐related complications.
Figure S1. Mean time to onset of complications.
Figure S2. Probabilistic sensitivity analysis scatterplot.
Viljoen A, Hoxer CS, Johansen P, Malkin S, Hunt B, Bain SC. Evaluation of the long‐term cost‐effectiveness of once‐weekly semaglutide versus dulaglutide for treatment of type 2 diabetes mellitus in the UK. Diabetes Obes Metab. 2019;21:611–621. 10.1111/dom.13564
Funding information The study was supported by funding from Novo Nordisk A/S.
REFERENCES
- 1. Ismail‐Beigi F, Craven T, Banerji MA, et al. Effect of intensive treatment of hyperglycaemia on microvascular outcomes in type 2 diabetes: an analysis of the ACCORD randomised trial. Lancet. 2010;376:419‐430. [DOI] [PMC free article] [PubMed] [Google Scholar]
- 2. Patel A, MacMahon S, Chalmers J, et al. Intensive blood glucose control and vascular outcomes in patients with type 2 diabetes. N Engl J Med. 2008;358:2560‐2572. [DOI] [PubMed] [Google Scholar]
- 3. UK Prospective Diabetes Study (UKPDS) Group . Intensive blood‐glucose control with sulphonylureas or insulin compared with conventional treatment and risk of complications in patients with type 2 diabetes (UKPDS 33). Lancet. 1998;352:837‐853. [PubMed] [Google Scholar]
- 4. Holman RR, Paul SK, Bethel MA, Matthews DR, Neil HA. 10‐year follow‐up of intensive glucose control in type 2 diabetes. N Engl J Med. 2008;359:1577‐1589. [DOI] [PubMed] [Google Scholar]
- 5. Stettler C, Allemann S, Jüni P, et al. Glycemic control and macrovascular disease in types 1 and 2 diabetes mellitus: Meta‐analysis of randomized trials. Am Heart J. 2006;152:27‐38. [DOI] [PubMed] [Google Scholar]
- 6. National Institute for Health and Care Excellence . Type 2 diabetes in adults: management (NG28). 2015. https://www.nice.org.uk/guidance/ng28/resources/type-2-diabetes-in-adults-management-pdf-1837338615493. Accessed December 12, 2017. [PubMed]
- 7. Gaede P, Lund‐Andersen H, Parving HH, Pedersen O. Effect of a multifactorial intervention on mortality in type 2 diabetes. N Engl J Med. 2008;358:580‐591. [DOI] [PubMed] [Google Scholar]
- 8. Griffin SJ, Borch‐Johnsen K, Davies MJ, et al. Effect of early intensive multifactorial therapy on 5‐year cardiovascular outcomes in individuals with type 2 diabetes detected by screening (ADDITION‐Europe): a cluster‐randomised trial. Lancet. 2011;378:156‐167. [DOI] [PMC free article] [PubMed] [Google Scholar]
- 9. Cholesterol Treatment Trialists' (CTT) Collaborators , Kearney PM, Blackwell L, et al. Efficacy of cholesterol‐lowering therapy in 18,686 people with diabetes in 14 randomised trials of statins: a meta‐analysis. Lancet. 2008;371:117‐125. [DOI] [PubMed] [Google Scholar]
- 10. UK Prospective Diabetes Study Group . Tight blood pressure control and risk of macrovascular and microvascular complications in type 2 diabetes: UKPDS 38. BMJ. 1998;317:703‐713. [PMC free article] [PubMed] [Google Scholar]
- 11. NHS Digital . National Diabetes Audit, 2016. ‐17 Report 1: Care Processes and Treatment Targets. https://files.digital.nhs.uk/pdf/s/k/national_diabetes_audit_2016-17_report_1__care_processes_and_treatment_targets.pdf Accessed June 1, 2018.
- 12. Scottish Diabetes Survey Monitoring Group . Scottish Diabetes Survey 2016. http://www.diabetesinscotland.org.uk/publications/Scottish%20Diabetes%20Survey%202016.pdf. Accessed June 1, 2018.
- 13. Inzucchi SE, Bergenstal RM, Buse JB, et al. Management of hyperglycaemia in type 2 diabetes, 2015: a patient‐centred approach. Update to a position statement of the American Diabetes Association and the European Association for the Study of Diabetes. Diabetologia. 2015;58:429‐442. [DOI] [PubMed] [Google Scholar]
- 14. Sharma R, Wilkinson L, Vrazic H, et al. Comparative efficacy of once‐weekly semaglutide and SGLT‐2 inhibitors in type 2 diabetic patients inadequately controlled with metformin monotherapy: a systematic literature review and network meta‐analysis. Curr Med Res Opin. 2018;34:1595‐1603. [DOI] [PubMed] [Google Scholar]
- 15. Lorenzi M, Ploug UJ, Langer J, Skovgaard R, Zoratti M, Jansen J. Liraglutide versus SGLT‐2 inhibitors in people with type 2 diabetes: a network meta‐analysis. Diabetes Ther. 2017;8:85‐99. [DOI] [PMC free article] [PubMed] [Google Scholar]
- 16. European Medicines Agency . EPAR summary for the public: Ozempic/semaglutide. 2018. http://www.ema.europa.eu/docs/en_GB/document_library/EPAR_-_Summary_for_the_public/human/004174/WC500244166.pdf. Accessed June 1, 2018.
- 17. European Medicines Agency . EPAR summary for the public: Trulicity/dulaglutide. 2014. http://www.ema.europa.eu/ema/index.jsp?curl=pages/medicines/human/medicines/002825/human_med_001821.jsp&mid=WC0b01ac058001d124. Accessed June 1, 2018.
- 18. European Medicines Agency . EPAR summary for the public: Bydureon/exenatide. 2017. http://www.ema.europa.eu/docs/en_GB/document_library/EPAR_-_Summary_for_the_public/human/002020/WC500108240.pdf. Accessed June 1, 2018.
- 19. Ahmann AJ, Capehorn M, Charpentier G, et al. Efficacy and safety of once‐weekly semaglutide versus exenatide er in subjects with type 2 diabetes (SUSTAIN 3): a 56‐week, open‐label randomized clinical trial. Diabetes Care. 2018;41:258‐266. [DOI] [PubMed] [Google Scholar]
- 20. Pratley RE, Aroda VR, Lingvay I, et al. SUSTAIN 7 investigators. Semaglutide versus dulaglutide once weekly in patients with type 2 diabetes (SUSTAIN 7): a randomised, open‐label, phase 3b trial. Lancet Diabetes Endocrinol. 2018;6:275‐286. [DOI] [PubMed] [Google Scholar]
- 21. Witkowski M, Wilkinson L, Webb N, Weids A, Glah D, Vrazic H. A systematic literature review and network meta‐analysis comparing once‐weekly semaglutide with other GLP‐1 receptor agonists in patients with type 2 diabetes previously receiving 1–2 oral anti‐diabetic drugs. Diabetes Ther. 2018;9:1149‐1167. [DOI] [PMC free article] [PubMed] [Google Scholar]
- 22. Viljoen A, Blüher M, Chow F et al. Semaglutide reduces body weight vs. dulaglutide across baseline BMI subgroups in SUSTAIN 7. Diabetes. 2018;67(suppl 1):A287. [Google Scholar]
- 23. Palmer AJ, Roze S, Valentine WJ, et al. The CORE Diabetes Model: projecting long‐term clinical outcomes, costs and cost‐effectiveness of interventions in diabetes mellitus (types 1 and 2) to support clinical and reimbursement decision‐making. Curr Med Res Opin. 2004;20(suppl 1):S5‐S26. [DOI] [PubMed] [Google Scholar]
- 24. Palmer AJ, Roze S, Valentine WJ, et al. Validation of the CORE Diabetes Model against epidemiological and clinical studies. Curr Med Res Opin. 2004;20(suppl 1):S27‐S40. [DOI] [PubMed] [Google Scholar]
- 25. McEwan P, Foos V, Palmer JL, Lamotte M, Lloyd A, Grant D. Validation of the IMS CORE Diabetes Model. Value Health. 2014;17:714‐724. [DOI] [PubMed] [Google Scholar]
- 26. Clarke PM, Gray AM, Briggs A, et al. UK Prospective Diabetes Study (UKDPS) Group. A model to estimate the lifetime health outcomes of patients with type 2 diabetes: the United Kingdom Prospective Diabetes Study (UKPDS) Outcomes Model (UKPDS no. 68). Diabetologia. 2004;47:1747‐1759. [DOI] [PubMed] [Google Scholar]
- 27. National Institute for Health and Care Excellence . The guidelines manual: process and methods (PMG6). 2012. https://www.nice.org.uk/process/pmg6/resources/the-guidelines-manual-pdf-2007970804933. Accessed December 12, 2017.
- 28. American Diabetes Association Consensus Panel . Guidelines for computer modeling of diabetes and its complications. Diabetes Care. 2004;27:2262‐2265. [DOI] [PubMed] [Google Scholar]
- 29. World Health Organisation . Global Health Observatory data repository: life tables by country (United Kingdom). 2017. http://apps.who.int/gho/data/view.main.LT62260?lang=en. Accessed December 13, 2017.
- 30. Office for National Statistics . Adult smoking habits in Great Britain. 2017. https://www.ons.gov.uk/peoplepopulationandcommunity/healthandsocialcare/drugusealcoholandsmoking/datasets/adultsmokinghabitsingreatbritain. Accessed March 26, 2018.
- 31. World Health Organisation . Global Alcohol Report. 2014. http://www.who.int/substance_abuse/publications/global_alcohol_report/profiles/gbr.pdf. Accessed March 26, 2018.
- 32. National Institute for Health and Care Excellence . Final appraisal determination: liraglutide for the treatment of type 2 diabetes mellitus. 2011. https://www.nice.org.uk/guidance/ta203/documents/diabetes‐liraglutide‐final‐appraisal‐determination3. Accessed December 13, 2017.
- 33. Hunt B, Vega‐Hernandez G, Valentine WJ, Kragh N. Evaluation of the long‐term cost‐effectiveness of liraglutide versus lixisenatide for treatment of type 2 diabetes mellitus in the UK setting. Diabetes Obes Metab. 2017;19:842‐849. [DOI] [PubMed] [Google Scholar]
- 34. Mezquita‐Raya P, Ramírez de Arellano A, Kragh N, et al. Liraglutide versus lixisenatide: long‐term cost‐effectiveness of GLP‐1 receptor agonist therapy for the treatment of type 2 diabetes in Spain. Diabetes Ther. 2017;8:401‐415. [DOI] [PMC free article] [PubMed] [Google Scholar]
- 35. Hunt B, Kragh N, McConnachie CC, Valentine WJ, Rossi MC, Montagnoli R. Long‐term cost‐effectiveness of two GLP‐1 receptor agonists for the treatment of type 2 diabetes mellitus in the italian setting: liraglutide versus lixisenatide. Clin Ther. 2017;39:1347‐1359. [DOI] [PubMed] [Google Scholar]
- 36. Heap G. Decision Resources Group Report: current treatment type 2 diabetes detailed, Expanded Analysis (EU5). 2016. https://decisionresourcesgroup.com/report/499707-biopharma-type-2-diabetes-current-treatment-detailed/. Accessed March 12, 2018.
- 37. UK Hypoglycaemia Study Group . Risk of hypoglycaemia in types 1 and 2 diabetes: effects of treatment modalities and their duration. Diabetologia. 2007;50:1140‐1147. [DOI] [PubMed] [Google Scholar]
- 38.Monthly Index of Medical Specialities. Haymarket Media Group. 2018. https://www.mims.co.uk/. Accessed March 12, 2018.
- 39. Rtveladze K, Hoxer CS. Cost of type 2 diabetes management and associated complications in the United Kingdom. Value Health. 2017;20:A477. [Google Scholar]
- 40. NHS England . National Tariff Payment System 2016/17. Statutory guidance. 2016. https://www.gov.uk/government/publications/nhs-national-tariff-payment-system-201617. Accessed December 12, 2017.
- 41. Alva ML, Gray A, Mihaylova B, Leal J, Holman RR. The impact of diabetes‐related complications on healthcare costs: new results from the UKPDS (UKPDS 84). Diabetes Med. 2015;32:459‐466. [DOI] [PubMed] [Google Scholar]
- 42. O'Reilly D, Hopkins R, Blackhouse G, Clarke P, Hux J, Guan J. Development of an Ontario Diabetes Economic Model (ODEM) and application to a multidisciplinary primary care diabetes management program. Programs for Assessment of Technology in Health; 2007. https://books.google.ch/books/about/Development_of_an_Ontario_Diabetes_Econo.html?id=X_lGAQAACAAJ&redir_esc=y
- 43. Cassar K. Intermittent claudication. BMJ. 2006;333:1002‐1005. [DOI] [PMC free article] [PubMed] [Google Scholar]
- 44. Bradbury AW, Adam DJ, Bell J, et al. Multicentre randomised controlled trial of the clinical and cost‐effectiveness of a bypass‐surgery‐first versus a balloon‐angioplasty‐first revascularisation strategy for severe limb ischaemia due to infrainguinal disease. The Bypass versus Angioplasty in Severe Ischaemia of the Leg (BASIL) trial. Health Technol Assess. 2010;14:1‐210. [DOI] [PubMed] [Google Scholar]
- 45. Centre for clinical practice at NICE . Organ donation for transplantation: improving donor identification and consent rates for deceased organ donation. 2011. (updated 2016). https://www.nice.org.uk/guidance/cg135/evidence/organ-donation-full-guideline-184994893. Accessed December 12, 2017.
- 46. Kent S, Schlackow I, Lozano‐Kuhne J, et al. SHARP Collaborative Group. What is the impact of chronic kidney disease stage and cardiovascular disease on the annual cost of hospital care in moderate‐to‐severe kidney disease? BMC Nephrol. 2015;16:65. [DOI] [PMC free article] [PubMed] [Google Scholar]
- 47. Chubb B, Tikkanen C. The cost of non‐severe hypoglycaemia in Europe. Value Health. 2015;18:A611. [Google Scholar]
- 48. Hammer M, Lammert M, Mejias SM, Kern W, Frier BM. Costs of managing severe hypoglycaemia in three European countries. J Med Econ. 2009;12:281‐290. [DOI] [PubMed] [Google Scholar]
- 49. National Institute for Health and Care Excellence . Neuropathic pain in adults: pharmacological management in nonspecialist settings. NICE guideline (CG173). 2013. www.nice.org.uk/guidance/cg173. Accessed December 12, 2017. [PubMed]
- 50. Ghatnekar O, Willis M, Persson U. Cost‐effectiveness of treating deep diabetic foot ulcers with Promogran in four European countries. J Wound Care. 2002;11:70‐74. [DOI] [PubMed] [Google Scholar]
- 51. Curtis L, Burns A . Unit costs of health and social care 2016. Personal Social Services Research Unit, Kent. 2016. http://www.pssru.ac.uk/pub/uc/uc2016/full.pdf Accessed December 11, 2017.
- 52. Beaudet A, Clegg J, Thuresson PO, Lloyd A, McEwan P. Review of utility values for economic modeling in type 2 diabetes. Value Health. 2014;17:462‐470. [DOI] [PubMed] [Google Scholar]
- 53. Evans M, Khunti K, Mamdani M, et al. Health‐related quality of life associated with daytime and nocturnal hypoglycaemic events: a time trade‐off survey in five countries. Health Qual Life Outcomes. 2013;11:90. [DOI] [PMC free article] [PubMed] [Google Scholar]
- 54. National Institute for Health and Care Excellence . Type 2 diabetes in adults: management (NG28) Appendix F: Full Health Economics Report. 2015. https://www.nice.org.uk/guidance/ng28/evidence/appendix-f-full-health-economics-report-2185320355. Accessed March 12, 2018.
- 55. Currie CJ, Morgan CL, Poole CD, Sharplin P, Lammert M, McEwan P. Multivariate models of health‐related utility and the fear of hypoglycaemia in people with diabetes. Curr Med Res Opin. 2006;22:1523‐1534. [DOI] [PubMed] [Google Scholar]
- 56. Marso SP, Bain SC, Consoli A, et al. Semaglutide and cardiovascular outcomes in patients with type 2 diabetes. N Engl J Med. 2016;375:1834‐1844. [DOI] [PubMed] [Google Scholar]
- 57. American Diabetes Association . Management of hyperglycemia in type 2 diabetes: ADA‐EASD Consensus Report 2018. https://professional.diabetes.org/content-page/management-hyperglycemia-type-2-diabetes-ada-easd-consensus-report-2018. Accessed July 13, 2018.
- 58. Ahrén B, Masmiquel L, Kumar H, et al. Efficacy and safety of once‐weekly semaglutide versus once‐daily sitagliptin as an add‐on to metformin, thiazolidinediones, or both, in patients with type 2 diabetes (SUSTAIN 2): a 56‐week, double‐blind, phase 3a, randomised trial. Lancet Diabetes Endocrinol. 2017;5:341‐354. [DOI] [PubMed] [Google Scholar]
- 59. Aroda VR, Bain SC, Cariou B, et al. Efficacy and safety of once‐weekly semaglutide versus once‐daily insulin glargine as add‐on to metformin (with or without sulfonylureas) in insulin‐naive patients with type 2 diabetes (SUSTAIN 4): a randomised, open‐label, parallel‐group, multicentre, multinational, phase 3a trial. Lancet Diabetes Endocrinol. 2017;5:355‐366. [DOI] [PubMed] [Google Scholar]
- 60. Bain S, Araki E, Desouza C, et al. Semaglutide reduces HbA1c across baseline HbA1c subgroups across SUSTAIN 1‐5 clinical trials. Diabetes. 2017;66(suppl 1):A298‐A299. [Google Scholar]
- 61. Leiter LA, Charpentier G, Chaykin L, et al. Semaglutide reduces body weight across baseline BMI subgroups across SUSTAIN 1‐5. Diabetes. 2017;66(suppl 1):A293. [Google Scholar]
Associated Data
This section collects any data citations, data availability statements, or supplementary materials included in this article.
Supplementary Materials
Table S1. Costs of treating diabetes‐related complications.
Table S2. Health state utilities used in the base case analysis.
Table S3. Baseline cohort characteristics of the NICE THIN cohort.
Table S4. Health state utilities used in sensitivity analysis.
Table S5. Cumulative incidence of diabetes‐related complications.
Figure S1. Mean time to onset of complications.
Figure S2. Probabilistic sensitivity analysis scatterplot.