

Abstract
Protein phosphatase‐1 (PP1) drives a large amount of phosphoSer/Thr protein dephosphorylations in eukaryotes to counteract multiple kinases in signaling pathways. The phosphatase requires divalent metal cations for catalytic activity and contains iron naturally. Iron has been suggested to have an influence on PP1 activity through Fe2+ and Fe3+ oxidation states. However, much biochemical and all structural data have been obtained with recombinant PP1 containing Mn2+ ions. Purifying iron‐containing PP1 from Escherichia coli has thus far not been possible. Here, we present the preparation, characterization, and structure of iron‐bound PP1α in inactive and active states. We establish a key role for the electronic/redox properties of iron in PP1 activity and shed light on the difference in substrate specificity between iron‐ and manganese‐containing PP1.
Keywords: metalloenzyme, phosphatase activity, protein phosphatase‐1, redox regulation, X‐ray crystallography
Abbreviations
Asc, ascorbate
β‐ME, β‐mercaptoethanol
DiFMUP, 6,8‐difluoro‐4‐methylumbelliferyl phosphate
H3pT3, histone 3 phosphothreonine 3
I2, Inhibitor‐2
ICP‐OES, inductively coupled plasma optical emission spectrometry
MESG, methylthioguanosine
PNP, purine nucleoside phosphorylase
pNPP, p‐nitrophenylphosphat
PP1, protein phosphatase‐1
Protein phosphatase‐1 (PP1) plays key roles in signaling pathways and its deregulation is implicated in severe diseases such as cancer and diabetes 1. In particular, attempting to target PP1 in proteostasis diseases 2, 3 has motivated in recent years numerous studies on PP1 function and on the action mechanisms of drugs targeting PP1 4, 5, 6. For its catalytic activity, PP1 relies on two metal ions bound in its active site. A recent study described a new redox‐regulatory mechanism for PP1 involving the metal ions 7. The authors demonstrated that the enzyme NADPH oxidase‐4 (Nox4) binds the PP1‐targeting subunit GADD34, generates reactive oxygen species, and locally inhibits PP1. The applied recombinant PP1 contained largely Mn2+ ions at both metal coordination sites of PP1's active site, and in the crystal structure the nature of the metal ions was unclear. Nevertheless, evidence by EPR measurements suggested that oxidation of Fe2+ to Fe3+ could be involved in the inactivation of PP1 7.
The catalytic subunit of native PP1 contains iron and zinc, and the presence of Mg2+ cannot be ruled out, whereas Mn2+ content is almost negligible 8. Similar to the data on PP1 oxidation 7, all structural and most biochemical data so far have been obtained using recombinant PP1 containing manganese ions (Mn‐PP1) in the active site 8. This is due to difficulties in purifying and producing a stable preparation of iron‐bound PP1 (Fe‐PP1), especially in amounts required for crystallography, which has prevented its use in studies so far 9. Nevertheless, recombinant Mn‐PP1α displayed some important differences from native PP1, isolated from rabbit skeletal muscle, such as altered substrate specificity, which are thus not reflected in in vitro studies using recombinant Mn‐PP1 8. An earlier study suggested that conversion of native PP1 (PP1N) to a Mn2+‐dependent state alters multiple structural elements in PP1 catalytic subunit, but so far this hypothesis could not be addressed in structural studies 10. Thus, lack of biochemical and structural data on active PP1 bound to physiological metals currently hampers understanding its dephosphorylation chemistry and regulation. Addressing this need, we present here a protocol to obtain stable Fe‐PP1α, which we applied to obtain insights into the redox regulation of PP1 activity. We show that only the oxidation state of iron, not a conformational change, determines if PP1 is inactive or active.
Materials and methods
Protein expression and purification
The full‐length gene (residues 1–330) coding for the α‐isoform of the catalytic subunit of human protein phosphatase 1 (PP1α) was subcloned into pTXB1 expression vector fused at the C terminus with the intein tag. The gene was also fused with a cleavable N‐terminal histidine tag. This construct was expressed in BL21Star(DE3)pRARE Escherichia coli strain, in Luria–Bertani broth supplemented with FeSO4 (for Fe‐PP1α, 0.1 g/1 L broth: 0.65 mm) or MnCl2 (for Mn‐PP1α, 1 mm [ 11, 12]). FeSO4 was chosen because it was found frequently reported in protocols for expression and purification in E. coli of iron‐containing recombinant proteins. The expression was conducted at 16 °C overnight after induction with 50 μm isopropyl β‐d‐thiogalactoside. The cell paste collected by centrifugation was subjected to different passages through an Emulsiflex homogenizer in lysis buffer [25 mm TRIS‐Cl, pH 7.5 at room temperature (RT), 300 mm NaCl, 10% v/v glycerol, 30 mm imidazole, 0.2% v/v tween‐20, 0.1 mm phenylmethylsulfonyl fluoride, EDTA‐free protease inhibitor cocktail from Roche Diagnostics GmbH, Mannheim, Germany, and benzonase from Merck, Darmstadt, Germany]. The soluble fraction obtained by centrifugation was spiked with NaCl to reach a concentration of 700 mm final, and loaded on a 5‐mL HisTrap HP nickel column equilibrated in 25 mm TRIS‐HCl, pH 7.5 RT, 700 mm NaCl, 5% v/v glycerol, 30 mm imidazole, 0.2% v/v tween‐20. After an extensive wash with this buffer, and a stringent wash at 15% buffer B, the fused precursor was eluted with 100% buffer B (buffer A with 250 mm imidazole). The elution sample was extensively diluted to a final volume of 300 mL in buffer 25 mm TRIS‐HCl, pH 7.5 at RT, 200 mm NaCl, 10% v/v glycerol, 0.1% v/v tween‐20, and incubated overnight at 4 °C with 50 mm β‐mercaptoethanol (β‐ME) and 1 mg of TEV protease to cleave both tags. This dilution step is critical for the cleavage efficiency and for solubility of PP1α. After incubation with chitin resin from New England Biolabs (NEB, Frankfurt am Main, Germany) to remove the cleaved intein tag, the protein sample was diluted to decrease NaCl concentration to 100 mm and loaded on a 5‐mL Heparin HP column equilibrated in buffer Hep‐A (20 mm TRIS‐Cl, pH 7.5 RT, 100 mm NaCl, 5 mm β‐ME) and subjected to an extensive wash step. PP1α was further purified with a gradient from 0% to 40% buffer Hep‐B (buffer Hep‐A with 1 m NaCl) in 30 min. The purest fractions were combined based on SDS/PAGE and dialyzed against the storage buffer (50 mm TRIS‐Cl, pH 7.5 RT, 200 mm NaCl, 10% v/v glycerol, 5 mm β‐ME). In case of Mn‐PP1α, 1 mm MnCl2 was also added throughout purification and in the storage buffer 11, 12.
Metal content was determined by inductively coupled plasma optical emission spectrometry (ICP‐OES) with an Agilent ICP‐OES 720 at the Institut für Geowissenschaften Universität Heidelberg. The purified protein was passed through a PD10 column extensively washed and equilibrated with metal‐clean buffer prepared by incubation with Chelex resin. The metal‐clean buffer used for the buffer exchange was analyzed by ICP‐OES for background subtraction.
Enzymatic assays
The native PP1N (mixture of PP1α, β, γ isoforms) was a kind gift of M. Bollen from the Department of Cellular and Molecular Medicine in Leuven, Belgium. The protein was purified from rabbit muscle and analyzed by mass spectrometry and western blot, which showed contamination with tropomyosin 6. In most cases, we therefore used the enzyme in an approximate 10‐fold higher concentration than the recombinant pure ones (see below). The storage buffer contained 60% glycerol, 50 mm TRIS‐Cl pH 7.5 and 1 mm DTT.
In vitro activity assays were performed in 96 well plates with a Tecan Infinite M1000 PRO (Tecan‐Deutschland GmbH, Crailsheim, Germany). All assays were conducted at 25 °C in a final volume of 100 μL with three independent experiments. Each experiment including Fe‐PP1α was designed in duplicate or triplicate, and Mn‐PP1α was analyzed in parallel in the same plate. The activity buffer was 20 mm TRIS‐Cl, pH 7.0 RT, 100 mm NaCl, 5 mm β‐ME. No metals were included in the assay buffer, and 0.05% v/v tween‐20 was present only with DiFMUP (6,8‐difluoro‐4‐methylumbelliferyl phosphate) as substrate. Initial test of enzymatic activity of Fe‐PP1α was carried out with high enzyme concentration of 100 nm in order to ensure possible detection of weak activity. Immediately prior to the activity assays, Fe‐PP1α was reactivated by adding 5 mm sodium ascorbate and 1 mm FeCl2 (chosen due to high usage of chloride salts compared to other salts in activity assays) for 15’ in the dark at RT and in parallel Mn‐PP1α was incubated similarly, with 1 mm fresh MnCl2 and with or without 5 mm sodium ascorbate, both enzymes in 10 nm stock solution leading to a final concentration of ascorbate of 250 μm in the assays. Stock solutions of FeCl2 and ascorbate were prepared fresh immediately prior to the reactivation. To minimize carryover of the excess metal from the enzyme solutions into the phosphatase assay, only 5 μL of the enzyme solution was added to the reaction mixture (final volume 100 μL for 96‐well plate, corresponding to a residual final concentration of 0.05 mm for the metals). Control samples with buffer but no enzyme with or without 5 mm sodium ascorbate and 1 mm FeCl2 or 1 mm MnCl2 were incubated also at RT in the dark for 15’, and were used for background wells with substrate, in order to rule out possible nonenzymatic reactions. The metal concentrations for the controls were chosen based on the fact that 1 mm FeCl2 or MnCl2 was added to the enzyme for incubation prior to the activity assay.
Activity assays with DiFMUP were conducted by monitoring the fluorescence of the product 6,8‐difluoro‐4‐methylumbelliferone. The substrate DiFMUP was diluted in activity buffer so that the final concentration of DMSO was kept fixed at only 1.6%. The enzymatic activity was linear in respect to time and enzyme concentration. The final concentration of enzyme used was 0.5 nm for Mn‐PP1α and Fe‐PP1α and the substrate ranged from 12.5 to 400 μm. DiFMUP concentrations higher than 600 μm were not considered as substrate inhibition was observed. Native PP1N was used at the concentration of 5 nm (approximate, includes tropomyosin 6).
The activity assays with the H3pT3 peptide (sequence: AR‐pT‐KQTARKS) as substrate were performed with the EnzCheck Phosphate Assay (Themofischer, Scientific, Dreieich, Germany). In this assay, the production of phosphate by PP1 is coupled with the reaction of purine nucleoside phosphorylase (PNP, 0.15 unit) with 200 μm methylthioguanosine (MESG) as substrate. The final product 2‐amino‐6‐mercapto‐7‐methylpurine is detected by monitoring the absorbance at 360 nm. The enzymatic activity was linear with respect to time and enzyme concentration, and it was assessed that the amount of coupled enzyme was not limiting. Addition of the peptide substrate did not alter the pH of the activity buffer. The substrate concentration ranged from 12.5 to 100 μm. The final concentration of enzyme used was 20 nm in all cases except for native PP1N, which was used at 200 nm (approximate, includes tropomyosin 6).
The activity assays with p‐nitrophenylphosphat (pNPP) were carried out by measurement of the absorbance of the reaction product at 405 nm. The buffer used for the assay contained 50 mm TRIS‐Cl, pH 7.5 RT, 200 mm NaCl, 0.1 mm EDTA, 2 mm DTT, and 0.1 mg·mL−1 BSA. The substrate range was from 40 to 1.25 mm. The final concentration of Mn‐PP1α and Fe‐PP1α was 50 nm. Because the amount of the native PP1N was limited and previous studies 6, 13 showed already that it has very low to no activity toward pNPP, 50 nm (approximate, contains tropomyosin 6) of the enzyme was used for the assay (not the 10‐fold excess compared to the recombinant pure proteins as for the other previously untested substrates).
The kinetic parameters derived from these data were obtained with the graphpad prism 6 software (La Jolla, CA, USA). The kinetic data from Mn‐PP1α were fitted to the Michaelis–Menten equation for DiFMUP and pNPP substrates, allowing the determination of the K m and k cat values. The kinetic data from Mn‐PP1α with pNPP and H3pT3 peptide substrate, and from Fe‐PP1α (for DiFMUP, pNPP, and H3pT3 substrates) displayed lack of saturation. In these cases, the data were fitted to a linear plot, where the resulting slope corresponded to the ratio V/K, which was further converted to k cat/K m after normalization with the product titration and with the concentration of the enzyme. A further comparison using only the two lower substrate concentrations (linear range for Mn‐PP1α) and applying a linear fitting was done for Mn‐PP1α and Fe‐PP1α with the DiFMUP and H3pT3 peptide substrates. In this way we confirmed that the comparison between the differently calculated data qualitatively holds true when the parameters were calculated in the same way (data not shown).
To test the effect of Inhibitor‐2 on Fe‐ and Mn‐PP1α, an inhibition assay using DiFMUP as a phosphomimetic substrate was carried out. To this end, Inhibitor‐2 was titrated five times 1 : 2 starting from 2 nm final concentration. Assay buffer composition was 20 mm Tris‐Cl, 100 mm NaCl, 5 mm β‐ME, 0.05% Tween, pH 7.0 substituted with 50 μm MnCl2 or FeCl2 for Mn‐PP1α and Fe‐PP1α, respectively, and ±250 μm ascorbate as indicated. Final protein concentrations in our assay setup were 0.5 nm for Mn‐ and Fe‐PP1α with 100 μm DiFMUP. Assay measurement was carried out in a black 96‐well plate at 25 °C. Relative Fluorescent Units were detected at 450 nm using a Synergy H1 microplate reader (Bio‐Tek Instruments GmbH, Bad Friedrichshall, Germany).
Structure determination
Fe‐PP1α was subjected to gel filtration prior to crystallization. Activity tests in gel filtration buffer of Fe‐PP1α not incubated with ascorbate confirmed that the protein was in the inactive state. Fe‐PP1α was loaded on a Superdex 200 equilibrated in 50 mm TRIS‐Cl, pH 7.5 RT, 500 mm NaCl, 5 mm β‐ME and concentrated to 5 mg·mL−1. Crystals were grown by the vapor diffusion method in sitting drops at 18 °C, by mixing 2 μL of protein solution with 2 μL of the precipitant solution composed of 28% w/v PEG3350, 0.1 m TRIS‐Cl, pH 8.0 RT, 1 m LiCl. Drops were equilibrated against 1 mL precipitant solution for 2 weeks at 18 °C. The crystals were flash cooled in liquid nitrogen using the precipitant solution as cryoprotectant. To obtain the structure of reduced Fe‐PP1α, one crystal of Fe‐PP1α was soaked in 18 mm ascorbate for 15 min in the drop/reservoir solution, and flash cooled in liquid nitrogen adding 25% v/v glycerol to the precipitant solution as cryoprotectant. Data collection was carried out at beamline ID30A‐3 at the European Synchrotron Radiation Facility (ESRF). Data processing was carried out with xds [ 14] and aimless [ 15] in the ccp4 suite 16. The structure was solved by molecular replacement using phaser 17 in the ccp4 suite 16 and the crystal structure of apo Mn‐PP1α as search model (PDB code 4MOV) 18. The structure was refined by alternating manual adjustment and model building in coot 19 and restrained positional and B‐factor refinement with refmac5 20. Structure figures were created in pymol (http://www.pymol.org) and ccp4mg [ 21]. Table 1 presents the data processing and refinement statistics. Fe‐PP1α crystallized as monomer and similar to the other Mn‐PP1 structures available, the first seven amino acids and the C‐terminal tail are not visible. In this case, also the residues 20–24 do not have clear electron density and were therefore not modeled.
Table 1.
X‐ray diffraction data collection and model refinement statistics
| Inactive Fe‐PP1α PDB 6G0J | Active Fe‐PP1α PDB 6G0I | |
|---|---|---|
| Data collection | ||
| Space group | P 2 21 21 | P 2 21 21 |
|
Cell constants a, b, c, α, β, γ |
38.62 Å, 68.72 Å, 127.90 Å 90.00°, 90.00°, 90.00° |
38.62 Å, 68.72 Å, 127.90 Å 90.00°, 90.00°, 90.00° |
| Wavelength (Å) | 0.9677 | 0.9677 |
| Resolution (Å) | 46.81–2.1 (2.16–2.10) | 38.37–2.0 (2.05–2.00) |
| Total observations | 82 293 | 100 006 |
| Unique reflections | 19 896 | 22 907 |
| CC1/2 | 0.998 (0.806) | 0.998 (0.547) |
| R merge (%) | 6.0 (46.7) | 7.9 (87.7) |
| <I/σ(I)> | 12.9 (2.3) | 10.2 (1.5) |
| Completeness (%) | 97.3 (98.9) | 98.5 (99.1) |
| Redundancy | 4.1 (4.2) | 4.4 (4.5) |
| Refinement | ||
| R work/R free | 0.201/0.236 | 0.188/0.233 |
| Number of protein atoms | 2261 | 2253 |
| Number of solvent molecules | 114 | 119 |
| Isotropic B factors (Å2) | 36.46 | 37.57 |
| r.m.s. deviation | ||
| Bonds length (Å) | 0.015 | 0.013 |
| Angle (°) | 1.649 | 1.510 |
Accession codes
Coordinates and structure factors have been deposited in the Protein Data Bank under accession codes PDB 6G0J (Fe(III)‐PP1α) and PDB 6G0I (Fe(II)‐PP1α).
Results and Discussion
We report here that expressing PP1α C‐terminally fused to intein from the pTXB1 vector in MnCl2‐supplemented broth gives higher yields than other protocols, suggesting a stable expression of the construct. This finding led us to hypothesize that this strategy would enable the incorporation of iron into the active site of PP1 during expression using FeSO4‐supplemented broth. Indeed, this strategy allowed us to develop an efficient protocol for recombinant expression and purification of PP1α with stoichiometric iron. We obtained 17 mg of highly pure protein from 4 L of E. coli culture (Fig. S1A), which represents a good yield suitable for biochemical and structural studies of iron‐containing PP1. Metal content analysis by inductively coupled plasma optical emission spectrometry (ICP‐OES) on two different preparations of the enzyme assessed that the ratio of iron concentration versus PP1α concentration (=1) was 0.85 ± 0.04 (two measurements, the error is the standard deviation SD). We did not detect any significant amount of zinc, rather PP1 contained manganese (0.36 ± 0.004) and magnesium (0.29 ± 0.006). The successful incorporation of iron could be explained by a C‐terminal stabilization through the intein fusion. The C‐terminal tail of PP1α is not visible in all the structures deposited in the PDB database and often a truncated version PP1α300 instead of PP1α330 is used to achieve crystallization. It is therefore possible that the fusion at the C terminus of the protein with a tag of 27 kDa helps the folding of PP1α by stabilization of the C‐terminal region. The induction was carried out at low temperature and with very low concentration of inducer with the aim of slowing down protein synthesis to improve cofactor incorporation and protein folding. An important difference with previous protocols is the absence of addition of MnCl2 to the growth medium and to the purification buffers, which usually most likely shifts the metal incorporation to the manganese form. Iron ions, as well as manganese ions, are already present in the normal growth media to a certain extent. However, additional FeSO4 was added to the growth medium in order to favor the incorporation of iron over manganese.
Subsequently, we attempted the incorporation of zinc together with iron to mimic the situation in the native enzyme. We added zinc (a) together with iron during expression, which was unsuccessful; (b) after the Ni2+‐column purification of Fe‐PP1α during cleavage of the tags, which led to incorporation of only about 10% as measured by ICP‐OES, and (c) in a metal exchange of the purified Fe‐PP1α protein, which led to unspecific binding of Zn2+ to the protein as monitored after buffer exchange by ICP‐OES. These attempts suggest that the incorporation of Zn2+ during recombinant protein expression in E. coli is more challenging than that of iron and manganese. This is contrary to the situation in mammalian cells, where purification of native PP1 from animal tissue resulted instead in a high incorporation of zinc of 74% (1.48 μm zinc for a protein concentration of 2 μm) with no detectable manganese, and only 8% iron (0.16 μm iron for a protein concentration of 2 μm), which was interpreted as loss of iron during purification and/or storage 8. When PP1 is expressed in E. coli, incorporation of zinc at a later stage during purification could be more difficult as the enzyme is already folded and the residual divalent cations already bound to the enzyme possibly disturb further zinc incorporation. Also, differences in cation availability and tolerance in bacteria and mammalian cells 22 could be a reason for the different preferential incorporation of metals into PP1.
Here, we then focused on the question of what effect the incorporation of iron has on structure and activity of PP1α compared to the presence of Mn2+.
We tested the enzymatic activity of our Fe‐PP1α sample with the fluorogenic substrate DiFMUP 11, with para‐nitrophenol phosphate (pNPP) 6, 13, and with a phosphopeptide carrying the N‐terminal sequence of histone 3, a known PP1 substrate (H3pT3 peptide) 12. We did not detect dephosphorylation activity with an enzyme concentration as high as 100 nm with H3pT3 peptide (Fig. S1B), and 1 nm with DiFMUP. As Fe‐PP1α was purified in the presence of β‐ME, a reducing agent that reduces cysteine residues but not iron (III), the freshly purified enzyme was likely in the oxidized Fe(III) state. In turn, incubation of the sample with 1 mm FeCl2 and 5 mm ascorbate (Asc) for 15 min at RT 23 rescued enzymatic activity, and induced Fe(II)‐PP1α‐catalyzed H3pT3 peptide and DiFMUP dephosphorylation efficiently (Fig. 1A,C; Fig. S1C,D). However, with pNPP still no activity was observed (Fig. 1B), which could reflect that the Fe‐containing enzyme appears to be selective toward pSer as reported for the native PP1N 6, 13. Asc addition did not make a difference to the activity of Mn‐PP1α (Fig. 1A,B,D). Only at high DiFMUP concentration (400 μm) Asc‐treated Mn‐PP1α was somewhat more active than the untreated (Fig. S1C), which could be due to residual Fe being present in Mn‐PP1α 7. These results support that oxidation of the iron renders the enzyme inactive and is consistent with the findings of Santos et al. 7 that ascorbate reactivates the metal center of PP1γ during oxidative stress. We then compared the catalytic efficiency of reactivated Fe(II)‐PP1α with that of Mn‐PP1α using DiFMUP, pNPP and the more physiological H3pT3 peptide substrate (Fig. 1D; Table 2). Probably due to electrochemical properties resulting in a different nucleophilicity of Fe2+ compared to Mn2+, Fe(II)‐PP1α shows in general a lower activity than Mn‐PP1α. However, the native enzyme showed a higher activity than Mn‐PP1α 8, and one explanation could be that this results from the combination of iron and zinc in the active site of native PP1 exerting an increase in the nucleophilicity of a water molecule and/or electrophilicity of the phosphate moiety in the substrate, or effecting the orientation of the substrate in the cavity 24. We also found that the relative V/K m was higher with the H3pT3 peptide as a substrate for Fe(II)‐PP1α, which together with the inactivity toward pNPP could reflect differences in substrate specificity compared to Mn‐PP1α, as observed previously with purified native PP1N 8. We furthermore asked whether Fe(II)‐PP1α and Mn‐PP1α were both sensitive to Inhibitor2 (I2) inhibition, as the native PP1N was found to be highly sensitive to this inhibition 25, and also Mn‐PP1α was previously shown to be sensitive to I2 12. We observed that both, Fe(II)‐PP1α and Mn‐PP1α, were sensitive to I2 inhibition (Fig. 1E; Fig. S1D–F). Addition of Asc did not change the degree of sensitivity of Mn‐PP1α. Finally, we wondered how native PP1N would behave toward the here tested substrates. Since the PP1N used here contained a contamination (see the Materials and methods), a quantitative comparison was not possible, and a titration with I2 was not feasible. Nevertheless, we observed that PP1N dephosphorylated both DiFMUP and the H3pT3 peptide, whereas in agreement with previous studies 6, 13, pNPP was not recognized (Fig. 2). Under these conditions, the addition of Asc did not change the activity of the enzyme.
Figure 1.
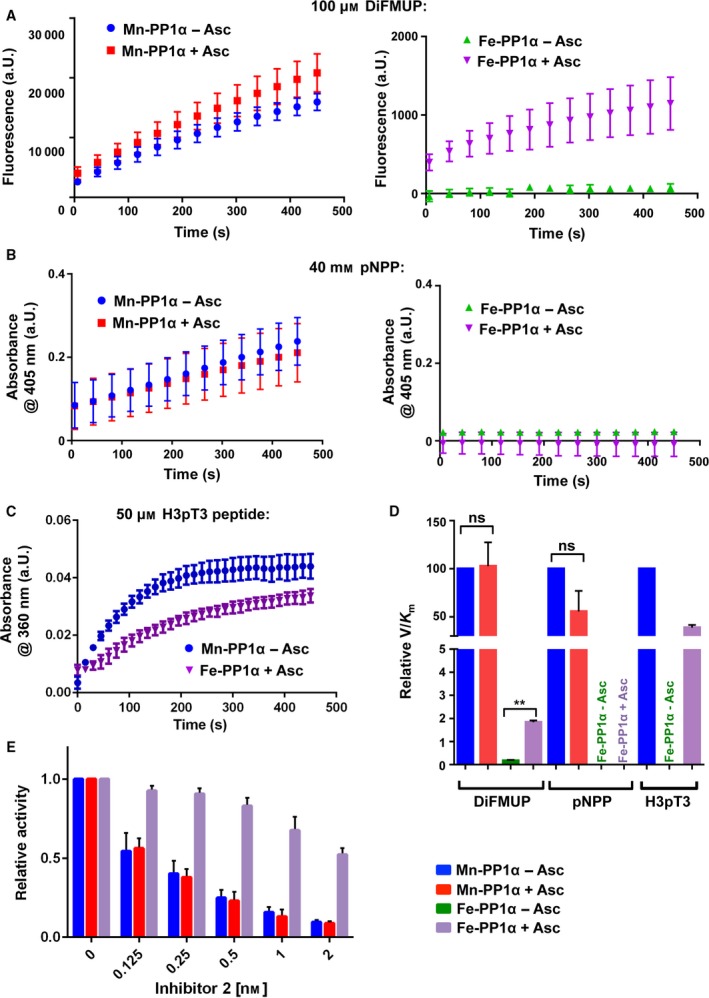
Biochemical characterization of Fe‐PP1α. (A) Mn/Fe‐PP1α–DiFMUP dephosphorylation assay. Traces of fluorescence signal with 100 μm DiFMUP after blank subtraction with or without Asc using 0.5 nm of PP1. Shown are mean ± SEM from two independent experiments. (B) Mn/Fe‐PP1α–pNPP dephosphorylation assay. Absorbance signal with 40 mm pNPP after blank subtraction with or without Asc using 50 nm of PP1. Shown are mean ± SEM from two independent experiments. (C) Mn/Fe‐PP1α–H3pT3 peptide dephosphorylation assay. Traces of absorbance signal with 50 μm H3pT3 peptide after blank subtraction using 20 nm of PP1. Since Fe‐PP1α requires Asc for activity and Mn‐PP1α does not (Fig. S1B), in this assay only the Fe‐PP1α with Asc and Mn‐PP1α without Asc was tested. Shown are mean ± SEM from two independent experiments. (D) Comparison of relative V/K m for Mn‐PP1α and Fe‐PP1α ± ascorbate with DiFMUP, pNPP, and H3pT3 peptide as a substrate. In all the cases relative V/K m values were normalized to Mn‐PP1 without Asc (considered as 100%), which was required since different assays were used. An unpaired t test was used for the statistical analysis: DiFMUP assay: SEM of Mn‐PP1α − ASC = 0.0; SEM of Mn‐PP1α + ASC = 24.75; P value = 0.9218; n = 2; SEM of Fe‐PP1α − ASC = 0.03433; SEM of Fe‐PP1α + ASC = 0.07426; P value = 0.0024; n = 2. pNPP: SEM of Mn‐PP1α − ASC = 0.0; SEM of Mn‐PP1α + ASC = 21.34; P value = 0.1731; n = 2. (E) Relative activity of Fe‐PP1α and Mn‐PP1α ± Asc with different Inhibitor 2 concentrations starting from 2 nm. The activity of 0.5 nm enzyme was determined with 100 μm DiFMUP and the respective Inhibitor 2 concentration. The activity was normalized to the sample without Inhibitor 2 addition. Error bars represent SD of the mean from three independent experiments. Not normalized bar plot and traces are shown in Fig. S1E–H.
Table 2.
k cat/K m values determined for Mn‐PP1α and Fe‐PP1α
| Substrate | Enzyme | K m (μm) | k cat (s−1) | k cat/K m (μm −1·s−1) |
|---|---|---|---|---|
| DiFMUPa | Mn‐PP1α − Asc | 53.3 ± 12.9 | 5.94 ± 0.45 | 0.11 ± 3.64 e‐2 |
| Mn‐PP1α + Asc | 101.1 ± 16.1 | 11.3 ± 0.68 | 0.11 ± 2.77 e‐2 | |
| Fe‐PP1α + Asc | n.a.b | n.a.b | 1.59 e‐3 ± 6.1 e‐4 | |
| H3pT3 peptidea | Mn‐PP1α − Asc | n.a.b | n.a.b | 6.03 e‐2 ± 3.53 e‐3 |
| Fe‐PP1α + Asc | n.a.b | n.a.b | 2.32 e‐2 ± 0.38 e‐3 |
aThe k cat/K m values with H3pT3 peptide and DiFMUP as substrates have been determined with two different enzymatic assays (see Materials and methods). The enzymatic activity with DiFMUP was monitored with a direct fluorescence assay, while the enzymatic activity with H3pT3 peptide was measured with a coupled assay based on absorbance. Therefore, the comparison in Fig. 1D is carried out with the relative V/K m taking as reference Mn‐PP1α − Asc. bBecause the kinetic data did not reach saturation, the k cat/K m value was obtained through linear plotting, and the single values could not be determined (see Materials and methods).
Figure 2.
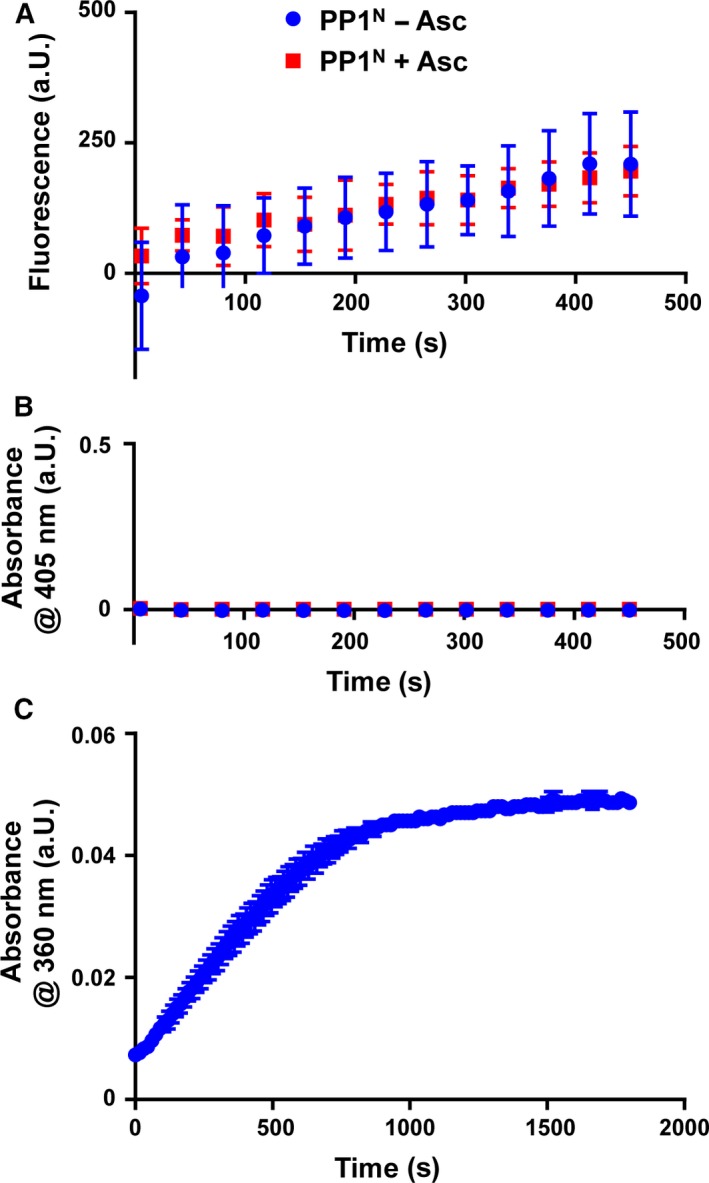
Activity of native PP1N toward DiFMUP, pNPP and H3pT3 peptide. (A) PP1N–DiFMUP dephosphorylation assay. Traces of fluorescence signal with 400 μm DiFMUP after blank subtraction with or without Asc using 5 nm of PP1. Mean ± SEM from two independent experiments are represented. (B) PP1N–pNPP dephosphorylation assay. Absorbance signal with 40 mm pNPP after blank subtraction with or without using 50 nm of PP1. The result is the mean ± SEM of two independent experiments. (C) PP1N–H3pT3 peptide dephosphorylation in the Enzchek phosphate assay. Absorbance signal after conversion of the substrate MESG by the enzyme PNP in a coupled assay containing 200 nm of PP1N and 100 μm of the H3pT3 peptide. The mean ± SD of three replicates from a single experiment is shown. Concentrations of PP1N are approximate (see the Materials and methods).
To investigate the structural effects of iron incorporation, we determined the 2.1 Å crystal structure of Fe(III)‐PP1α purified in the inactive state (see Table 1 for crystallization statistics). We also soaked crystals in 18 mm ascorbate to solve the structure of Fe(II)‐PP1α in the active state. Inactive Fe(III)‐PP1α forms an α/β fold highly similar to previous Mn‐PP1 structures 18, 26, 27, 28 (Fig. 3A: rmsd 0.350 on superposition of Cα atoms 29 with PDB 4MOV), showing that inactivity of oxidized Fe(III)‐PP1α is not due to major structural changes. The side chains overlay well with the structure of apo Mn‐PP1α 18 (Fig. 3B), without significant displacements of the active site residues, which gives validity to using Mn2+ ions instead of iron in structural studies. As in Mn‐PP1α, the two metal ions are bridged by the carboxylic group of D92 and position the catalytic water for the nucleophilic attack (see Fig. 3D for the electron density). The metal ion at site 1 is coordinated by the side chains of N124, H173, and H248, while the second metal binding site is formed by D64 and H66. Fe(III)‐PP1 binds inorganic phosphate in the active site that mimics the substrate phosphate as in apo Mn‐PP1α, with the side chain of R96 coordinating the phosphate group. Near the entrance to the active site, Y134 in Fe(III)‐PP1α shows a different orientation than in Mn‐PP1α, with a 1.3 Å displacement of the hydroxyl group. The overlay with other Mn‐PP1 structures confirms that although the hydroxyl group of Y134 is similarly pointed outwards in these, it is displaced in Fe‐PP1α by 1.0–1.4 Å 12, 30, 31. The different orientation of Y134 is stabilized by one bridging water between Y134 and R96, which is not present in Mn‐PP1, and this closer orientation toward the active site might account for differences in substrate accommodation. This finding is in agreement with the previous suggestion that incorporation of Mn2+ might generate a more open active site 8. Nevertheless, the presence of zinc in native PP1 could also contribute to substrate specificity, which due to the unaccomplished challenge of generating Fe‐Zn‐PP1 could not be addressed here. The structure of active Fe(II)‐PP1α treated with ascorbate is essentially identical to Fe(III)‐PP1α (rmsd 0.127 for superposition of Cα atoms 29) and closer inspection does not identify significant differences in the arrangement of the active site (Fig. 3C). This result shows that the inhibition and rescue of phosphatase activity in Fe‐PP1α do not rely on structural changes and are only related to the electronic properties of the iron cofactor.
Figure 3.
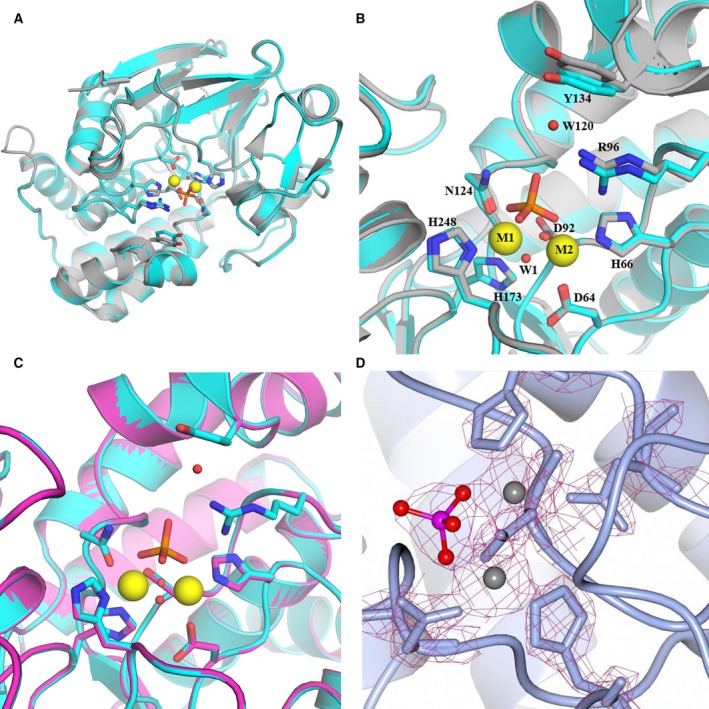
Comparison of PP1 structures. (A) Overall structure of Fe(III)‐PP1α (PDB 6G0J) in cyan superposed with apo Mn‐PP1α in gray (PDB 4MOV). (B) Superposition as in (A) showing side chains in the active site. For clarity, the phosphate group and metals are only shown from Fe‐PP1α, as they align perfectly with the respective atoms in Mn‐PP1α. Note the displacement of the hydroxyl group of Y134. (C) Same view as in (B) of the active site in Fe(III)‐PP1α (PDB 6G0J) superposed with reactivated Fe(II)‐PP1α (PDB 6G0I). (D) Electron density of the metal binding site of Fe‐PP1α. Similar to the extra density in apo Mn‐PP1α, this is consistent with the presence of a phosphate group was observed near the metal ions. In the structure of Fe‐PP1α cysteine side chains appear reduced, consistent with the use of β‐ME in the purification and activity assays. Only the peripheral residues C127 and C273 present electron density consistent with oxidation to a sulfenic group. The same peripheral residues were oxidized in the crystal structure of Mn‐PP1γ and it was demonstrated that this oxidation did not affect enzymatic activity 7.
In conclusion, we developed a protocol for expression and purification of PP1α, which provides good yields of highly pure and stable iron‐containing enzyme. The protocol does not require expensive or time‐consuming procedures such as the use of insect cell lines. The purified enzyme can be easily reactivated and used for biochemical studies. The incorporation of zinc together with iron will have to be accomplished in the future to answer questions on the role of zinc in the catalytic activity of PP1. Incorporation of iron into recombinant PP1 cannot account for all differences between PP1N and bacterially expressed PP1α. For example, Fe(II)‐PP1α is less active than Mn‐PP1α, which in turn is less active than native PP1 8. Other factors, for example zinc as second metal, will account for that. Nevertheless, Fe(II)‐PP1α behaves similar to PP1N in terms of substrate preference, thus reflecting a characteristic of PP1N. Furthermore, Fe‐PP1α requires activation by oxidation, whereas native PP1N does not, which could be due to the different expression environments including the presence/absence of cofactors and chaperones 13 to protect the iron in PP1N against oxidation. While reversible oxidation of a catalytic cysteine is a well‐established mechanism for regulation of protein tyrosine phosphatases 7, the physiological regulation of PP1 by reversible metal oxidation is only beginning to unveil. Our findings show that the oxidation state of the iron, not structural rearrangements within PP1 or of another metal, decides on the activity of PP1, offering a fast redox switch to control PP1 activity. As the most common reducing agent for 1‐electron reductions in the cell, the role of ascorbate in reverting oxidative inhibition of the iron cofactor in PP1α is physiologically highly relevant. Our studies have wide implications given that other members of the phosphoprotein phosphatase family also depend on metal ions for their catalytic mechanism and are redox regulated 32, 33, 34. Furthermore, the recombinant inactive enzyme could potentially be used as a tool to trap PP1 substrates, altogether providing a resource for future studies of this important enzyme.
Author contributions
FS carried out biochemical assays with DiFMUP and H3pT3 peptide, purification, crystallization, determined the structure, designed experiments, and wrote the manuscript. MT carried out biochemical assays with DiFMUP and pNPP, TK and BH with I2, PR with H3pT3 peptide and native PP1N; all analyzed the respective data. OB determined the structure and edited the manuscript. MK designed the research and experiments, analyzed the data, and wrote the manuscript.
Data accessibility
Supporting information
Fig. S1. Production and biochemical characterization of Fe‐PP1α.
Acknowledgements
We thank C. Scholz and S. Rheinberger, Institut für Geowissenschaften, Universität Heidelberg, for the ICP‐OES measurements. We thank the staff at European Synchrotron Radiation Facility (ESRF) for diffraction data collection. We thank M. Bollen, KU Leuven, for providing PP1N. This work was supported by an ERC starting grant (#336567) to MK.
Edited by Christian Griesinger
References
- 1. Ceulemans H and Bollen M (2004) Functional diversity of protein phosphatase‐1, a cellular economizer and reset button. Physiol Rev 84, 1–39. [DOI] [PubMed] [Google Scholar]
- 2. Tsaytler P, Harding HP, Ron D and Bertolotti A (2011) Selective inhibition of a regulatory subunit of protein phosphatase 1 restores proteostasis. Science 332, 91–94. [DOI] [PubMed] [Google Scholar]
- 3. Das I, Krzyzosiak A, Schneider K, Wrabetz L, D'Antonio M, Barry N, Sigurdardottir A and Bertolotti A (2015) Preventing proteostasis diseases by selective inhibition of a phosphatase regulatory subunit. Science 348, 239–242. [DOI] [PMC free article] [PubMed] [Google Scholar]
- 4. Carrara M, Sigurdardottir A and Bertolotti A (2017) Decoding the selectivity of eIF2alpha holophosphatases and PPP1R15A inhibitors. Nat Struct Mol Biol 24, 708–716. [DOI] [PMC free article] [PubMed] [Google Scholar]
- 5. Crespillo‐Casado A, Chambers JE, Fischer PM, Marciniak SJ and Ron D (2017) PPP1R15A‐mediated dephosphorylation of eIF2alpha is unaffected by Sephin1 or Guanabenz. Elife 6, pii: e26109. 10.7554/elife.26109 [DOI] [PMC free article] [PubMed] [Google Scholar]
- 6. Crespillo‐Casado A, Claes Z, Choy MS, Peti W, Bollen M and Ron D (2018) A Sephin1‐insensitive tripartite holophosphatase dephosphorylates translation initiation factor 2alpha. J Biol Chem 293, 7766–7776. [DOI] [PMC free article] [PubMed] [Google Scholar]
- 7. Santos CX, Hafstad AD, Beretta M, Zhang M, Molenaar C, Kopec J, Fotinou D, Murray TV, Cobb AM, Martin D et al (2016) Targeted redox inhibition of protein phosphatase 1 by Nox4 regulates eIF2alpha‐mediated stress signaling. EMBO J 35, 319–334. [DOI] [PMC free article] [PubMed] [Google Scholar]
- 8. Heroes E, Rip J, Beullens M, Van Meervelt L, De Gendt S and Bollen M (2015) Metals in the active site of native protein phosphatase‐1. J Inorg Biochem 149, 1–5. [DOI] [PubMed] [Google Scholar]
- 9. Verbinnen I, Ferreira M and Bollen M (2017) Biogenesis and activity regulation of protein phosphatase 1. Biochem Soc Trans 45, 89–99. [DOI] [PubMed] [Google Scholar]
- 10. Endo S, Connor JH, Forney B, Zhang L, Ingebritsen TS, Lee EY and Shenolikar S (1997) Conversion of protein phosphatase 1 catalytic subunit to a Mn(2+)‐dependent enzyme impairs its regulation by inhibitor 1. Biochemistry 36, 6986–6992. [DOI] [PubMed] [Google Scholar]
- 11. Fontanillo M, Zemskov I, Hafner M, Uhrig U, Salvi F, Simon B, Wittmann V and Köhn M (2016) Synthesis of highly selective submicromolar microcystin‐based inhibitors of protein phosphatase (PP)2A over PP1. Angew Chem Int Ed 55, 13985–13989. [DOI] [PMC free article] [PubMed] [Google Scholar]
- 12. Chatterjee J, Beullens M, Sukackaite R, Qian J, Lesage B, Hart DJ, Bollen M and Köhn M (2012) Development of a peptide that selectively activates protein phosphatase‐1 in living cells. Angew Chem Int Ed 51, 10054–10059. [DOI] [PMC free article] [PubMed] [Google Scholar]
- 13. MacKintosh C, Garton AJ, McDonnell A, Barford D, Cohen PT, Tonks NK and Cohen P (1996) Further evidence that inhibitor‐2 acts like a chaperone to fold PP1 into its native conformation. FEBS Lett 397, 235–238. [DOI] [PubMed] [Google Scholar]
- 14. Kabsch W (2010) Xds. Acta Crystallogr D 66, 125–132. [DOI] [PMC free article] [PubMed] [Google Scholar]
- 15. Evans P (2006) Scaling and assessment of data quality. Acta Crystallogr D 62, 72–82. [DOI] [PubMed] [Google Scholar]
- 16. Winn MD, Ballard CC, Cowtan KD, Dodson EJ, Emsley P, Evans PR, Keegan RM, Krissinel EB, Leslie AG, McCoy A et al (2011) Overview of the CCP4 suite and current developments. Acta Crystallogr D 67, 235–242. [DOI] [PMC free article] [PubMed] [Google Scholar]
- 17. McCoy AJ, Grosse‐Kunstleve RW, Adams PD, Winn MD, Storoni LC and Read RJ (2007) Phaser crystallographic software. J Appl Crystallogr 40, 658–674. [DOI] [PMC free article] [PubMed] [Google Scholar]
- 18. Choy MS, Hieke M, Kumar GS, Lewis GR, Gonzalez‐DeWhitt KR, Kessler RP, Stein BJ, Hessenberger M, Nairn AC, Peti W et al (2014) Understanding the antagonism of retinoblastoma protein dephosphorylation by PNUTS provides insights into the PP1 regulatory code. Proc Natl Acad Sci USA 111, 4097–4102. [DOI] [PMC free article] [PubMed] [Google Scholar]
- 19. Emsley P, Lohkamp B, Scott WG and Cowtan K (2010) Features and development of Coot. Acta Crystallogr D 66, 486–501. [DOI] [PMC free article] [PubMed] [Google Scholar]
- 20. Vagin AA, Steiner RA, Lebedev AA, Potterton L, McNicholas S, Long F and Murshudov GN (2004) REFMAC5 dictionary: organization of prior chemical knowledge and guidelines for its use. Acta Crystallogr D 60, 2184–2195. [DOI] [PubMed] [Google Scholar]
- 21. McNicholas S, Potterton E, Wilson KS and Noble ME (2011) Presenting your structures: the CCP4mg molecular‐graphics software. Acta Crystallogr D 67, 386–394. [DOI] [PMC free article] [PubMed] [Google Scholar]
- 22. Chandrangsu P, Rensing C and Helmann JD (2017) Metal homeostasis and resistance in bacteria. Nat Rev Microbiol 15, 338–350. [DOI] [PMC free article] [PubMed] [Google Scholar]
- 23. Yu JS (1998) Activation of protein phosphatase 2A by the Fe2+/ascorbate system. J Biochem 124, 225–230. [DOI] [PubMed] [Google Scholar]
- 24. Valasatava Y, Rosato A, Furnham N, Thornton JM and Andreini C (2018) To what extent do structural changes in catalytic metal sites affect enzyme function? J Inorg Biochem 179, 40–53. [DOI] [PMC free article] [PubMed] [Google Scholar]
- 25. Watanabe T, Huang HB, Horiuchi A, da Cruze Silva EF, Hsieh‐Wilson L, Allen PB, Shenolikar S, Greengard P and Nairn AC (2001) Protein phosphatase 1 regulation by inhibitors and targeting subunits. Proc Natl Acad Sci USA 98, 3080–3085. [DOI] [PMC free article] [PubMed] [Google Scholar]
- 26. Goldberg J, Huang HB, Kwon YG, Greengard P, Nairn AC and Kuriyan J (1995) Three‐dimensional structure of the catalytic subunit of protein serine/threonine phosphatase‐1. Nature 376, 745–753. [DOI] [PubMed] [Google Scholar]
- 27. Kelker MS, Page R and Peti W (2009) Crystal structures of protein phosphatase‐1 bound to nodularin‐R and tautomycin: a novel scaffold for structure‐based drug design of serine/threonine phosphatase inhibitors. J Mol Biol 385, 11–21. [DOI] [PMC free article] [PubMed] [Google Scholar]
- 28. Maynes JT, Bateman KS, Cherney MM, Das AK, Luu HA, Holmes CF and James MN (2001) Crystal structure of the tumor‐promoter okadaic acid bound to protein phosphatase‐1. J Biol Chem 276, 44078–44082. [DOI] [PubMed] [Google Scholar]
- 29. Krissinel E (2012) Enhanced fold recognition using efficient short fragment clustering. J Mol Biochem 1, 76–85. [PMC free article] [PubMed] [Google Scholar]
- 30. Ragusa MJ, Dancheck B, Critton DA, Nairn AC, Page R and Peti W (2010) Spinophilin directs protein phosphatase 1 specificity by blocking substrate binding sites. Nat Struct Mol Biol 17, 459–464. [DOI] [PMC free article] [PubMed] [Google Scholar]
- 31. O'Connell N, Nichols SR, Heroes E, Beullens M, Bollen M, Peti W and Page R (2012) The molecular basis for substrate specificity of the nuclear NIPP1:PP1 holoenzyme. Structure 20, 1746–1756. [DOI] [PMC free article] [PubMed] [Google Scholar]
- 32. Namgaladze D, Hofer HW and Ullrich V (2002) Redox control of calcineurin by targeting the binuclear Fe(2+)‐Zn(2+) center at the enzyme active site. J Biol Chem 277, 5962–5969. [DOI] [PubMed] [Google Scholar]
- 33. Wang X, Culotta VC and Klee CB (1996) Superoxide dismutase protects calcineurin from inactivation. Nature, 383, 434–437. [DOI] [PubMed] [Google Scholar]
- 34. Ferri A, Gabbianelli R, Casciati A, Paolucci E, Rotilio G and Carrì MT (2000) Calcineurin activity is regulated both by redox compounds and by mutant familial amyotrophic lateral sclerosis‐superoxide dismutase. J Neurochem 75, 606–613. [DOI] [PubMed] [Google Scholar]
Associated Data
This section collects any data citations, data availability statements, or supplementary materials included in this article.
Supplementary Materials
Fig. S1. Production and biochemical characterization of Fe‐PP1α.