Abstract
The use of traditional American Joint Committee on Cancer (AJCC) staging alone has limitations in predicting patient survival with nodular melanoma (NM). We aimed to establish a comprehensive prognostic nomogram and compare its prognostic value with the AJCC staging system.
A nomogram was constructed to predict the 3-year and 5-year survival rates of NM patients by Cox regression. Several common model-validation parameters were used to evaluate the performance of our survival model.
The multivariate analyses demonstrated that the age at diagnosis; being divorced, separated, or widowed; AJCC stages II, III, and IV; a regional SEER stage and the lymph-node density (LND) were risk factors for survival. The concordance index, the area under the time-dependent receiver operating characteristic curve, and calibration plots indicated that the nomogram performed well, while the net reclassification improvement and the integrated discrimination improvement showed that the nomogram performed better than the AJCC staging system. Finally, the decision curve analyses curves of the nomogram yielded net benefits that were higher than when using AJCC staging system with either the training or the validation cohort.
The prognostic value of the nomogram is better than that of the AJCC staging system alone. In addition, we found that LND is an important risk factor for the survival of NM patients. The nomogram developed in this study may be a valuable tool for clinical practice when advising patients about their survival risk over the next 3 to 5 years.
Keywords: nodular melanoma, nomogram, prognosis, risk factors, survival
1. Introduction
Cutaneous melanoma (CM) is a heterogeneous type of cancer that is the sixth-most-common malignant cancer in the USA.[1,2] The most-common histopathological subtypes of CM are superficial diffuse melanoma (60%–80%), nodular melanoma (NM) (14%–15%), and malignant melanoma (5%–15%).[3,4] The morbidity and mortality rates associated with melanoma have increased in most parts of the world over the past few decades.[5] According to a fact sheet of the National Cancer Institute based on the surveillance, epidemiology, and end result (SEER) database (http://seer.cancer.gov/statfacts/html/melan.html; accessed January 25, 2018), the number of new melanoma cases in 2017 was estimated at 87,110, accounting for 5.2% of all new cancer cases, and the estimated death toll was 9730. NM is the most aggressive form of melanoma. Almost 50% of NMs have a tumor thickness of at least 2 mm at the time of diagnosis.[6–10] Compared with other melanoma subtypes, NM has been shown to have a faster growth rate, greater bioavailability, and greater mitosis.[3,11–14] Studies have shown that although NM accounts for 14% to 15% of all CM cases, it leads to more than 37% to 40% of melanoma deaths.[2,4] There is also increasing evidence that NM is clinically unique, and so the early diagnosis and prognosis of NM is particularly important.
The American Joint Committee on Cancer (AJCC) staging of CM is based on the primary tumor thickness and the presence of ulceration, mitosis, lymph-node spread, and distant metastasis as determinants of the prognosis. However, there remain limitations to using the AJCC staging system alone, and the survival outcomes can vary widely for tumors at the same stage. Given the clinical uniqueness of NM, novel prognostic tools are needed to improve the accuracy of predicting survival in NM patients.[15]
A nomogram is a convenient graphical representation of a mathematical model that combines various important factors to predict a specific endpoint.[16] Nomograms have become a reliable and convenient tool for quantifying risk, and they are widely used for estimating the prognosis of cancer.[17,18] Factors such as race, sex, and age have all been demonstrated to be important prognostic factors for melanoma,[19,20] and ignoring such significant prognostic parameters may reduce the accuracy of survival predictions. The aim of this study was to establish a comprehensive prognostic evaluation system based on multiple prognostic parameters and compare its prognostic value with that of the AJCC staging system.
2. Methods
2.1. Patient selection
We used SEER∗ Stat (version 8.3.5, https://seer.cancer.gov/) to review patient data from the latest version of the SEER database (covering 18 registries). We searched for relevant NM patients using histological type code 8721 of the the third edition of the International Classification of Diseases for Oncology. We excluded patients younger than 18 years, as were cases that were not confirmed by microscopy or only autopsy, and cases with unknown or incomplete variables. Several variables were examined, including age, origin recode NHIA, sex, marital status, SEER stage, insurance status, and lymph-node density (LND). We used the 7th edition of the AJCC staging system, and restricted our search to between 2010 and 2015, because the system was first reported on in 2010.
There were 5102 eligible patients identified in the SEER database. For nomogram construction and validation, we randomly assigned 70% of the patients to the training cohort (n = 3571) and 30% to the validation cohort (n = 1531).
2.2. Statistical analysis
Continuous variables conforming to a normal distribution were expressed as mean and standard deviation values, while other continuous variables were expressed as median (25th–75th percentile) values. Categorical variables were expressed as percentages. Variables were selected using the backward stepwise selection method in the Cox regression model for the training cohort. A nomogram for predicting the 3-year and 5-year survival rates of NM patients was constructed based on the predictive model with the identified prognostic factors.
The predictive accuracy of this nomogram was evaluated by the concordance index (C-index) and the area under the time-dependent receiver operating characteristic curve (AUC). The agreement between the predicted probabilities and the actual outcomes was evaluated by calibration plotting. Both discrimination and calibration were evaluated using bootstrapping with 1000 resamples.
The net reclassification improvement (NRI) and the integrated discrimination improvement (IDI) were used to compare the accuracy of the 2 models in order to determine the improvement obtained by using the new predictive model. The clinical value of the predictive models was tested using decision curve analyses (DCAs). All statistical analyses were performed using SPSS (version 24.0, SPSS, Chicago, IL) and R software. A 2-sided P ≤ .05 was considered to be statistically significant.
2.3. Ethical review
Given that cancer is a reportable disease in every state of the USA, informed patient consent is not required. When a data use agreement was signed, data on cancer research become available to the public free of charge.
3. Results
3.1. Patient characteristics
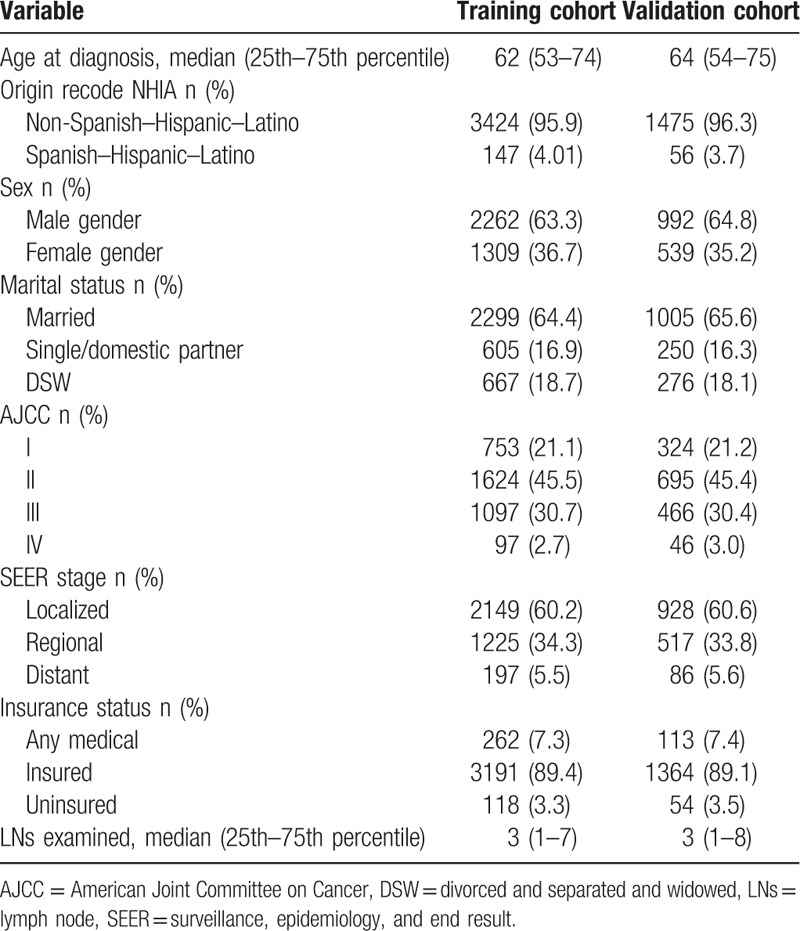
The median age at the time of diagnosis was 62 years in the training cohort and 64 years in the validation cohort. Most of the patients were male, married, and in AJCC stage II or III. In both cohorts, about 60% of patients had a localized SEER stage, 33% had a regional SEER stage, and 5.0% had a distant SEER stage. About 89% of patients had insurance. The median follow-up times were 25 months and 24 months in the training and validation cohorts, respectively. The demographics and tumor characteristics of patients are summarized in Table 1.
Table 1.
Patient characteristics in the study.
3.2. Independent prognostic factors in the training cohort
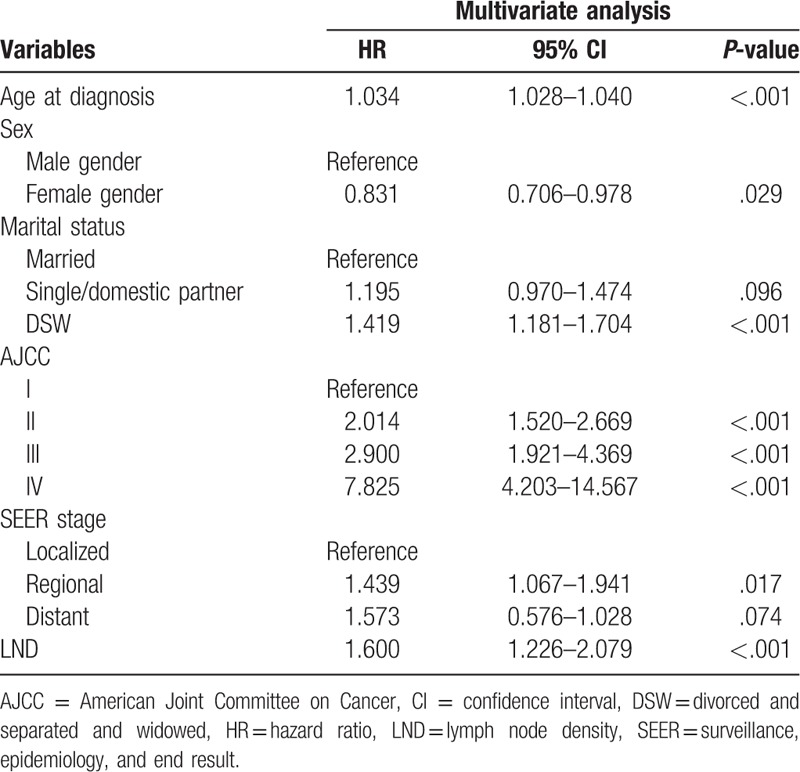
After performing a univariate Cox regression analysis, data on the age at diagnosis, sex, marital status, AJCC stage, SEER stage, and LND were entered into multivariable Cox regression analyses. The multivariate analyses demonstrated that age at diagnosis (hazard ratio [HR] = 1.034, P < .001), being divorced, separated, or widowed (DSW) (HR = 1.419 vs married, P < .001), AJCC stage II (HR = 2.014 vs AJCC stage I, P < .001), AJCC stage III (HR = 2.900 vs AJCC stage I, P < .001), AJCC stage IV (HR = 7.825 vs AJCC stage I, P < .001), and regional SEER stage (HR = 1.573 vs localized, P = .017) were risk factors for survival. In particular, we found that LND was also a risk factor affecting the survival of NM patients (HR = 1.600, P < .001) (Table 2).
Table 2.
Selected variables by multivariate Cox regression analysis (training cohort).
3.3. Prognostic nomogram for survival
A nomogram that incorporated all of the significant independent factors for predicting the 3-year and 5-year survival rates in the training cohort was established, based on selected variables according to their HRs. The nomogram showed that age was the most important factor contributing to the prognosis, followed by the AJCC stage, LND, SEER stage, marital status, and sex. The nomogram is used by first giving each variable a score on its points scale. The scores for all variables are then added to obtain the total score, and a vertical line is dropped down from the total-points row to estimate the 3-year and 5-year survival rates (Fig. 1).
Figure 1.
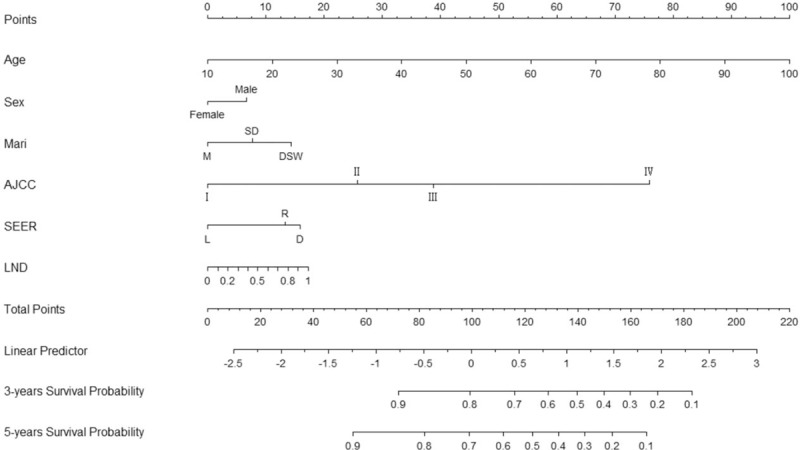
Nomogram predicting 3- and 5-year survival. Mari = marital status: DSW = divorced and separated and widowed, M = married, SD = single/domestic partner. SEER stage: D = distant, L = localized, R = regional, LND = lymph node density.
3.4. Performance of the nomogram
The C-index provided by the nomogram (0.744 for the training cohort and 0.729 for the validation cohort) were higher than the C-index of the AJCC staging system (0.679 and 0.684, respectively). For the nomogram, the AUCs of the training cohort (0.748 at 3 years and 0.759 at 5 years) and validation cohort (0.735 and 0.742, respectively) indicated that the model had a good discriminative ability and a better AUC than the AJCC staging system (Fig. 2). Calibration plots of the nomogram showed that the predicted 3-year and 5-year survival probabilities of the SEER training and validation cohorts were almost identical to the actual observations (Fig. 3).
Figure 2.
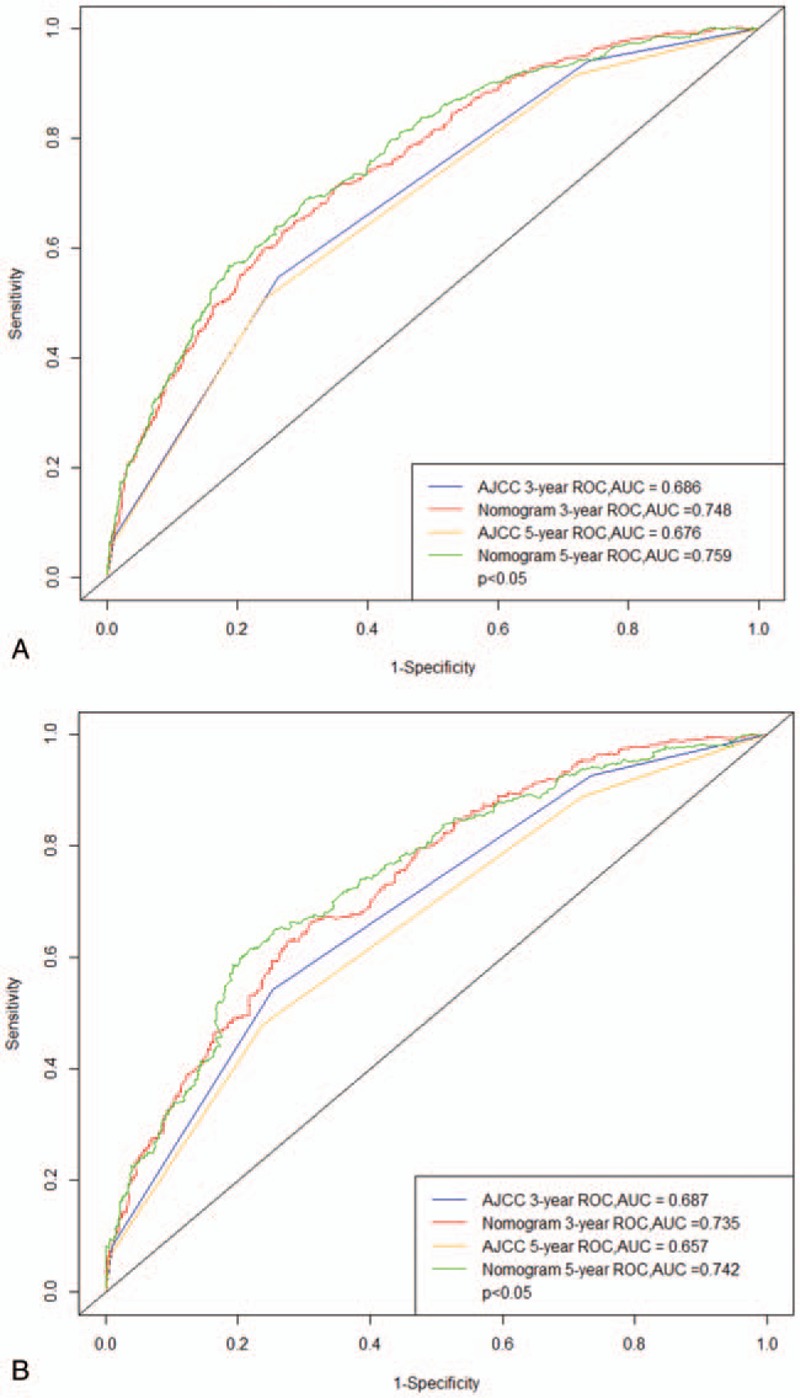
ROC curves. The ability of the model to be measured by the C index. A came from the training set, and B came from the validation set. ROC = receiver operating characteristic.
Figure 3.
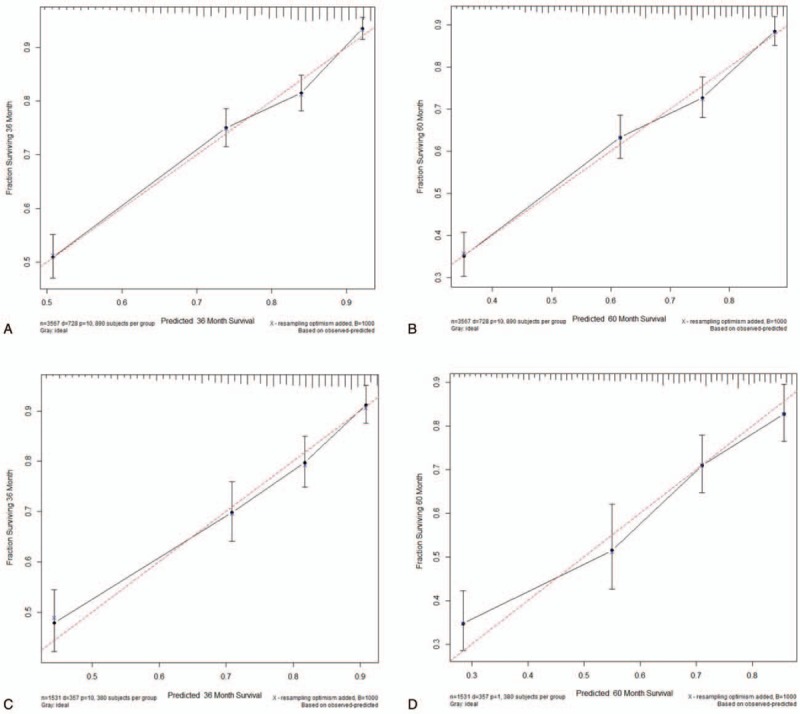
Calibration plots. Show the relationship between the predicted probabilities base on the nomogram and actual values of the train set (A and B) and validation set (C and D).
The NRI values at 3 years and 5 years of follow-up were 0.368 (95% confidence interval [CI] = 0.231–0.507) and 0.442 (95% CI = 0.294–0.640), respectively, in the validation cohort. These values indicate that the nomogram had greatly improved predictive performance. Similarly, in the validation cohort, the IDI values at 3 years and 5 years were 0.053 and 0.061, respectively (both P < .001). These findings also validate the superior predictive performance of the nomogram.
3.5. Decision curve analysis
The results show that although both models yielded net benefits, these benefits were greater for the 3-year and 5-year DCA curves of the nomogram than for the traditional AJCC staging system in both the training and validation cohorts (Fig. 4).
Figure 4.
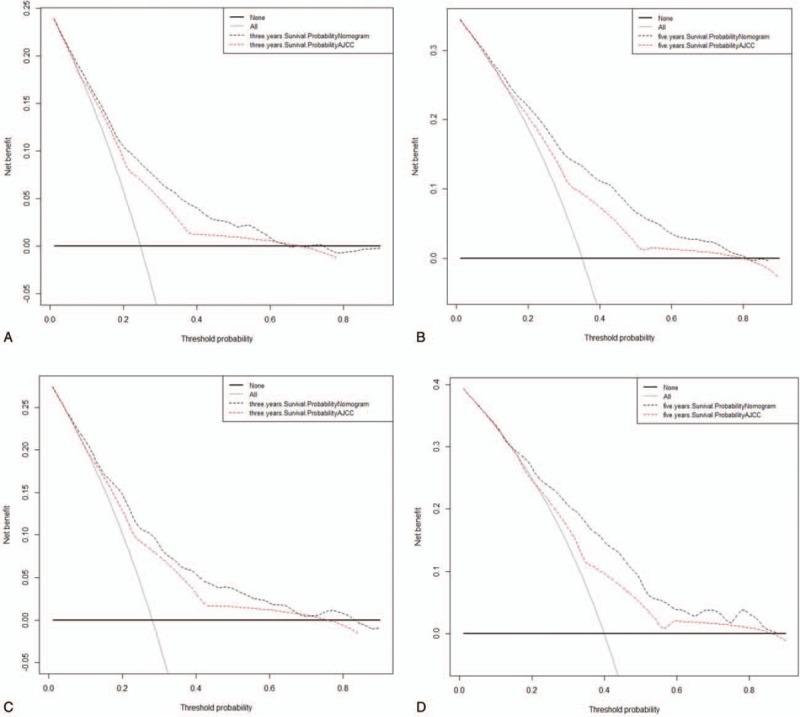
Decision curve analysis. In the figure, the abscissa is the threshold probability, the ordinate is the net benefit rate. The horizontal one indicates that all samples are negative and all are not treated, with a net benefit of 0. The oblique one indicates that all samples are positive. The net benefit is a backslash with a negative slope. A and B came from the training set, and C and D came from the validation set.
4. Discussion
NM is the second-most-common histological subtype of melanoma, with a greater biological aggressivity than radial growth lesions.[21,22] There is increasing evidence that NM contributes disproportionately to melanoma deaths, making it a particularly important subtype to characterize.[23–26] Mar et al showed that NM contributed the most to deaths from melanoma in all tumor subtypes.[27] Further research is needed on the prognosis of NM. Although the AJCC staging system has significant predictive power for the prognosis of melanoma patients, it does not include some important risk factors such as age, sex, and marital status. We have therefore developed a more-comprehensive predictive model, including not only the AJCC staging system but also patient demographics and other clinical parameters. Our model can provide more-accurate data that will help medical workers to predict the prognosis of patients more accurately. The nomogram is an excellent tool for risk assessment with a high recognition ability to provide a quantitative prognosis for individual patients, making it more sensitive and informative.[28–30]
As in most previous studies, the multivariate Cox regression analysis performed in our study showed higher age to be a risk factor for survival in NM patients, while being female appeared to be a protective factor. Other risk factors for survival were DSW (vs married), a higher AJCC stage, and a regional SEER stage (vs localized SEER stage). DSW has been proven by many studies to be a risk factor for cancer and previous studies have shown that marital status is associated with melanoma morbidity and mortality.[31,32] Our study also demonstrates that DSW is a risk factor for NM patients. It is worth noting that this study is the first to include insurance status and LND in an analysis of NM patients. The prognosis appears as a line graph, and it was found that LND is a risk factor for patient survival. To the best of our knowledge, there is no previous description of the effect of LND on the survival of patients with NM in the literature. In addition, LND made a relatively large contribution to the nomogram we constructed. All of this new information can further help clinicians when they are making clinical decisions.
We have developed and validated an easy-to-use example nomogram for predicting 3-year and 5-year survival rates in NM patients. Our nomogram model contains risk factors that are easily available to collect from historical records. The nomogram is both highly clinically applicable and easy to use. To further assess whether the prognostic model performed better than the traditional AJCC staging system, we evaluated the performance of our survival model using several common model-validation parameters: discrimination, calibration, NRI, IDI, and DCA. Our model performed well, showing good discrimination as indicated by a C-index of 0.744 for the training cohort and 0.729 for the validation cohort, which is higher than the values for the AJCC staging system. The AUC of the AJCC staging system was also lower than that of the nomogram. In the validation cohort, the 3-year and 5-year AUCs were 0.735 and 0.742, respectively, for the nomogram, but only 0.687 and 0.675 for the AJCC staging system. The discriminative power of the nomogram was significantly higher than that of the AJCC staging system. In both the training and verification cohorts, plots approximating a 45-degree line indicated that the nomogram predictions were well calibrated (Fig. 3).
We also introduced 2 indicators that are more sensitive than the C-index: NRI and IDI. NRI reflects how the nomogram reclassifies the risk probabilities better than the AJCC staging system, while IDI reflects the improvement in the ability of the nomogram to distinguish between AJCC stages. The positive results further demonstrated the superior performance of the nomogram. We also applied the latest analytical technique of DCA, whose demonstrated benefits have led to recommendations to use it. The results showed that the 3-year and 5-year DCA curves for the new model yield net benefits greater than the traditional AJCC staging system in both the training and validation cohorts.
The greatest strengths of this study include the large population and the high quality of the SEER database, and population-based findings are more common than those from a single study. However, this study was also subject to some limitations. First, it utilized retrospective data and so was inevitably affected by bias. Second, data were not available on some prognostic factors such as chemotherapy data and tumor markers. Third, we only included patients with complete information for whom the nomogram could be used to calculate the predicted survival. This would have resulted in some patients being excluded and may also have introduced selection bias. External validation with other populations is needed to provide a more accurate assessment of the model performance. Finally, the predicted values calculated using the nomogram only represent reference information to be interpreted by clinicians, rather than providing absolutely accurate prognoses.
In conclusion, we have developed and validated an NM prognosis nomogram that is highly accurate. The prognostic value of the nomogram is better than that of the AJCC staging system alone. In addition, we found that LND is an important risk factor for the survival of NM patients. The nomogram developed in this study may be a valuable tool in clinical consultations to better understand the 3-year and 5-year survival rates of patients.
Author contributions
Conceptualization: Yuanjie Li, Jun Lyu.
Data curation: Jin Yang, Zhenyu Pan, Yuanjie Li, Jun Lyu.
Formal analysis: Jin Yang, Zhenyu Pan.
Methodology: Jin Yang, Zhenyu Pan.
Software: Jin Yang, Fanfan Zhao, Xiaojie Feng, Qingqing Liu.
Supervision: Yuanjie Li, Jun Lyu.
Validation: Jin Yang, Zhenyu Pan, Fanfan Zhao, Xiaojie Feng, Qingqing Liu.
Visualization: Yuanjie Li, Jun Lyu.
Writing – original draft: Jin Yang.
Writing – review and editing: Jin Yang, Yuanjie Li.
Footnotes
Abbreviations: AJCC = American Joint Committee on Cancer, AUC = the area under the time-dependent receiver operating characteristic curve, C-index = concordance index, CM = cutaneous melanoma, DCA = the decision curve analyses, DSW = divorced, separated, or widowed, HR = hazard ratio, IDI = the integrated discrimination improvement, LND = lymph-node density, NM = nodular melanoma, NRI = the net reclassification improvement, SEER = the surveillance, epidemiology, and end result.
JY and ZP contributed equally to this work.
This study was supported by the National Social Science Foundation of China (No. 16BGL183) and the Research Fund of Health Bureau of Xi’an (No. QFO1330).
The authors have no funding and conflicts of interest to disclose.
References
- [1].Green A, Viros A, Hughes M, et al. Nodular melanoma: a histopathologic entity? Acta Dermato Venereologica 2018;98:460–2. [DOI] [PubMed] [Google Scholar]
- [2].Corneli P, Zalaudek I, Magaton RG, et al. Improving the early diagnosis of early nodular melanoma: can we do better? Expert Rev Anticancer Ther 2018;18:1007–12. [DOI] [PubMed] [Google Scholar]
- [3].Liu W, Dowling JP, Murray WK, et al. Rate of growth in melanomas: characteristics and associations of rapidly growing melanomas. Arch Dermatol 2006;12:1551–8. [DOI] [PubMed] [Google Scholar]
- [4].Mayer JE, Adams BB. Nodular melanoma serendipitously detected by airport full body scanners. Dermatology 2015;230:16–7. [DOI] [PubMed] [Google Scholar]
- [5].Geller AC, Swetter SM, Brooks K, et al. Screening, early detection, and trends for melanoma: current status (2000–2006) and future directions. J Am Acad Dermatol 2007;57:555–72. [DOI] [PubMed] [Google Scholar]
- [6].Dessinioti C, Geller AC, Stergiopoulou A, et al. Association of skin examination behaviors and thinner nodular vs superficial spreading melanoma at diagnosis. Jama Dermatol 2018;154:E1–0. [DOI] [PMC free article] [PubMed] [Google Scholar]
- [7].Warycha MA, Christos PJ, Mazumdar M, et al. Changes in the presentation of nodular and superficial spreading melanomas over 35 years. Cancer-Am Cancer Soc 2008;113:3341–8. [DOI] [PMC free article] [PubMed] [Google Scholar]
- [8].Demierre MF, Chung C, Miller DR, et al. Early detection of thick melanomas in the United States. Arch Dermatol 2005;141:745–50. [DOI] [PubMed] [Google Scholar]
- [9].Zalaudek I, Moscarella E, Longo C, et al. No one should die of melanoma: a vision or impossible mission? Melanoma Manag 2014;1:41–6. [DOI] [PMC free article] [PubMed] [Google Scholar]
- [10].Chamberlain AJ, Fritschi L, Giles GG, et al. Nodular type and older age as the most significant associations of thick melanoma in Victoria, Australia. Arch Dermatol 2002;138:609–14. [DOI] [PubMed] [Google Scholar]
- [11].Shen S, Wolfe R, McLean CA, et al. Characteristics and associations of high-mitotic-rate melanoma. JAMA Dermatol 2014;150:1048–55. [DOI] [PubMed] [Google Scholar]
- [12].Kalkhoran S, Milne O, Zalaudek I, et al. Historical, clinical, and dermoscopic characteristics of thin nodular melanoma. Arch Dermatol 2010;146:311–8. [DOI] [PubMed] [Google Scholar]
- [13].Faut M, Wevers KP, van Ginkel RJ, et al. Nodular histologic subtype and ulceration are tumor factors associated with high risk of recurrence in sentinel node-negative melanoma patients. Ann Surg Oncol 2017;24:142–9. [DOI] [PMC free article] [PubMed] [Google Scholar]
- [14].Green AC, Baade P, Coory M, et al. Population-based 20-year survival among people diagnosed with thin melanomas in Queensland, Australia. J Clin Oncol 2012;30:1462–7. [DOI] [PubMed] [Google Scholar]
- [15].Weiss SA, Hanniford D, Hernando E, et al. Revisiting determinants of prognosis in cutaneous melanoma. Cancer-Am Cancer Soc 2015;121:4108–23. [DOI] [PMC free article] [PubMed] [Google Scholar]
- [16].Zhang G, Wu Y, Zhang J, et al. Nomograms for predicting long-term overall survival and disease-specific survival of patients with clear cell renal cell carcinoma. OncoTargets and Therapy 2018;11:5535–44. [DOI] [PMC free article] [PubMed] [Google Scholar]
- [17].Cao J, Yuan P, Wang L, et al. Clinical nomogram for predicting survival of esophageal cancer patients after esophagectomy. Sci Rep-Uk 2016;6:1–8. [DOI] [PMC free article] [PubMed] [Google Scholar]
- [18].Sun W, Jiang YZ, Liu YR, et al. Nomograms to estimate long-term overall survival and breast cancer-specific survival of patients with luminal breast cancer. Oncotarget 2016;7:20496–506. [DOI] [PMC free article] [PubMed] [Google Scholar]
- [19].Cherobin ACFP, Wainstein AJA, Colosimo EA, et al. Prognostic factors for metastasis in cutaneous melanoma. An Bras Dermatol 2018;93:19–26. [DOI] [PMC free article] [PubMed] [Google Scholar]
- [20].Enninga E, Moser JC, Weaver AL, et al. Survival of cutaneous melanoma based on sex, age, and stage in the United States. Cancer Med 2017;6:2203–12. [DOI] [PMC free article] [PubMed] [Google Scholar]
- [21].Richard MA, Grob JJ, Avril MF, et al. Melanoma and tumor thickness: challenges of early diagnosis. Arch Dermatol 1999;135:269–74. [DOI] [PubMed] [Google Scholar]
- [22].Chamberlain AJ, Fritschi L, Kelly JW. Nodular melanoma: patients’ perceptions of presenting features and implications for earlier detection. J Am Acad Dermatol 2003;48:694–701. [DOI] [PubMed] [Google Scholar]
- [23].Moreau JF, Weinstock MA, Geller AC, et al. Individual and ecological factors associated with early detection of nodular melanoma in the United States. Melanoma Res 2014;24:165–71. [DOI] [PubMed] [Google Scholar]
- [24].Florent Grange MP, Coralie Barbe M, Francois Aubin MP, et al. Clinical and sociodemographic characteristics associated with thick melanomas. Arch Dermatol 2012;12:1370–6. [DOI] [PubMed] [Google Scholar]
- [25].Demierre MF, Chung C, Miller DR, et al. Early detection of thick melanomas in the United States. Arch Dermatol 2005;6:745–50. [DOI] [PubMed] [Google Scholar]
- [26].Shaikh WR, Xiong M, Weinstock MA. The contribution of nodular subtype to melanoma mortality in the United States, 1978 to 2007. Arch Dermatol 2012;148:30–6. [DOI] [PubMed] [Google Scholar]
- [27].Mar V, Roberts H, Wolfe R, et al. Nodular melanoma: a distinct clinical entity and the largest contributor to melanoma deaths in Victoria, Australia. J Am Acad Dermatol 2013;4:568–75. [DOI] [PubMed] [Google Scholar]
- [28].Shariat SF, Karakiewicz PI, Suardi N, et al. Comparison of nomograms with other methods for predicting outcomes in prostate cancer: a critical analysis of the literature. Clin Cancer Res 2008;14:4400–7. [DOI] [PubMed] [Google Scholar]
- [29].Voskoboynik MAH. Improving patient selection for phase I oncology trials. J Clin Oncol 2014;28:3198–9. [DOI] [PubMed] [Google Scholar]
- [30].Balachandran VP, Gonen M, Smith JJ, et al. Nomograms in oncology: more than meets the eye. Lancet Oncol 2015;16:173–80. [DOI] [PMC free article] [PubMed] [Google Scholar]
- [31].Reyes Ortiz CA, Freeman JL, Kuo YF, et al. The influence of marital status on stage at diagnosis and survival of older persons with melanoma. J Gerontol A Biol Sci Med Sci 2007;62:892–8. [DOI] [PubMed] [Google Scholar]
- [32].Jiang AJ, Rambhatla PV, Eide MJ. A systematic review of socioeconomic and lifestyle factors and melanoma. Br J Dermatol 2015;172:885–915. [DOI] [PubMed] [Google Scholar]


