

Abstract
Background
Although the mortality rates of clear cell renal cell carcinoma (ccRCC) have decreased in recent years, the clinical outcome remains highly dependent on the individual patient. Therefore, identifying novel biomarkers for ccRCC patients is crucial.
Material/Methods
In this study, we obtained RNA sequencing data and clinical information from the TCGA database. Subsequently, we performed integrated bioinformatic analysis that includes differently expressed genes analysis, gene ontology and KEGG pathway analysis, protein-protein interaction analysis, and survival analysis. Moreover, univariate and multivariate Cox proportional hazards regression models were constructed.
Results
As a result, we identified a total of 263 dysregulated genes that may participate in the metastasis of ccRCC, and established a predictive signature relying on the expression of OTX1, MATN4, PI3, ERVV-2, and NFE4, which could serve as significant progressive and prognostic biomarkers for ccRCC.
Conclusions
We identified differentially expressed genes that may be involved in the metastasis of ccRCC. Moreover, a predictive signature based on the expression of OTX1, MATN4, PI3, ERVV-2, and NFE4 could be an independent prognostic factor for ccRCC.
MeSH Keywords: Biological Markers; Carcinoma, Renal Cell; Gene Expression; Prognosis
Background
Clear cell renal cell carcinoma (ccRCC) is the most common malignancy in the kidneys, which has increasing incidence and mortality rates worldwide [1]. Treatments for localized ccRCC can vary from radio-frequency ablation to partial or radical nephrectomy; however, once RCC progresses to distant metastasis, the curative effect of current targeted drug therapies is limited [2]. Additionally, when first diagnosed, approximately 30% patients already have metastasis [1]. Therefore, it is urgent to understand the underlying mechanism of metastasis and to identify novel biomarkers with greater prognostic values.
The TNM staging system has been used for over 80 years and is important for estimating the outcome of various cancers; however, it provides an incomplete prognostic value [3–5]. Clinical outcomes can differ significantly among patients with the same tumor stage [6]. Despite surgical removal of the tumor, a subgroup of patients experience recurrence, indicating that at the time of curative surgery, the metastasis was already present [7]. However, no consensus was reached regarding the surveillance protocols of RCC, and no available tumor-associated biomarkers can predict recurrence in patients who may have benefited from earlier therapy [8]. Previous studies in colorectal cancer proposed several gene signatures and proved to be useful in predicting prognosis [9–11]. In this study, we divided patients from the Cancer Genome Atlas database into a non-metastasis group and a metastasis group in order to screen the differently expressed genes. Furthermore, we constructed a risk scoring system based on upregulated genes involved in metastasis to identify a multi-gene signature for use as an independent predictor for ccRCC.
Material and Methods
Data collection
The TCGA database contains large cohorts of genomic abnormalities and clinical information across the world, and is publicly available. RNA sequencing counts data from the ccRCC cohort, which consists of 539 tumor samples and 72 normal tissues, were obtained from the TCGA data portal (https://tcga-data.nci.nih.gov/tcga/). Clinical data pertaining to patients’ age, gender, grade, stage, survival and recurred/progressed outcome were also acquired from the TCGA data portal. We divided patients based on N stage and M stage into 2 groups. Patients with both M0 and N0 stage were assigned to the non-metastasis group, whereas M1 and/or N1 patients were assigned to the metastasis group.
Identification of differentially expressed genes (DEGs)
We identified the DEGs using the edgeR package, with a cutoff of adj.p-value <0.05 and a |logFC| >2 [12]. DEGs were visualized with volcano plot through the gplots package in R (version 3.5.2).
Enrichment analysis of DEGs
We performed a functional enrichment analysis of the DEGs using DAVID (Database for Annotation, Visualization, and Integrated Discovery) to determine the gene ontology (GO) categories by using cellular component (CC), molecular function (MF), or biological processes (BP), as well as KEGG (Kyoto Encyclopedia of Genes and Genomes) pathway [13]. P<0.05 was defined as significant enrichment. An online web tool was used to visualized these processes (http://www.ehbio.com/ImageGP/).
Construction of PPI network
We used the STRING database to retrieve the protein-protein interaction (PPI) network of DEGs, and we used Cytoscape software to reconstruct and visualize the network [14,15]. Individual network modules with 10 or more nodes were shown.
Univariate and multivariate Cox analysis to screen the candidate genes
CcRCC samples were separated into 2 groups according to the median gene expression. Then, age (≤60/>60), sex (male/female), grade (G1–G2/G3–G4), stage (I–II/III–IV), T stage (T1–T2/T3–T4), N stage (N0/N1), M stage (M0/M1), specific gene, and survival data (time and state) were all included into the Cox regression model to preform univariate and multivariate Cox analysis using SPSS 22.0 (IBM Corporation, Armonk, NY, USA).
Establishment of a prognostic signature based on candidate genes
The stepwise multivariate Cox regression analysis model was constructed based on the candidate genes to extract the mRNA-based model with the best predictive ability. The criteria for inclusion and exclusion was set as P<0.05. Subsequently, the risk score for each patient was computed using the mRNA-based prognostic model as follows: Risk score=expRNA1*βRNA1+ expRNA2*βRNA2+expRNA3*βRNA3+…expRNAn*βRNAn, where expRNA was the mRNA expression level and βRNA referred to the regression coefficient derived from the multivariate Cox hazards regression analysis. Based on the risk score for each patient, patients from the TCGA database were separated into 2 groups: a low-risk group and a high-risk group. Kaplan-Meier survival analysis was performed to assess differences in overall survival and disease-free time of patients using a log-rank test in GraphPad Prism 7.0. In addition, the receiver operating characteristic (ROC) curve was utilized to evaluate the specificity and sensitivity of the survival and disease-free prediction by the area under the curve using the R package “survivalROC” [16]. Heatmaps and clustering were generated based on the ClustVis open web tool [17].
Predictive value assessment
To evaluate the clinical value of our risk scoring system, we analyzed the clinical characteristics and risk scores in univariate Cox regression. We included factors with P<0.05 into the multivariate Cox regression analysis model. Then, a P<0.05 was treated as an independent prognostic factor. Moreover, to assess the relationship between risk level and clinical characteristics, we regrouped the patients based on age, sex, grade, stage, T stage, M stage, N stage, vital status, and risk level. A P<0.05 was considered as statistically significant using the chi-square test.
Results
Differentially expressed genes related to the metastasis of ccRCC
In this study, we defined M0 and N0 patients as the non-metastasis group (198 cases), while M1 and/or N1 patients (89 cases) were defined as the metastasis group. Altogether, 263 genes were found to be dysregulated according to the cutoff criteria, among which, 101 genes were upregulated and 162 gene were downregulated (Figure 1, Supplementary Table 1). Functional enrichment analysis of gene ontology revealed that dysregulated genes were mainly enriched in sequence-specific DNA binding, receptor binding, the extracellular region, the integral component of the plasma membrane, ion transmembrane transport, and insulin receptor signaling pathway. KEGG pathway analysis indicated that genes were primarily enriched in neuroactive ligand-receptor interaction and synaptic vesicle cycle (Figure 2). Moreover, the PPI network consisted of 10 modules, which included 255 nodes and 316 edges. The most significant module is shown in Figure 3.
Figure 1.
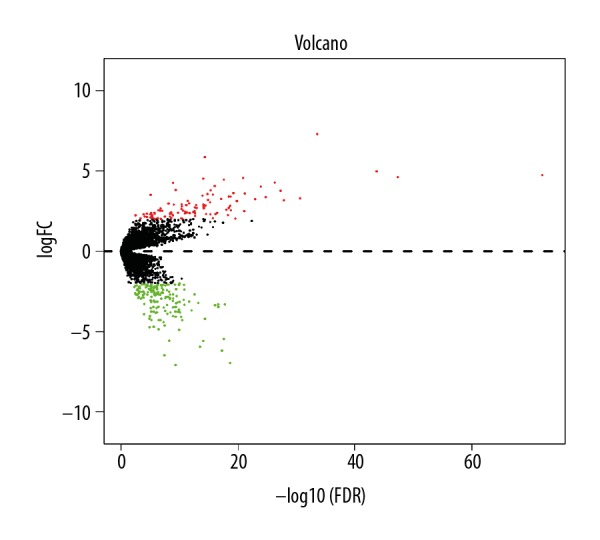
The volcano plot for DEGs related to metastasis. The x-axis is -log10(FDR) and the y-axis is logFC. The red dots represent upregulated genes and green dots represent downregulated genes.
Figure 2.

Go term and KEGG pathway analysis for DEGs. (A) Top 10 molecular function (MF) processes. (B) Cellular component (CC). (C) Top 10 biological processes (BP). (D) KEGG pathway analysis.
Figure 3.
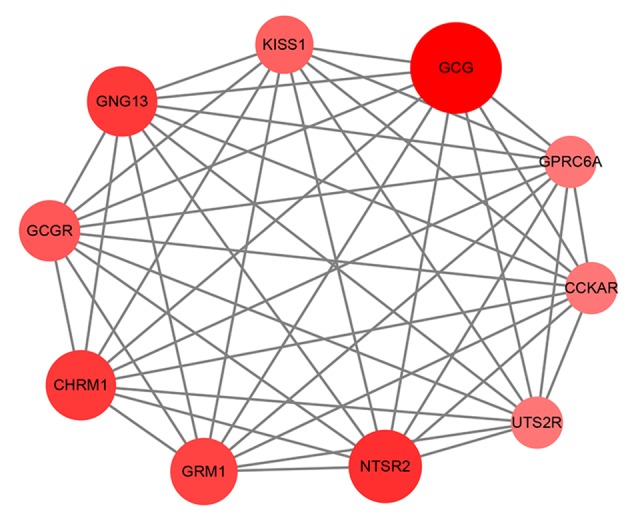
The most significant module. The color and the size of a node indicates the number of proteins interacting with the designated protein.
Survival-related genes by Cox regression analysis
To identify key genes that may affect overall survival of patients, we performed Cox proportional hazard regressions analysis on upregulated genes. Twenty key genes were demonstrated to influence overall survival: OTX1, FOXE1, FAM83A, HMGA2, KRT6A, DPYSL5, ANXA8, MATN4, ROS1, CSMD3, MAGEC3, AMER2, CPLX2, PI3, KRT13, ERVV-2, ANKFN1, VTN, NFE4, and ZNF114 (Figure 4).
Figure 4.

(A–T) Survival-related upregulated genes. Kaplan-Meier survival curves were generated for genes with P<0.05 in multivariate Cox regression analysis.
Construction of a risk scoring system based on candidate genes
For the purpose of extracting a signature that possesses the best predictive efficacy, 20 key genes were subjected to the stepwise multivariate Cox regression model. Results from the model revealed a total of 5 genes that proved to be significant survival predictors. The related information of these 5 genes is shown in Table 1. Subsequently, the risk score for each patient was computed as follows: expOTX1*0.725+expMATN4*0.473+expPI3*0.548+expERVV-2*0.458+expNFE4*0.410. According to the median risk score, we assigned these scores to the low- or high-risk group. Overall survival analysis showed that the low-risk group had better prognoses compared with the high-risk group (Figure 5A). The prognostic ability of the 5-gene signature was assessed by the AUC value of the ROC curve. The AUC was 0.687 for 3-year and 0.695 for 5-year overall survival, indicating a good performance of the 5-gene signature (Figure 5C, 5E). Risk scores in the low-risk group ranged from 0 to 0.215232506445 and ranged from 0.215490360701 to 360.615372760823 in the high-risk group (Figure 5G). Disease-free survival analysis revealed a significant difference between the 2 groups, with the low-risk group having a longer disease-free time (Figure 5B). In the ROC curve, the AUC for 3-year disease-free survival was 0.674 and 0.681 for 5-year disease-free survival (Figure 5D, 5F). Risk scores in the low-risk group ranged from 0 to 0.187870897657 and from 0.194574172497 to 360.615372760823 in the high-risk group (Figure 5H). Figure 6 shows the expression patterns of all the 5 genes in the 2 groups. The expression of OTX1, MATN4, and PI3 were significantly higher in the high-risk group in the 2 cohorts (Figure 7).
Table 1.
Overall information of 5 genes constructing the prognostic signature.
| Gene | Gene name | Gene type | Hazard ratio | Coefficient | P value |
|---|---|---|---|---|---|
| OTX1 | Orthodenticle Homeobox 1 | Protein-coding | 2.064 | 0.725 | <0.0001 |
| MATN4 | Matrilin 4 | Protein-coding | 1.605 | 0.473 | 0.007 |
| PI3 | Peptidase Inhibitor 3 | Protein-coding | 1.73 | 0.548 | 0.002 |
| ERVV-2 | Endogenous Retrovirus Group V Member 2 | Protein-coding | 1.581 | 0.458 | 0.009 |
| NFE4 | Nuclear Factor, Erythroid 4 | Protein-coding | 1.506 | 0.41 | 0.015 |
Figure 5.

The 5-gene predictive signature in ccRCC. (A) Kaplan-Meier curve of OS in the low- and high-risk groups. (B) Kaplan-Meier curve of DFS in the low- and high-risk groups. (C) ROC curve for the 3-year survival prediction by the 5-gene signature. (D) ROC curve for the 3-year disease-free survival prediction by the 5-gene signature. (E) ROC curve for the 5-year survival prediction. (F) ROC curve for the 5-year disease-free survival prediction. (G) Risk scores distribution among OS cohort. (H) Risk scores distribution among DFS cohort.
Figure 6.

Expression pattern of the 5-gene signature in OS and DFS cohort. (A–C). In the OS cohort, the expression levels of OTX1, MATN4, and PI3 were significantly higher in the high-risk group. (D–F). In the DFS cohort, the expression levels of OTX1, MATN4, and PI3 were significantly higher in the high-risk group.
Figure 7.

Heatmap of the 5 genes. (A) Heatmap of the OS cohort. (B) Heatmap of the DFS cohort. Red indicates the high-risk group, while blue indicates the low-risk group.
Assessment of gene signature prognostic value
Univariate Cox regression analysis of the prognostic power of our risk scoring system showed that age, grade, stage, T stage, N stage, M stage, and risk level were all indicators of poor outcome. Then, these 7 indexes were entered into the multivariate Cox regression model, showing that risk level could be treated as an independent prognostic factor (Table 2). Furthermore, as is shown in Table 3, based on the chi-square test, risk level was significantly correlated with sex, grade, tumor stage, T stage, N stage, M stage, and vital status. Collectively, our results demonstrate that our 5-gene signature is a robust tool for use in predicting prognosis and recurrence.
Table 2.
Univariate and multivariate analysis of risk level and patient survival.
| Variables | Univariate analysis | Multivariate analysis | ||||
|---|---|---|---|---|---|---|
|
| ||||||
| HR* | 95% CI | P value | HR | 95% CI | P value | |
| Overall survival | ||||||
|
| ||||||
| Age (years) | ||||||
| ≤60 (257) | 1.683 | 1.228–2.306 | 0.001 | 1.540 | 1.122–2.114 | 0.007 |
| >60 (246) | ||||||
|
| ||||||
| Sex | ||||||
| Male (325) | 0.791 | |||||
| Female (178) | ||||||
|
| ||||||
| Stage | ||||||
| I+II (303) | 4.313 | 3.092–6.015 | <0.0001 | 2.511 | 1.256–5.019 | 0.009 |
| III+IV (200) | ||||||
|
| ||||||
| T stage | ||||||
| T1–T2 (321) | 3.482 | 2.534–4.785 | <0.0001 | 0.681 | ||
| T3–T4 (182) | ||||||
|
| ||||||
| N stage | ||||||
| N0 (487) | 3.925 | 2.124–7.255 | <0.0001 | 0.093 | ||
| N1 (16) | ||||||
|
| ||||||
| M stage | ||||||
| M0 (425) | 4.572 | 3.21–6.294 | <0.0001 | 2.202 | 1.500–3.232 | 0.0001 |
| M1 (78) | ||||||
|
| ||||||
| Grade | ||||||
| G1–G2 (232) | 2.644 | 1.860–3.759 | <0.0001 | 0.051 | ||
| G3–G4 (271) | ||||||
|
| ||||||
| Risk level | ||||||
| Low risk (251) | 2.592 | 1.859–3.612 | <0.0001 | 1.779 | 1.251–2.530 | 0.001 |
| High risk (252) | ||||||
HR estimated from Cox proportional hazard regression model; multivariate models were adjusted for age, grade, T, N, M, and stage.
HR – hazard ratio; CI – confidence interval.
Table 3.
Relationship between clinical parameters and risk level.
| Subgroup | High risk | Low risk | Total | P value* |
|---|---|---|---|---|
| Age | 0.503 | |||
| ≤60 | 125 (24.85%) | 132 (26.24%) | 257 | |
| >60 | 127 (25.25%) | 119 (23.66%) | 246 | |
| Sex | 0.008 | |||
| Male | 180 (35.79%) | 151 (30.01%) | 331 | |
| Female | 72 (14.31%) | 100 (19.88%) | 172 | |
| Grade | <0.0001 | |||
| G1–G2 | 86 (17.10%) | 146 (29.03%) | 232 | |
| G3–G4 | 166 (33.00%) | 105 (20.87%) | 271 | |
| Stage | <0.0001 | |||
| I+II | 119 (23.66%) | 184 (36.58%) | 303 | |
| III+IV | 133 (26.44%) | 67 (13.32%) | 200 | |
| T stage | <0.0001 | |||
| T1–T2 | 132 (26.24%) | 189 (37.57%) | 321 | |
| T3–T4 | 120 (23.86%) | 62 (12.33%) | 182 | |
| N stage | <0.0001 | |||
| N0 | 111 (45.87%) | 114 (47.11%) | 225 | |
| N1 | 16 (6.61%) | 1 (0.41%) | 17 | |
| M stage | <0.0001 | |||
| M0 | 178 (37.47%) | 219 (46.11%) | 397 | |
| M1 | 57 (12.00%) | 21 (4.42%) | 78 | |
| Vital status | <0.0001 | |||
| Alive | 141 (28.03%) | 200 (39.76%) | 341 | |
| Dead | 111 (22.07%) | 51 (10.14%) | 162 |
Chi-square test was used.
Discussion
CcRCC has been shown to display distinct variability in clinical outcome, possibly due to the intrinsic molecular heterogeneity, which remains unclear, especially with regard to the mechanism of distant metastasis [18]. Moreover, the clinically available parameters, such as TNM stage and Fuhrman grade, are indispensable for prognostic prediction [19]. Nevertheless, there remains an urgent need to detect prognostic biomarkers due to the high heterogeneity in ccRCC.
In the current study, we performed bioinformatic analysis between the non-metastasis and metastasis ccRCC group to identify genes involved in metastasis. As a result, we found that 263 genes were dysregulated; functional enrichment analysis of these genes revealed that dysregulated genes were primarily enriched in sequence-specific DNA binding, receptor binding, extracellular region, integral component of plasma membrane, ion transmembrane transport, insulin receptor signaling pathway, neuroactive ligand-receptor interaction, and synaptic vesicle cycle. Most importantly, we identified a 5-gene panel signature (OTX1, MATN4, PI3, ERVV-2, and NFE4) after the Cox proportional hazards regression analysis. Then, a risk score was acquired by combing the 5 genes. Recently, Wei et al. also identified key genes involved in the metastasis of ccRCC using similar bioinformatics methods [20]. However, in our study, we make our inclusion criteria clear with regard to the metastasis and non-metastasis groups. Moreover, we calculated each patient’s risk score based on the 5-gene signature. The 5-gene signature could independently predict overall survival for ccRCC patients, demonstrating that this signature might be useful in clinical practice.
OTX1 encodes a member of the Bicoid sub-family of homeodomain-containing transcription factor, which may play a role in sensory and brain organ development. It has been described as a vital molecule for axon refinement [21]. Terrinoni et al. demonstrated that the p53 protein can directly induce OTX1 expression by acting on its promoter in breast cancer, and Figueira-Muoio et al. revealed that the OTX pathway is important in medulloblastomas development [22,23]. OTX1 was also found to promote colorectal cancer progression in vitro through epithelial-mesenchymal transition and hepatocellular carcinoma progression by regulation of the ERK/MAPK pathway [24,25]. In bladder cancer, OTX1 combined with FGFR3 and TERT can function as a surveillance biomarker [26]. However, the role of OTX1 in ccRCC is still unknown. PI3, also called elafin, encodes an elastase-specific inhibitor that functions as an antimicrobial peptide [27,28]. Caruso et al. demonstrated that elafin predicts poor outcome in ovarian and breast cancer patients, and it may play a role in tumor dormancy; moreover, it has been shown that elafin is an important therapeutic target for breast and ovarian carcinoma [29–31]. MATN4, a member of the von Willebrand factor A domain-containing protein family, has not been widely studied in cancer to date [32]. A study showed that under acute stress, CXCR4 and MATN4 are involved in the regulation of hematopoietic stem cells proliferation and expansion [33]. ERVV-2 is functionally important in reproduction, and NFE4 is involved in preferential expression of the gamma-globin genes in fetal erythroid cells [34,35]. These 2 genes have not been well defined in cancer biology, particularly in ccRCC.
In summary, our study used an integrated analysis to identify differentially expressed genes that participate in metastasis of ccRCC. Furthermore, we constructed a 5-gene signature with a quantitative index that exhibited an independent prognostic value. In the future, this 5-gene signature may be used to identify patients who need regional lymph node dissection during radical nephrectomy [36]. Since these 5 genes are correlated with poor outcome, they might be therapeutic targets for ccRCC. However, in vivo and in vitro studies are still needed to reveal the biological functions of these predictive mRNAs in ccRCC.
Conclusions
We identified differentially expressed genes that may participate in the metastasis of ccRCC. More importantly, we established a predictive signature based on the expression of OTX1, MATN4, PI3, ERVV-2, and NFE4, which could serve as significant progressive and prognostic biomarkers for ccRCC.
Supplementary Table 1
Supplementary Table 1.
Differentially expressed genes involved in metastasis in ccRCC.
| Genes | Log FC | Genes | Log FC | Genes | Log FC |
|---|---|---|---|---|---|
| PRSS38 | 7.293012973 | PASD1 | 5.849055467 | BAAT | 4.972016934 |
| KCNE5 | 4.734843904 | NFE4 | 4.607079054 | ALPG | 4.569998517 |
| FDCSP | 4.526032273 | CABP2 | 4.453865694 | OLFM4 | 4.268762733 |
| GAGE1 | 4.26812475 | LHX3 | 4.065474738 | KRT13 | 4.019547465 |
| CRABP1 | 3.807319872 | SOHLH1 | 3.801178392 | CACNG6 | 3.763439672 |
| VSTM2B | 3.632937049 | ANXA8 | 3.591407826 | H2BFM | 3.555425223 |
| AMER3 | 3.524447368 | MAGEC2 | 3.503241713 | ERVV–2 | 3.464200342 |
| CPLX2 | 3.401097143 | GABRA3 | 3.388167297 | RORB | 3.361591792 |
| MUC16 | 3.298663286 | MARCOL | 3.250302515 | ZDHHC22 | 3.239809076 |
| IGFL3 | 3.196619228 | MTRNR2L6 | 3.179688152 | C1orf94 | 3.13666645 |
| PI3 | 3.126993299 | CSMD3 | 3.047313412 | ISL1 | 2.981373363 |
| SP8 | 2.966745906 | PNLIP | 2.924034656 | AMER2 | 2.904669856 |
| TLX3 | 2.903886912 | PDX1 | 2.882186281 | DPYSL5 | 2.869458768 |
| LCN15 | 2.843884331 | VTN | 2.819241353 | ZPLD1 | 2.795929776 |
| ISX | 2.795438433 | EPPIN | 2.734479911 | ALPP | 2.699771711 |
| PTPRZ1 | 2.695461275 | INSL4 | 2.691308392 | CHAT | 2.659157612 |
| MAGEC3 | 2.626652586 | DAB1 | 2.581804555 | RDH8 | 2.559245587 |
| XKR7 | 2.556307418 | CIDEC | 2.535297601 | ROS1 | 2.520534946 |
| CSN3 | 2.519649538 | VSTM2L | 2.490355446 | HTR1D | 2.489417462 |
| FAM83A | 2.455106896 | S100A7 | 2.43745305 | HMGA2 | 2.423695315 |
| ANKFN1 | 2.408489181 | UBE2U | 2.401187787 | TRPV5 | 2.378341308 |
| LCE1C | 2.377491995 | DRGX | 2.375422577 | SLC18A3 | 2.366620248 |
| KLF17 | 2.362440353 | ZIC2 | 2.35428125 | SPACA3 | 2.348805744 |
| FCRL4 | 2.346660183 | CRP | 2.332869284 | SPANXB1 | 2.326683931 |
| UTS2R | 2.314650465 | MATN4 | 2.311903817 | ZNF114 | 2.30971043 |
| ADIPOQ | 2.296860368 | KISS1 | 2.295428739 | LIN28B | 2.291059085 |
| ANXA8L1 | 2.248521884 | MAGEB1 | 2.242953797 | SPANXN3 | 2.242130571 |
| IL22RA2 | 2.240150546 | C1QL2 | 2.209979502 | AGBL1 | 2.206686442 |
| TLX2 | 2.202836841 | RLBP1 | 2.159036842 | NPPB | 2.154907807 |
| HTR5A | 2.149124359 | SERPINB3 | 2.14782693 | SBSN | 2.1417701 |
| SPINK6 | 2.114686901 | FOXE1 | 2.096651213 | GNG13 | 2.082021332 |
| ALOXE3 | 2.054881574 | RTP3 | 2.051444937 | OTX1 | 2.040341385 |
| HMX2 | 2.030173909 | KIRREL3 | 2.025763852 | DMRTA2 | 2.018437908 |
| KRT6A | 2.006147507 | IRS4 | −7.069279584 | AQP6 | −6.952633679 |
| LY6L | −6.466292518 | HHATL | −6.178662879 | CRISP3 | −5.942489086 |
| PAGE5 | −5.566923649 | HBG1 | −5.565412617 | SFTPB | −5.46165805 |
| MDFIC2 | −4.7346839 | MAGEA11 | −4.702227866 | CCKAR | −4.620218512 |
| NTSR2 | −4.412067953 | LRRTM1 | −4.295989741 | CLDN8 | −4.291159779 |
| PAGE2B | −4.290100156 | DCAF4L2 | −4.285297367 | CHRM1 | −4.203135741 |
| FEZF2 | −4.181641013 | SERTM2 | −4.084855062 | PSG4 | −4.069117346 |
| DEFB125 | −4.034642804 | ATP6V0A4 | −4.03380667 | ATP6V1G3 | −3.918376267 |
| FXYD4 | −3.882031698 | C10orf71 | −3.845620551 | ST8SIA3 | −3.817050292 |
| TTR | −3.8141048 | PAGE4 | −3.813169574 | FGF9 | −3.781764959 |
| POU3F4 | −3.771004791 | ATP6V0D2 | −3.753224136 | PSG9 | −3.751868431 |
| SPOCK3 | −3.749385525 | TMEM213 | −3.705206888 | KBTBD12 | −3.684155012 |
| KRTAP5–8 | −3.632121999 | PIP | −3.541015006 | TMEM215 | −3.537175656 |
| RHBG | −3.513276723 | CTNNA2 | −3.497574449 | GJD2 | −3.465274322 |
| GLB1L3 | −3.462356811 | SLC4A1 | −3.459997603 | NUPR2 | −3.451627461 |
| HBG2 | −3.360260797 | NR5A1 | −3.354792948 | VWA5B1 | −3.340662569 |
| MLANA | −3.311141752 | OMG | −3.302149224 | BSND | −3.275017729 |
| AQP10 | −3.234439151 | FER1L6 | −3.223091448 | SLC26A7 | −3.196657291 |
| KLK1 | −3.168181356 | ATP6V1B1 | −3.166112958 | RHCG | −3.157008772 |
| FGL1 | −3.146889407 | TNNT3 | −3.130099704 | SLC24A2 | −3.090435759 |
| PLK5 | −3.073715835 | PSG5 | −3.063389834 | TYR | −3.036736515 |
| CD177 | −2.967875945 | CDH7 | −2.947214145 | XAGE5 | −2.941242246 |
| AQP5 | −2.928574991 | LGI1 | −2.920563422 | SCRT1 | −2.915273241 |
| LCN1 | −2.897125323 | CRISP2 | −2.891236689 | CGA | −2.880719932 |
| FOXI1 | −2.856870004 | SLC4A9 | −2.85058536 | GREM2 | −2.846325204 |
| ADAM7 | −2.823853478 | MYMX | −2.780243665 | FOXI2 | −2.747040565 |
| BPIFA2 | −2.744920257 | NXPH2 | −2.73264296 | FAM24B | −2.005641145 |
| CLCNKB | −2.711841094 | DNTT | −2.703518233 | FRG2C | −2.696015544 |
| TMEM61 | −2.688842068 | CASP14 | −2.687885646 | GIMD1 | −2.686569536 |
| LHFPL4 | −2.682599598 | ADCYAP1 | −2.68255206 | TBATA | −2.65671051 |
| DMRT2 | −2.645831657 | MCCD1 | −2.625093054 | PAGE2 | −2.615268476 |
| GPRC6A | −2.613101443 | WFIKKN2 | −2.598374715 | UGT2B4 | −2.586510771 |
| IGF2 | −2.56153826 | KERA | −2.560942199 | FRG2B | −2.549870167 |
| SLC7A13 | −2.544471449 | MOG | −2.537312543 | ASCL4 | −2.534282307 |
| C11orf53 | −2.519948822 | PSCA | −2.507368106 | GCGR | −2.506059534 |
| PLA2G4F | −2.494234559 | DAZ1 | −2.461947613 | NKX6–1 | −2.457759032 |
| RHAG | −2.444447278 | LUZP2 | −2.426420149 | HBM | −2.424034763 |
| NMRK2 | −2.412559163 | TRIM50 | −2.4050669 | LRRC52 | −2.396507205 |
| GRIK1 | −2.380726671 | CRYAA | −2.361368316 | ADRB1 | −2.352091261 |
| AHSP | −2.350914787 | ASB5 | −2.345814708 | CNMD | −2.339953179 |
| GGTLC3 | −2.332560999 | GCG | −2.325940672 | PSG8 | −2.303814006 |
| STAP1 | −2.295027287 | RGS8 | −2.290434876 | STAC2 | −2.269340054 |
| CYP1A1 | −2.246907308 | KRTAP5–3 | −2.240169508 | HBD | −2.234219697 |
| RBBP8NL | −2.232288152 | UGT2B28 | −2.229968426 | ATP13A5 | −2.22816884 |
| SMOC1 | −2.226575753 | DEFA4 | −2.194637278 | FRMD7 | −2.190289838 |
| CA1 | −2.182904697 | CLNK | −2.179307919 | SRARP | −2.162262658 |
| ERP27 | −2.157025947 | KLK4 | −2.152704502 | FAM133A | −2.145658322 |
| PNMT | −2.136928193 | CEACAM7 | −2.131707182 | NRK | −2.11265576 |
| SMIM5 | −2.105569769 | DEFA3 | −2.104237638 | TDGF1 | −2.101766107 |
| ADGRF1 | −2.098885814 | GRM1 | −2.096205239 | HEMGN | −2.091490619 |
| UGT1A4 | −2.087390147 | AL445989.1 | −2.918112259 | PRG4 | −2.083544157 |
| ABCB5 | −2.082109144 | PGPEP1L | −2.077264255 | PCP4 | −2.063618468 |
| HAO1 | −2.062354203 | HSPB3 | −2.051568162 | MYH8 | −2.04723169 |
| THBS4 | −2.085595685 | AL035425.2 | −4.867341747 | C20orf141 | 2.010402307 |
| TMPRSS11E | −4.867341747 | HEPACAM2 | −2.731391743 |
Footnotes
Source of support: This study was supported by a grant from the National Natural Science Foundation of China (grant no. 81671216, 81371379)
Conflicts of interest
None.
References
- 1.Siegel RL, Miller KD, Jemal A. Cancer Statistics, 2017. Cancer J Clin. 2017;67(1):7–30. doi: 10.3322/caac.21387. [DOI] [PubMed] [Google Scholar]
- 2.Ljungberg B, Albiges L, Abu-Ghanem Y, et al. European Association of Urology guidelines on renal cell carcinoma: The 2019 update. Eur Urol. 2019;75(5):799–810. doi: 10.1016/j.eururo.2019.02.011. [DOI] [PubMed] [Google Scholar]
- 3.O’Sullivan B, Brierley J, Byrd D, et al. The TNM classification of malignant tumours-towards common understanding and reasonable expectations. Lancet Oncol. 2017;18(7):849–51. doi: 10.1016/S1470-2045(17)30438-2. [DOI] [PMC free article] [PubMed] [Google Scholar]
- 4.Wu AJ, Gillis A, Foster A, et al. Patterns of failure in limited-stage small cell lung cancer: Implications of TNM stage for prophylactic cranial irradiation. Radiother Oncol. 2017;125(1):130–35. doi: 10.1016/j.radonc.2017.07.019. [DOI] [PMC free article] [PubMed] [Google Scholar]
- 5.Bertero L, Massa F, Metovic J, et al. Eighth Edition of the UICC Classification of Malignant Tumours: An overview of the changes in the pathological TNM classification criteria – what has changed and why? Virchows Archiv. 2018;472(4):519–31. doi: 10.1007/s00428-017-2276-y. [DOI] [PubMed] [Google Scholar]
- 6.Park JS, Lee HJ, Cho NH, et al. Risk prediction tool for aggressive tumors in clinical T1 stage clear cell renal cell carcinoma using molecular biomarkers. Comput Struct Biotechnol J. 2019;17:371–77. doi: 10.1016/j.csbj.2019.03.005. [DOI] [PMC free article] [PubMed] [Google Scholar]
- 7.Uchida K, Miyao N, Masumori N, et al. Recurrence of renal cell carcinoma more than 5 years after nephrectomy. Int J Urol. 2002;9(1):19–23. doi: 10.1046/j.1442-2042.2002.00418.x. [DOI] [PubMed] [Google Scholar]
- 8.Williamson TJ, Pearson JR, Ischia J, et al. Guideline of guidelines: Follow-up after nephrectomy for renal cell carcinoma. BJU Int. 2016;117(4):555–62. doi: 10.1111/bju.13384. [DOI] [PubMed] [Google Scholar]
- 9.Zhou Y, Zang Y, Yang Y, et al. Candidate genes involved in metastasis of colon cancer identified by integrated analysis. Cancer Med. 2019;8(5):2338–47. doi: 10.1002/cam4.2071. [DOI] [PMC free article] [PubMed] [Google Scholar]
- 10.Zuo S, Dai G, Ren X. Identification of a 6-gene signature predicting prognosis for colorectal cancer. Cancer Cell Int. 2019;19:6. doi: 10.1186/s12935-018-0724-7. [DOI] [PMC free article] [PubMed] [Google Scholar]
- 11.Sun G, Li Y, Peng Y, et al. Identification of a five-gene signature with prognostic value in colorectal cancer. J Cell Physiol. 2019;234(4):3829–36. doi: 10.1002/jcp.27154. [DOI] [PubMed] [Google Scholar]
- 12.Robinson MD, McCarthy DJ, Smyth GK. edgeR: A bioconductor package for differential expression analysis of digital gene expression data. Bioinformatics. 2010;26(1):139–40. doi: 10.1093/bioinformatics/btp616. [DOI] [PMC free article] [PubMed] [Google Scholar]
- 13.Huang DW, Sherman BT, Tan Q, et al. The DAVID Gene Functional Classification Tool: A novel biological module-centric algorithm to functionally analyze large gene lists. Genome Biol. 2007;8(9):R183. doi: 10.1186/gb-2007-8-9-r183. [DOI] [PMC free article] [PubMed] [Google Scholar]
- 14.Szklarczyk D, Morris JH, Cook H, et al. The STRING database in 2017: Quality-controlled protein-protein association networks, made broadly accessible. Nucleic Acids Res. 2017;45(D1):D362–68. doi: 10.1093/nar/gkw937. [DOI] [PMC free article] [PubMed] [Google Scholar]
- 15.Shannon P, Markiel A, Ozier O, et al. Cytoscape: A software environment for integrated models of biomolecular interaction networks. Genome Res. 2003;13(11):2498–504. doi: 10.1101/gr.1239303. [DOI] [PMC free article] [PubMed] [Google Scholar]
- 16.Heagerty PJ, Lumley T, Pepe MS. Time-dependent ROC curves for censored survival data and a diagnostic marker. Biometrics. 2000;56(2):337–44. doi: 10.1111/j.0006-341x.2000.00337.x. [DOI] [PubMed] [Google Scholar]
- 17.Metsalu T, Vilo J. ClustVis: A web tool for visualizing clustering of multivariate data using Principal Component Analysis and heatmap. Nucleic Acids Res. 2015;43(W1):W566–70. doi: 10.1093/nar/gkv468. [DOI] [PMC free article] [PubMed] [Google Scholar]
- 18.Hakimi AA, Ostrovnaya I, Reva B, et al. Adverse outcomes in clear cell renal cell carcinoma with mutations of 3p21 epigenetic regulators BAP1 and SETD2: a report by MSKCC and the KIRC TCGA research network. Clin Cancer Res. 2013;19(12):3259–67. doi: 10.1158/1078-0432.CCR-12-3886. [DOI] [PMC free article] [PubMed] [Google Scholar]
- 19.Patard JJ, Leray E, Rioux-Leclercq N, et al. Prognostic value of histologic subtypes in renal cell carcinoma: A multicenter experience. J Clin Oncol. 2005;23(12):2763–71. doi: 10.1200/JCO.2005.07.055. [DOI] [PubMed] [Google Scholar]
- 20.Wei W, Lv Y, Gan Z, et al. Identification of key genes involved in the metastasis of clear cell renal cell carcinoma. Oncol Lett. 2019;17(5):4321–28. doi: 10.3892/ol.2019.10130. [DOI] [PMC free article] [PubMed] [Google Scholar]
- 21.Larsen KB, Lutterodt MC, Mollgard K, Moller M. Expression of the homeobox genes OTX2 and OTX1 in the early developing human brain. J Histochem Cytochem. 2010;58(7):669–78. doi: 10.1369/jhc.2010.955757. [DOI] [PMC free article] [PubMed] [Google Scholar]
- 22.Terrinoni A, Pagani IS, Zucchi I, et al. OTX1 expression in breast cancer is regulated by p53. Oncogene. 2011;30(27):3096–103. doi: 10.1038/onc.2011.31. [DOI] [PubMed] [Google Scholar]
- 23.Figueira Muoio VM, Uno M, Oba-Shinjo S, et al. OTX1 and OTX2 genes in medulloblastomas. World Neurosurg. 2019 doi: 10.1016/j.wneu.2019.02.013. [Epub ahead of print] [DOI] [PubMed] [Google Scholar]
- 24.Li H, Miao Q, Xu CW, et al. OTX1 contributes to hepatocellular carcinoma progression by regulation of ERK/MAPK pathway. J Korean Med Sci. 2016;31(8):1215–23. doi: 10.3346/jkms.2016.31.8.1215. [DOI] [PMC free article] [PubMed] [Google Scholar]
- 25.Yu K, Cai XY, Li Q, et al. OTX1 promotes colorectal cancer progression through epithelial-mesenchymal transition. Biochem Biophys Res Commun. 2014;444(1):1–5. doi: 10.1016/j.bbrc.2013.12.125. [DOI] [PubMed] [Google Scholar]
- 26.Beukers W, van der Keur KA, Kandimalla R, et al. FGFR3, TERT and OTX1 as a urinary biomarker combination for surveillance of patients with bladder cancer in a large prospective multicenter study. J Urol. 2017;197(6):1410–18. doi: 10.1016/j.juro.2016.12.096. [DOI] [PubMed] [Google Scholar]
- 27.Zhang W, Teng G, Wu T, et al. Expression and clinical significance of elafin in inflammatory bowel disease. Inflamm Bowel Dis. 2017;23(12):2134–41. doi: 10.1097/MIB.0000000000001252. [DOI] [PubMed] [Google Scholar]
- 28.Caruso JA, Akli S, Pageon L, et al. The serine protease inhibitor elafin maintains normal growth control by opposing the mitogenic effects of neutrophil elastase. Oncogene. 2015;34(27):3556–67. doi: 10.1038/onc.2014.284. [DOI] [PMC free article] [PubMed] [Google Scholar]
- 29.Caruso JA, Karakas C, Zhang J, et al. Elafin is downregulated during breast and ovarian tumorigenesis but its residual expression predicts recurrence. Breast Cancer Res. 2014;16(6):3417. doi: 10.1186/s13058-014-0497-4. [DOI] [PMC free article] [PubMed] [Google Scholar]
- 30.Hunt KK, Wingate H, Yokota T, et al. Elafin, an inhibitor of elastase, is a prognostic indicator in breast cancer. Breast Cancer Res. 2013;15(1):R3. doi: 10.1186/bcr3374. [DOI] [PMC free article] [PubMed] [Google Scholar]
- 31.Clauss A, Ng V, Liu J, et al. Overexpression of elafin in ovarian carcinoma is driven by genomic gains and activation of the nuclear factor kappaB pathway and is associated with poor overall survival. Neoplasia. 2010;12(2):161–72. doi: 10.1593/neo.91542. [DOI] [PMC free article] [PubMed] [Google Scholar]
- 32.Klatt AR, Nitsche DP, Kobbe B, et al. Molecular structure, processing, and tissue distribution of matrilin-4. J Biol Chem. 2001;276(20):17267–75. doi: 10.1074/jbc.M100587200. [DOI] [PubMed] [Google Scholar]
- 33.Uckelmann H, Blaszkiewicz S, Nicolae C, et al. Extracellular matrix protein Matrilin-4 regulates stress-induced HSC proliferation via CXCR4. J Exp Med. 2016;213(10):1961–71. doi: 10.1084/jem.20151713. [DOI] [PMC free article] [PubMed] [Google Scholar]
- 34.Vargas A, Thiery M, Lafond J, Barbeau B. Transcriptional and functional studies of Human Endogenous Retrovirus envelope EnvP(b) and EnvV genes in human trophoblasts. Virology. 2012;425(1):1–10. doi: 10.1016/j.virol.2011.12.015. [DOI] [PubMed] [Google Scholar]
- 35.Zhao Q, Zhou W, Rank G, et al. Repression of human gamma-globin gene expression by a short isoform of the NF-E4 protein is associated with loss of NF-E2 and RNA polymerase II recruitment to the promoter. Blood. 2006;107(5):2138–45. doi: 10.1182/blood-2005-06-2497. [DOI] [PMC free article] [PubMed] [Google Scholar]
- 36.Gershman B, Thompson RH, Boorjian SA, et al. Radical nephrectomy with or without lymph node dissection for high risk nonmetastatic renal cell carcinoma: A multi-institutional analysis. J Urol. 2018;199(5):1143–48. doi: 10.1016/j.juro.2017.11.114. [DOI] [PubMed] [Google Scholar]
Associated Data
This section collects any data citations, data availability statements, or supplementary materials included in this article.
Supplementary Materials
Supplementary Table 1.
Differentially expressed genes involved in metastasis in ccRCC.
| Genes | Log FC | Genes | Log FC | Genes | Log FC |
|---|---|---|---|---|---|
| PRSS38 | 7.293012973 | PASD1 | 5.849055467 | BAAT | 4.972016934 |
| KCNE5 | 4.734843904 | NFE4 | 4.607079054 | ALPG | 4.569998517 |
| FDCSP | 4.526032273 | CABP2 | 4.453865694 | OLFM4 | 4.268762733 |
| GAGE1 | 4.26812475 | LHX3 | 4.065474738 | KRT13 | 4.019547465 |
| CRABP1 | 3.807319872 | SOHLH1 | 3.801178392 | CACNG6 | 3.763439672 |
| VSTM2B | 3.632937049 | ANXA8 | 3.591407826 | H2BFM | 3.555425223 |
| AMER3 | 3.524447368 | MAGEC2 | 3.503241713 | ERVV–2 | 3.464200342 |
| CPLX2 | 3.401097143 | GABRA3 | 3.388167297 | RORB | 3.361591792 |
| MUC16 | 3.298663286 | MARCOL | 3.250302515 | ZDHHC22 | 3.239809076 |
| IGFL3 | 3.196619228 | MTRNR2L6 | 3.179688152 | C1orf94 | 3.13666645 |
| PI3 | 3.126993299 | CSMD3 | 3.047313412 | ISL1 | 2.981373363 |
| SP8 | 2.966745906 | PNLIP | 2.924034656 | AMER2 | 2.904669856 |
| TLX3 | 2.903886912 | PDX1 | 2.882186281 | DPYSL5 | 2.869458768 |
| LCN15 | 2.843884331 | VTN | 2.819241353 | ZPLD1 | 2.795929776 |
| ISX | 2.795438433 | EPPIN | 2.734479911 | ALPP | 2.699771711 |
| PTPRZ1 | 2.695461275 | INSL4 | 2.691308392 | CHAT | 2.659157612 |
| MAGEC3 | 2.626652586 | DAB1 | 2.581804555 | RDH8 | 2.559245587 |
| XKR7 | 2.556307418 | CIDEC | 2.535297601 | ROS1 | 2.520534946 |
| CSN3 | 2.519649538 | VSTM2L | 2.490355446 | HTR1D | 2.489417462 |
| FAM83A | 2.455106896 | S100A7 | 2.43745305 | HMGA2 | 2.423695315 |
| ANKFN1 | 2.408489181 | UBE2U | 2.401187787 | TRPV5 | 2.378341308 |
| LCE1C | 2.377491995 | DRGX | 2.375422577 | SLC18A3 | 2.366620248 |
| KLF17 | 2.362440353 | ZIC2 | 2.35428125 | SPACA3 | 2.348805744 |
| FCRL4 | 2.346660183 | CRP | 2.332869284 | SPANXB1 | 2.326683931 |
| UTS2R | 2.314650465 | MATN4 | 2.311903817 | ZNF114 | 2.30971043 |
| ADIPOQ | 2.296860368 | KISS1 | 2.295428739 | LIN28B | 2.291059085 |
| ANXA8L1 | 2.248521884 | MAGEB1 | 2.242953797 | SPANXN3 | 2.242130571 |
| IL22RA2 | 2.240150546 | C1QL2 | 2.209979502 | AGBL1 | 2.206686442 |
| TLX2 | 2.202836841 | RLBP1 | 2.159036842 | NPPB | 2.154907807 |
| HTR5A | 2.149124359 | SERPINB3 | 2.14782693 | SBSN | 2.1417701 |
| SPINK6 | 2.114686901 | FOXE1 | 2.096651213 | GNG13 | 2.082021332 |
| ALOXE3 | 2.054881574 | RTP3 | 2.051444937 | OTX1 | 2.040341385 |
| HMX2 | 2.030173909 | KIRREL3 | 2.025763852 | DMRTA2 | 2.018437908 |
| KRT6A | 2.006147507 | IRS4 | −7.069279584 | AQP6 | −6.952633679 |
| LY6L | −6.466292518 | HHATL | −6.178662879 | CRISP3 | −5.942489086 |
| PAGE5 | −5.566923649 | HBG1 | −5.565412617 | SFTPB | −5.46165805 |
| MDFIC2 | −4.7346839 | MAGEA11 | −4.702227866 | CCKAR | −4.620218512 |
| NTSR2 | −4.412067953 | LRRTM1 | −4.295989741 | CLDN8 | −4.291159779 |
| PAGE2B | −4.290100156 | DCAF4L2 | −4.285297367 | CHRM1 | −4.203135741 |
| FEZF2 | −4.181641013 | SERTM2 | −4.084855062 | PSG4 | −4.069117346 |
| DEFB125 | −4.034642804 | ATP6V0A4 | −4.03380667 | ATP6V1G3 | −3.918376267 |
| FXYD4 | −3.882031698 | C10orf71 | −3.845620551 | ST8SIA3 | −3.817050292 |
| TTR | −3.8141048 | PAGE4 | −3.813169574 | FGF9 | −3.781764959 |
| POU3F4 | −3.771004791 | ATP6V0D2 | −3.753224136 | PSG9 | −3.751868431 |
| SPOCK3 | −3.749385525 | TMEM213 | −3.705206888 | KBTBD12 | −3.684155012 |
| KRTAP5–8 | −3.632121999 | PIP | −3.541015006 | TMEM215 | −3.537175656 |
| RHBG | −3.513276723 | CTNNA2 | −3.497574449 | GJD2 | −3.465274322 |
| GLB1L3 | −3.462356811 | SLC4A1 | −3.459997603 | NUPR2 | −3.451627461 |
| HBG2 | −3.360260797 | NR5A1 | −3.354792948 | VWA5B1 | −3.340662569 |
| MLANA | −3.311141752 | OMG | −3.302149224 | BSND | −3.275017729 |
| AQP10 | −3.234439151 | FER1L6 | −3.223091448 | SLC26A7 | −3.196657291 |
| KLK1 | −3.168181356 | ATP6V1B1 | −3.166112958 | RHCG | −3.157008772 |
| FGL1 | −3.146889407 | TNNT3 | −3.130099704 | SLC24A2 | −3.090435759 |
| PLK5 | −3.073715835 | PSG5 | −3.063389834 | TYR | −3.036736515 |
| CD177 | −2.967875945 | CDH7 | −2.947214145 | XAGE5 | −2.941242246 |
| AQP5 | −2.928574991 | LGI1 | −2.920563422 | SCRT1 | −2.915273241 |
| LCN1 | −2.897125323 | CRISP2 | −2.891236689 | CGA | −2.880719932 |
| FOXI1 | −2.856870004 | SLC4A9 | −2.85058536 | GREM2 | −2.846325204 |
| ADAM7 | −2.823853478 | MYMX | −2.780243665 | FOXI2 | −2.747040565 |
| BPIFA2 | −2.744920257 | NXPH2 | −2.73264296 | FAM24B | −2.005641145 |
| CLCNKB | −2.711841094 | DNTT | −2.703518233 | FRG2C | −2.696015544 |
| TMEM61 | −2.688842068 | CASP14 | −2.687885646 | GIMD1 | −2.686569536 |
| LHFPL4 | −2.682599598 | ADCYAP1 | −2.68255206 | TBATA | −2.65671051 |
| DMRT2 | −2.645831657 | MCCD1 | −2.625093054 | PAGE2 | −2.615268476 |
| GPRC6A | −2.613101443 | WFIKKN2 | −2.598374715 | UGT2B4 | −2.586510771 |
| IGF2 | −2.56153826 | KERA | −2.560942199 | FRG2B | −2.549870167 |
| SLC7A13 | −2.544471449 | MOG | −2.537312543 | ASCL4 | −2.534282307 |
| C11orf53 | −2.519948822 | PSCA | −2.507368106 | GCGR | −2.506059534 |
| PLA2G4F | −2.494234559 | DAZ1 | −2.461947613 | NKX6–1 | −2.457759032 |
| RHAG | −2.444447278 | LUZP2 | −2.426420149 | HBM | −2.424034763 |
| NMRK2 | −2.412559163 | TRIM50 | −2.4050669 | LRRC52 | −2.396507205 |
| GRIK1 | −2.380726671 | CRYAA | −2.361368316 | ADRB1 | −2.352091261 |
| AHSP | −2.350914787 | ASB5 | −2.345814708 | CNMD | −2.339953179 |
| GGTLC3 | −2.332560999 | GCG | −2.325940672 | PSG8 | −2.303814006 |
| STAP1 | −2.295027287 | RGS8 | −2.290434876 | STAC2 | −2.269340054 |
| CYP1A1 | −2.246907308 | KRTAP5–3 | −2.240169508 | HBD | −2.234219697 |
| RBBP8NL | −2.232288152 | UGT2B28 | −2.229968426 | ATP13A5 | −2.22816884 |
| SMOC1 | −2.226575753 | DEFA4 | −2.194637278 | FRMD7 | −2.190289838 |
| CA1 | −2.182904697 | CLNK | −2.179307919 | SRARP | −2.162262658 |
| ERP27 | −2.157025947 | KLK4 | −2.152704502 | FAM133A | −2.145658322 |
| PNMT | −2.136928193 | CEACAM7 | −2.131707182 | NRK | −2.11265576 |
| SMIM5 | −2.105569769 | DEFA3 | −2.104237638 | TDGF1 | −2.101766107 |
| ADGRF1 | −2.098885814 | GRM1 | −2.096205239 | HEMGN | −2.091490619 |
| UGT1A4 | −2.087390147 | AL445989.1 | −2.918112259 | PRG4 | −2.083544157 |
| ABCB5 | −2.082109144 | PGPEP1L | −2.077264255 | PCP4 | −2.063618468 |
| HAO1 | −2.062354203 | HSPB3 | −2.051568162 | MYH8 | −2.04723169 |
| THBS4 | −2.085595685 | AL035425.2 | −4.867341747 | C20orf141 | 2.010402307 |
| TMPRSS11E | −4.867341747 | HEPACAM2 | −2.731391743 |