

Abstract
The growth response of ankle flexor and extensor muscles to two models of increased loading, functional overload (FO) and hind-limb reloading following hind-limb suspension, was measured by wet weight in Fisher 344–Brown Norway rats at ages ranging from 6 to 30 months. In response to FO, there was a 40% decrease in absolute growth of the plantaris beginning in middle age. Interestingly, the growth response to FO of 30-month old rats maintained on a 40% calorie-restricted diet improved by more than twofold relative to 30-month old rats on a normal chow diet. Recovery of muscle mass upon reloading following disuse was significantly impaired (reduced 7–16%) in predominantly fast, but not slow, muscles of 30-month relative to 9-month old rats. Initial investigation of the Akt signaling pathway following FO suggests a reduction or delay in activation of Akt and its downstream targets in response to increased loading in old rats.
Keywords: Hypertrophil, Akt, Calorie-restriction
AGING is associated with a reduced capacity for muscle growth and repair in response to increases in resistance loads that occur under a variety of conditions (1,2). Following acute high-resistance eccentric contractions, ankle flexor muscles, such as the extensor digitorum longus (EDL) and the tibialis anterior (TA), from old animals are more susceptible to muscle damage and recover more slowly and incompletely (2,3). Comparison studies in rodents show that acute bouts of eccentric contractions cause injury to the TA muscle as evidenced by a prolonged loss of strength in both young and old animals (4,5). However, within 5 days of the injury, the tensile strength of the TA is fully recovered in the young animals, whereas the TA of old animals remain significantly impaired (5). Moreover, the ability to adapt to repeated bouts of eccentric exercise is impaired in TA of old rats 5.
Additional studies have examined the ability of ankle extensor muscles such as the soleus (SOL), gastrocnemius (GA), and plantaris (PL) from young and old animals to hypertrophy in response to chronic increases in mechanical loading (6–10). Functional overload (FO) can be induced in the ankle extensor muscles through the removal of muscles that function as synergists, producing chronic increases in both neural activity and mechanical loading that lead to significant increases in mass and protein content within 7 days in young adult rodents (11). In contrast, studies performed in old rats have shown a significant impairment in growth following FO (7–9). Muscle growth is also impaired in muscles subjected to reloading following an atrophy-inducing event such as joint immobilization. Immobilization of the ankle and knee joints results in significant atrophy of the ankle extensors that is reversed upon reloading of the limb following cast removal (12). Childs and colleagues (13) report that the SOL of young rats recovers ∼40% of its mass within 15 days of reloading following 10 days of immobilization, whereas there is no significant recovery of SOL mass in old rats after the same period (6). A similar lack of recovery following immobilization has been reported for other ankle extensor muscles of old rats (10).
The mechanisms responsible for the reduced growth capacity of muscles from old animals in response to loading are unknown. Moreover, the degree to which all muscles demonstrate a loss of growth capacity and the age at which it occurs are unknown because few studies have compared the effects of loading on flexors and extensors in a single model. Further, few studies have examined the growth capacity of middle-aged rats, choosing to restrict their analysis to young versus old rats. The purpose of this study was to determine the extent to which different muscle types experience a deficit in growth response with age and under what circumstances. To achieve our objective, we examined the growth response of hind-limb muscles to two models of increased mechanical loading: bilateral synergist ablation or FO and hind-limb reloading following atrophy induced by hind-limb suspension (HU/REL) in male Fisher 344–Brown Norway F1 hybrid (FBN) rats at multiple ages ranging from 6 to 30 months. The choice of FO and hind-limb suspension/reloading provides a comparison of the growth response of skeletal muscle to increased loading under different starting conditions, that is under “normal” resting conditions versus following a period of disuse and atrophy. These different starting conditions may lead to different growth responses that are affected differentially by aging.
In addition, we investigated the growth response of old rats maintained on a calorie-restricted (CR) diet to FO. Recent literature (14–16) has suggested that lifelong CR in rats attenuates the loss of skeletal muscle with age and may improve protein turnover and oxidative metabolism relative to rats maintained on a normal chow diet, leading us to hypothesize that old CR rats would have an improved growth response relative to old ad libitum fed rats. These data provide the foundation for further investigations into the cellular mechanisms responsible for the decrease in growth capacity that occurs with increasing age.
MATERIALS AND METHODS
Animals
All experiments were performed in male FBN rats ranging in age from 6 to 30 month old. Adult rats were purchased from a rodent colony maintained by the National Institute on Aging and arrived ∼2 weeks prior to experimentation. Upon arrival, rats were housed individually and maintained on either an ad libitum rat chow diet or a 40% CR diet. CR was initiated at 14 weeks of age at 10% restriction, increased to 25% restriction at 15 weeks of age and to 40% restriction at 16 weeks where it was maintained throughout the life of the animal. Approval was received from the Institutional Animal Care and Use Committee at the University of California, Davis, for all animal procedures.
Experimental Models
Animals were assigned to one of two experimental groups: FO or hind-limb reloading following hind-limb suspension (HU/REL). Unloading of the lower limb muscles was accomplished using a noninvasive tail suspension model (17). The tail was attached via traction tape and a plastic bar to a swivel mounted at the top of the cage, allowing free 360° rotation. The rats were maintained in ∼30° head-down tilt position with their hind limbs unloaded for a period of 14 days. On the 15th day of suspension, the animals were released from suspension and the hind limbs were allowed full weight bearing. The rats were housed individually in standard rat cages and allowed to recover for a period of 14 days.
The PL muscle in both legs was functionally overloaded by the surgical removal of its major synergists: the SOL and GA (medial and lateral heads) muscles. Animals were anesthetized with isoflurane gas and prepared for surgery using aseptic procedures. The Achilles tendon was isolated at the calcaneous, and the tendons of the SOL and GA muscles will be cut. The SOL was removed completely, whereas only the distal one half of the medial and lateral heads of the GA were removed. Partial excision of the GA is performed instead of tenotomy to minimize the tendency for muscle and connective tissue reattachment to occur in the ankle region. A bilateral approach was used to prevent the animals from favoring the contralateral limb.
For all experiments, cohorts of animals of a specific age arrived at University of California, Davis, together and then were randomly assigned to control and experimental groups. Using this design, the initial properties of control and experimental animals were matched as closely as possible to each other. The control animals for each experiment were housed individually, and tissue samples were collected upon completion of the experimental treatment (i.e., FO or hind-limb unloading [HU]). The tissue samples collected from the control group were used as a reference to determine the percent change in muscle mass in the experimental groups.
Tissue Collection
Tissue samples were collected upon completion of the experimental treatment. Tissue collection occurred in the morning with the animals in a fed state. Rats were given an injection of ketamine/xylazine (85 mg/kg, 5 mg/kg), and the hind-limb muscles were dissected with the animals in a deeply anesthetized state. Muscles were dissected, freed of connective tissue, weighed, frozen in liquid nitrogen, and stored at –80° C for later analysis. Upon completion of the tissue removal, the rats were killed by exsanguination.
Tissue Homogenization and Determination of Protein Concentration
Whole muscles were homogenized on ice in buffer containing 50 mM N-2-hydroxyethylpiperazine-N-2-ethanesulfonic acid (pH 7.4), 0.1% Triton X-100, 4 mM ethyleneglycol-bis(aminoethylether)-tetraacetic acid, 10 mM ethylenediaminetetraacetic acid, 15 mM Na4P2O7•H2O, 100 mM β-glycerophosphate, 25 mM NaF, 50 μg/mL leupeptin, 50 μg/mL pepstatin, 40 μg/mL aprotinin, 5 mM Na3VO4, and 1 mM phenylmethylsulfonyl fluoride as previously described (18). Protein concentration of the total muscle homogenate was determined in triplicate using the bicinchoninic acid protein assay as recommended by the manufacturer (Pierce Laboratories, Rockford, IL).
Western Blots
The relative expressions of the initiation factor, eIF2B epsilon, and the protein kinase, Akt/PKB, were determined by Western blot analysis. Samples containing equal amounts of protein were resolved by sodium dodecyl sulfate– polyacrylamide gel electrophoresis (SDS–PAGE), and proteins in the gel were electrophoretically transferred to polyvinylidene difluoride (PVDF) membranes. The membranes were probed with primary antibody and subsequently developed with enhanced chemiluminescence (Amersham Biosciences Piscataway, NJ). Bands from the immunoblots were scanned and quantified by densitometry (VersaDoc 4000, Quantity One Software, BioRad, Hercules, CA). Phosphorylation of Akt/PKB was determined using an antiphospho-Akt antibody (Ser-473) obtained from Cell Signaling Technology (Beverly, MA). Total Akt was measured using an antibody that recognized all Akt isoforms (Cell Signaling Technology). Expression of eIF2B epsilon was assessed with an antibody developed and supplied by S. Kimball (19).
The association of eIF4E with 4E-BP1 or eIF4G was determined following immunoprecipitation of eIF4E using immunoblot techniques as previously described (20). Briefly, eIF4E will be immunoprecipitated from muscle homogenates using a monoclonal anti-eIF4E antibody (supplied by S. Kimball). Proteins in the immunoprecipitate were resolved by SDS–PAGE and then transferred to PVDF membranes. The membranes were probed with a rabbit anti-eIF4G antibody or rabbit anti-4EBP1 antibody (Bethyl Laboratories, Montgomery, TX). Membranes were reprobed with the monoclonal anti-eIF4E antibody. The abundance of eIF4G and 4E-BP1 was normalized to the amount of eIF4E present in the immunoprecipitate.
Statistical Analysis
An one-way analysis of variance using Fisher's post hoc correction for multiple paired comparisons was used for comparisons between groups (Statview Statistical software, SAS, Cary, NC). Statistical significance was set at p < .05.
RESULTS
FBN rat is a well-established rodent model for the study of aging (21). The wet weight of selected flexor and extensor muscles of the lower limb were measured in male FBN rats ranging in age from 6 to 30 months (Table 1). To assess the effect of age on muscle mass, one age group must be assigned as representative of “young, mature adult” animals, the data revealed that peak wet weight of lower limb muscles occurred around 9 months, not 6 months of age (Table 1). Further, the age at which muscle loss was detected varied across the different muscle types and was dependent on the age group used as the reference. For example, using 6 months as the reference for young mature adult rats, significant muscle loss was not apparent in any of the lower limb muscles until 30 months of age. In contrast, when 9 months was used as the reference, significant muscle loss was apparent in the medial gastrocnemius (MG) and TA at 26 months of age, whereas the SOL and EDL showed significant muscle loss beginning at 30 months of age. Using 9 months as the reference, the greatest age-related muscle loss at 30 months was observed in the MG (34%), followed by the TA (28%), PL (28%), EDL (23%), and SOL (17%).
Table 1.
Age-Related Alterations in Muscle Mass
| 6-Mo | 9-Mo | 18-Mo | 26-Mo | 30-Mo | |
| Body weight, g | 399 ±19* | 512 ± 15 | 577 ± 25 | 600 ± 47* | 566 ± 76 |
| Soleus | |||||
| Wet weight, mg | 150 ± 8* | 202 ± 20 | 188 ± 3 | 191 ± 18 | 167 ± 15* |
| mg/g BW | 0.38 ± 0.01 | 0.394 ± 0.033 | 0.32 ± 0.015* | 0.32 ± 0.01* | 0.30 ± 0.013* |
| Plantaris | |||||
| Wet weight, mg | 392 ± 23* | 486 ± 24 | 490 ± 25 | 410 ± 24* | 352 ± 28* |
| mg/g BW | 1.35 ± 0.078 | 1.36 ± 0.112 | 1.14 ± 0.076* | 0.93 ± 0.088* | 0.76 ± 0.06* |
| Medial gastrocnemius | |||||
| Wet weight, mg | 888 ± 45* | 1110 ± 53 | 1036 ± 36 | 896 ± 81* | 731 ± 66* |
| mg/g BW | 2.22 ± 0.076 | 2.17 ± 0.087 | 1.81 ± 0.14* | 1.49 ± 0.12* | 1.30 ± 0.10* |
| Tibialis anterior | |||||
| Wet weight, mg | 734 ± 41* | 931 ± 45 | 903 ± 22 | 821 ± 68* | 669 ± 47* |
| mg/g BW | 1.84 ± 0.054 | 1.82 ± 0.06 | 1.52 ± 0.117* | 1.37 ± 0.123* | 1.21 ± 0.249* |
| Extensor digitorum longus | |||||
| Wet weight, mg | 173 ± 8* | 221 ± 11 | 215 ± 7 | 208 ± 19 | 170 ± 16* |
| mg/g BW | 0.43 ± 0.006 | 0.43 ± 0.014 | 0.36 ± 0.023* | 0.35 ± 0.013* | 0.30 ± 0.042* |
Notes: Body weight (g) and muscle weight for male Fisher 344–Brown Norway F1 hybrid rats at various ages (n = 6–8 per age group). Muscle weight is expressed as a wet weight (mg) and normalized to body weight (mg wet weight/g BW). Data are expressed as mean ± standard deviation.
A significant difference (p < .001) from the 9-mo age group.
Muscle weight as a fraction of whole body weight (milligram of muscle/gram of body weight) was also calculated and presented in Table 1. Alterations in the normalized muscle weight reflect changes in both muscle mass and body weight with age. Lean body mass reached a peak at ∼9 months; therefore, increases in body weight after 9 months primarily reflect increases in the amount of whole-body adipose tissue. There was a decrease in normalized muscle mass at 18 months that was related primarily to an increase in whole-body fat mass. In contrast, the decrease in normalized muscle mass at 30 months was a reflection of significantly greater decrease in muscle mass relative to body weight (Table 1).
Growth Response to Chronic-Increased Loading in Aging Rats
In our initial experiment, we chose to examine the growth response of the PL muscle of rats aged 6–30 months to 14 days of FO. The FO (or compensatory hypertrophy) model is a well-established model of muscle hypertrophy in response to chronic increases in mechanical loading and produces significant growth in young animals by 7 days (11). Here, 14 days of chronic loading produced significant growth in the PL muscle at all ages (Table 2); however, the absolute and relative amount of growth differed significantly between the age groups. The relative amount of growth for each FO group was calculated as the percent increase relative to control, where the controls were age- and weight-matched animals randomly assigned from a single cohort of animals. The relative amount of growth in response to FO (relative difference in Table 2) was similar at 6 and 9 months of age but dropped significantly at 18 months. Calculation of the mean absolute gain in mass due to FO revealed a large drop in the growth response between 9 and 18 months followed by a slower progressive loss of growth with advancing age (Figure 1). These data reveal that the loss of muscle growth in response to loading is not restricted to rats of advanced age.
Table 2.
Growth Response of PL to 14 Days of FO
| 6-Mo | 9-Mo | 18-Mo | 26-Mo | 30-Mo | |
| CON | |||||
| Body weight (g) | 398 ± 19 | 512 ± 15 | 565 ± 37 | 600 ± 46 | 566 ± 76 |
| Wet weight (mg) | 392 ± 23 | 489 ± 24 | 490 ± 25 | 410 ± 352 | 352 ± 28 |
| mg/g BW | 0.94 ± 0.033 | 0.95 ± 0.032 | 0.81 ± 0.119 | 0.65 ± 0.037 | 0.63 ± 0.087 |
| FO | |||||
| Body weight (g) | 390 ± 35 | 490 ± 17 | 536 ± 32 | 562 ± 73 | 593 ± 32 |
| Wet weight (mg) | 528 ± 54* | 632 ± 44* | 572 ± 26* | 484 ± 45* | 404 ± 30† |
| mg/g BW | 1.35 ± 0.75* | 1.36 ± 0.112* | 1.14 ± 0.76* | 0.93 ± 0.088* | 0.76 ± 0.06† |
| Relative difference (%) | 37 ± 10 | 30 ± 13 | 19 ± 11 | 17 ± 14 | 15 ± 9 |
Notes: The body weight (g), plantaris (PL) muscle wet weight (mg), and normalized weight (mg muscle/g BW) from rats in the control (CON) and functional overload (FO) groups at various ages. The relative difference is the % difference in PL wet weight between the CON and FO groups. Data are mean ± standard deviation (n = 6 per group).
A significant difference between the CON and FO groups (p < .001) within an age group.
A significant difference between the CON and FO groups (p = .02) within an age group.
Figure 1.
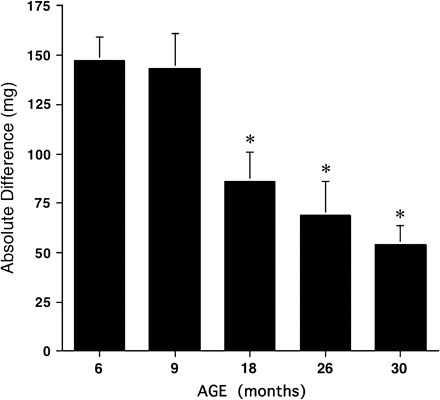
The absolute difference in mass (expressed in milligrams) between the plantaris of the control and functional overload groups was calculated and plotted for each age group. Bars are mean ± standard error. Asterisk denotes a significant difference (p < .001) from the 9-mo age group.
Regrowth of Muscle Following Atrophy Is Impaired in Old Rats
Next, we compared the ability of skeletal muscles from young (9 months) and old (30 months) rats to recover their mass following an atrophy-inducing event. The recovery of mass in muscles of the lower limb was studied following 14 days of HU induced by tail suspension; a model that induces atrophy in both extensor and flexor muscles (11). At each age, the initial body weights in each experimental group were similar. Following the 14-day suspension period, there was a loss of body weight in both age groups: ∼11% loss in the young rats and ∼17% loss in the old rats. During the 14-day reloading period, the young rats recovered their lost weight, whereas the old rats showed no increase in body weight.
In both young and old rats, 14 days of suspension resulted in significant atrophy of the SOL, MG, PL, TA, and EDL muscles (Table 3). The relative amount of atrophy (percent loss of mass following hindlimb suspension relative to age- and weight-matched controls) in all muscles was similar between the young and old rats (Table 3), with the greatest percent loss occurring in the SOL (42% loss) and the least in the EDL (13% loss).
Table 3.
Response of Hind-Limb Muscles in Young and Old Rats to HU and Reloading
| Age | Control | HU | % Loss | HU/REL | ||
| Body weight | 9 | Pre | 410 ± 86 | 400 ± 15 | 418 ± 20 | |
| Post | 436 ± 23 | 353 ± 21 | 367 ± 25 | |||
| 30 | Pre | 549 ± 32 | 565 ± 10 | 592 ± 42 | ||
| Post | 552 ± 34 | 471 ± 11 | 479 ± 37 | |||
| Soleus | 9 | 166 ± 10 | 99 ± 3* | 42% | 146 ± 15† | |
| 30 | 161 ± 13 | 104 ± 10* | 34% | 142 ± 15 | ||
| p = .06† | ||||||
| Plantaris | 9 | 438 ± 23 | 325 ± 19* | 25% | 422 ± 21† | |
| 30 | 355 ± 31 | 274 ± 22* | 22% | 314 ± 27 | ||
| p = .02† | ||||||
| Medial gastrocnemius | 9 | 978 ± 16 | 666 ± 43* | 32% | 887 ± 51 | |
| p = .02† | ||||||
| 30 | 754 ± 37 | 510 ± 57* | 30% | 612 ± 42*† | ||
| Tibialis anterior | 9 | 826 ± 34 | 665 ± 54* | 19% | 813 ± 69† | |
| 30 | 684 ± 60 | 593 ± 26* | 14% | 597 ± 43*† | ||
| Extensor digitorum longus | 9 | 193 ± 13 | 162 ± 9* | 13% | 187 ± 12† | |
| 30 | 176 ± 18 | 149 ± 15* | 14% | 150 ± 17*† |
Notes: Body weights (g) and muscle wet weights (mg) taken from male Fisher 344–Brown Norway F1 hybrid rats aged 9 and 30 mos subjected to 14 days of hind-limb unloading (HU) alone or 14 days of HU followed by 14 days of hind-limb reloading (HU/REL). The mean body weights are given for each experimental group both before (pre) and after (post) the HU period. For the control group, rats were maintained in standard rat cages for 14 days during the HU period. The percent muscle loss (% loss) is the average loss of wet weight due to the HU, calculated as a % relative to control. Data are mean ± standard deviation (n = 6 per group).
A significant difference from control (p < .01).
A significant difference between HU and HU/REL (p < .01).
Upon reloading of the hind limbs after 14 days of disuse, the atrophied muscles hypertrophied, recovering much of their lost mass by 14 days of reloading. In young rats, the mass of the PL, TA, and EDL muscles recovered to control values after 14 days of reloading (Table 3). In contrast, in old rats, none of the muscles recovered to their control values after 14 days of reloading. The control values, at each age, are based on body weight–matched animals selected from the same cohort of rats as the suspended rats and housed in standard rat cages for the duration of the suspension. The SOL muscles of both young and old rats recovered to a similar degree upon reloading, reaching values that were not significantly different from control after the 14-day reloading period (Table 3). In marked contrast, the recovery of MG, PL, TA, and EDL mass was significantly impaired in the old relative to the young rats (Figure 2). In the MG, PL, and TA muscles, the amount of mass recovered relative to the amount of mass that was lost was much less in the old compared with the young rats. For example, in young rats, the MG lost an average of 306 mg after the suspension, which was 31% of the control, and gained back an average of 206 mg following 14 days of reloading, which was 67% of the mass that was lost. In contrast, in 30-month old rats, the MG lost an average of 217 mg, which was 30% of the control, and gained back only 88 mg following the reloading, which was 40% of the mass that was lost. Additionally, the TA and EDL both showed poor recovery of mass upon reloading in the old rats. In young rats, the TA recovered ∼90% of the mass that was lost during unloading. In comparison, the TA from old rats recovered only 29% of the mass that was lost during unloading. In the EDL, there was complete recovery of mass in the young rats, whereas there was no recovery of mass in the old rats.
Figure 2.

Histograms representing the extent of atrophy in the plantaris (PL), medial gastrocnemius (MG), tibialis anterior (TA), and extensor digitorum longus (EDL) muscles of 9-mo (open bars) and 30-mo (solid bars) old Fisher 344–Brown Norway F1 hybrid rats following 14 days of reloading after a 14-day unloading period. The amount of atrophy is expressed as the % difference between the control and the reloaded muscles. * denotes a significant difference from the control at the p < .001 level. # denotes a significant difference from control at the p = .02 level.
CR Improves the Response to Muscle Loading
The growth of the PL muscle to 14 days of FO was examined in three groups of male FBN rats: 8-month ad libitum fed, 30-month ad libitum fed, and 30-month CR. Fourteen days of chronic loading resulted in a significant increase in PL mass in the 8-month ad libitum (AL) and 30-month CR groups, but not the 30-month AL group (Table 4). The amount of protein per muscle, calculated as the product of protein concentration and muscle weight, was significantly increased in the PL of the 8-month AL and 30-month CR groups, but not the 30-month AL group following FO. The absolute amount of muscle growth in the 30-month CR rats (86 ± 50 mg, M ± SD) was significantly greater than that observed in the 30-month AL rats (36 ± 52 mg) and similar to that observed in the 18-month AL rats (86 ± 52 mg, Figure 1).
Table 4.
FO in Old CR Rats
| Group | 8-Mo AL | 30-Mo AL | 30-Mo CR | |
| Body weight (g) | CON | 414 ± 38 | 533 ± 48 | 349 ± 23 |
| FO | 404 ± 25 | 505 ± 45 | 303 ± 36 | |
| PL wet weight (mg) | CON | 419 ± 12 | 353 ± 24 | 327 ± 29 |
| FO | 513 ± 13* | 389 ± 45 | 413 ± 52* | |
| PL protein content (mg) | CON | 91 ± 3 | 67 ± 5 | 79 ± 8 |
| FO | 107 ± 2* | 79 ± 11 | 99 ± 9** |
Notes: Functional overload (FO) was induced in the plantaris (PL) muscle for 14 days in three groups of male Fisher 344–Brown Norway F1 hybrid rats: 8-mo ad-libitum fed, 30-mo ad-libitum fed, and 30-mo 40% calorie restricted (CR). Data are mean ± standard deviation (n = 6 per group).
A significant difference between the control (CON) and FO groups (p < .001) within a group.
Activation of the Akt Signaling Pathway Following FO in Young and old Rats
Because activation of Akt and its downstream targets has been shown to be a key regulator of load-induced hypertrophy (22,23), we first examined the phosphorylation status of Akt in the FO model following 14 days of chronic-increased loading. Following 14 days of FO, Akt phosphorylation was elevated in the overloaded PL of young (6-month), middle-aged (18-month) and old (26- and 30-month) animals (Figure 3A). Interestingly, at 14 days post FO, the increase in Akt activation, as calculated by the level of phosphorylation relative to protein, was greater in the older (26- and 30-month) than the younger (6- and 18-month) rats (Figure 3B).
Figure 3.
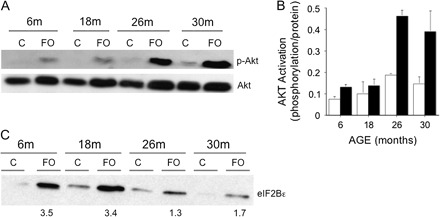
Akt and eIF2Bϵ expressions in male 6-, 18-, 26-, and 30-mo old Fisher 344–Brown Norway F1 hybrid rats following 14 days of functional overload (FO). (A) Western blots of phosphorylated (Ser-473) and native Akt in the plantaris (PL) of control (C) or 14-day FO rats. Each lane represents 200 μg of total protein extracted from a pool of three PL muscles. (B) Histogram of Akt activation, calculated as level of phosphorylation per amount of protein, in control (white) and FO (black) PL muscles of rats at different ages. Bars represent mean ± standard error of six rats. (C) Western blots of eIF2ϵ in the PL of control (C) or 14-day FO rats. Each lane represents 200 μg of total protein extracted from a pool of three PL muscles. The numbers below the FO lanes represent the mean fold increase in protein expression relative to control.
Next, we examined a downstream target of Akt, the formation of eIF4E:eIF4G complexes, which is dependent on the activation of mTOR and the dissociation of 4E-BP1 from eIF4E (24). In young rats (6-month), there was an increase in the formation of eIF4G:eIF4E complexes and a decrease in the amount of eIF4E:4E-BP1 complexes in the PL following 14 days of FO (Figure 4). In marked contrast, there was no change in the distribution of eIF4G:eIF4E and eIF4E:4E-BP1 complexes in the PL of 26-month old rats 14 days following FO (Figure 4). These data suggest that mTOR may not be fully activated in older rats in response to increases in mechanical loading.
Figure 4.
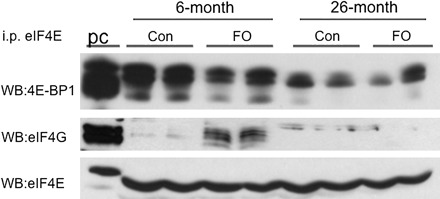
Western blots (WB) of 4E-BP1, eIF4G, and eIF4E following immunoprecipitation (i.p.) of eIF4E from plantaris (PL) homogenates. eIF4E was immunoprecipitated from muscle homogenates using a monoclonal anti-eIF2E antibody. Each lane represents a pool of three muscles. The first lane represents positive controls (pc) for each of the antibodies. PL muscles were taken from the control (Con) or 14-day overloaded (FO) rats. Functional overload was performed in male Fisher 344–Brown Norway F1 hybrid rats age 6 and 26 mos.
Another potential target of mTOR regulation during increased mechanical loading is eIF2B epsilon (19). Analysis of eIF2Bϵ protein expression at 14 days post FO by Western blot demonstrated that eIF2Bϵ increased (1.3- to 3.5-fold) in response to increased loading at all ages studied; however, the fold increase was greater in the younger (6- and 18-month) versus older (26- and 30-month) rats (Figure 3C).
Given the Akt phosphorylation results at 14 days, we analyzed an additional cohort of 6- and 26-month old rats after 7 days of FO. Analysis of Akt activation revealed a significant increase (p = .004) in the level (2.5-fold) of Akt phophorylation in the young (6-month) rats, but no significant increase (p = .17, 1.4-fold) in the old (26-month) rats (Figure 5A). Examination of eIF2Bϵ protein expression showed a significant increase in protein expression at both 6 (2.8-fold) and 26 (2.9-fold) months, with a greater overall expression level in the 6- versus the 26-month rats (Figure 5B).
Figure 5.
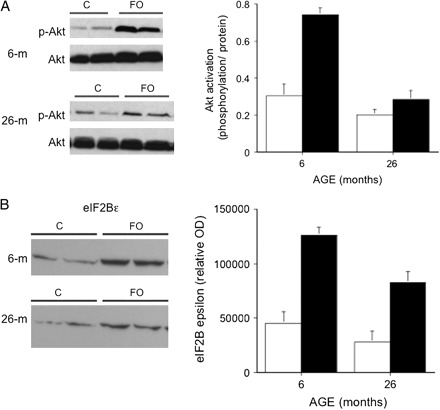
Akt and eIF2Bϵ expressions in male 6- and 26-mo old Fisher 344–Brown Norway F1 hybrid rats following 7 days of functional overload (FO). (A) Western blots of phosphorylated (Ser-473) and native Akt in the plantaris (PL) of control (C) or 7-day FO rats aged 6 and 26 mos. Each lane represents 200 μg of total protein extracted from a single PL muscle. Histogram of Akt activation, calculated as level of phosphorylation per amount of protein, in control (white) and FO (black) PL muscles of rats aged 6 and 26 mos. Bars represent mean ± standard error of six rats. (B) Western blot of eIF2ϵ in the PL of control (C) or 7-day FO rats aged 6 and 26 mos. Each lane represents 200 μg of total protein extracted from a single PL muscle. Histogram of eIF2ϵ protein expression, calculated as a relative optical density, in control (white) and FO (black) PL muscles of rats aged 6 and 26 mos. Bars represent mean ± standard error of six rats.
DISCUSSION
The present study presents new findings on the response of skeletal muscles to altered loading as a function of age. The key findings of this study were: (a) skeletal muscle growth in response to chronic-increased loading begins to decline in middle age and continues to decline with advancing age, (b) there is a variable effect of age on the response of different muscles to increased loading, and (c) animals subjected to lifelong CR have an improved response to increased loading at old ages. Initial investigation on the mechanisms responsible for the altered growth response suggests that there is a delay in the activation of Akt and a reduction in the activation of targets downstream of mTOR.
Muscle Growth in Response to Loading Declines in Middle Age
Previous studies have demonstrated that growth in response to FO is impaired in the PL of old rats (7–9). Here we demonstrate that growth is indeed impaired in old rats; however, the decline in growth in response to a loading stimulus is progressive and begins in middle age between the ages of 9 and 18 months. A large decrease in growth following resistance loading has not previously been reported in middle-aged rodents. In the present study, we observed that absolute growth in response to FO decreased between 9 and 30 months as predicted; however, the decline in growth response was much greater between 9 and 18 months than between 18 and 30 months. The decrease in growth at 18 months was unexpected given that there is no age-associated loss of mass in the PL muscle at this age (Table 1). Moreover, previous literature suggests that muscle maintains its ability to adapt to growth signals during much of its life span and declines only in advanced age (8).
The effect of age on the response to loading may be dependent on the muscle type and the amount of load. Thompson and Gordon (9) showed that the growth response of the SOL to 7 days of FO is similar in 8- and 30-month old FBN rats, whereas the growth response of the PL is significantly reduced in 30-month relative to 8-month old rats. Interestingly, the amount of growth that we found in the 30-month old rats after 14 days of FO was similar to what Thompson and Gordon (9) found after only 7 days of FO. This suggests that in older rats, the growth response to loading is suppressed and not simply delayed. Determination of whether growth is delayed versus suppressed in middle-aged and old rats will require further study with longer time points.
Few chronic loading studies have been performed in animals of middle age; however, Marsh and colleagues (25) did report that the TA of 18-month old male FBN rats has a diminished regenerative capacity following bupivacaine-induced muscle degeneration. Further, exploratory behavior and locomotor activity have been shown to progressively decline with age (26). Curiously, a significant decrease in daily wheel running activity has been observed after 12 months of age in FBN rats (27). The extent to which a decrease in activity and a decrease in muscle growth response to load are related is unknown. A decrease in the total amount of daily locomotor activity following FO or reloading following atrophy could lead to a decrease in the amount of loading and affect the growth response. Future studies will need to monitor daily locomotor behavior during the loading period to determine if alterations in activity are affecting the response to increased loading.
Response of Different Muscle Types to Altered Loading
The recovery of muscle mass following an atrophy-inducing event provides another model in which to examine muscle growth in response to a loading signal (28). The HU/REL model was selected in order to study the response of multiple muscle types, that is flexor versus extensor and fast versus slow phenotypes to alterations in load. The HU/REL model differs from the FO model in that the hind-limb muscles experience an increase in load following a period of unloading and muscle atrophy. Due to the differential atrophy of the flexor and extensor muscles, there may be differential loading on the various muscles upon reweighting of the hind limbs. Further, the signaling pathways that are altered in response to loading may differ when the loading period is preceded by muscle atrophy as opposed to loading a “healthy” muscle. For example, following unloading there will be a decrease in protein synthesis and activation of protein degradation (22,24,29) pathways that do not occur in the FO model. In addition, reloading following unloading has been shown to lead to an increase in inflammatory cells and muscle damage in some muscles (30,31). Should the extent of inflammation, apoptosis (32,33), and muscle injury increase upon reloading in aged rats there may be a decrease or delay in recovery due to a decrease in regenerative capacity.
In the HU/REL model, hypertrophy of the PL upon reloading was impaired in old rats, as it was in the FO model. Further, the recovery of mass in the MG, TA, and EDL was also impaired in old rats. In contrast, the recovery of the SOL was similar in young and old rats. The large deficit observed in the dorsiflexor muscles (TA and EDL) after 14 days of recovery was unexpected given that they show the least amount of atrophy. In young juvenile Sprague Dawley rats, we find that in the first 3 days following reloading, muscle mass initially decreases in the ankle flexors, whereas it increases in the ankle extensors (unpublished observations). After 14 days of recovery, however, the mass of both flexor and extensor muscles is back to control values (22). These results suggest that there may be an initial injury response in the flexor muscles upon reloading of the hind limb. Given the observation that old muscle is more susceptible to injury than young muscle, it is possible that the large deficits observed in the TA and EDL of the old rats are related to an increased injury response experienced upon reloading (3,5). Future studies will be required to examine the time course of recovery following unloading and the cellular mechanisms responsible for the deficit.
The extent of the recovery of SOL mass was unexpected given that Morris and colleagues (6) found no recovery of SOL mass following 10 days of immobilization in 30-month FBN rats. The normal recovery of mass observed in the HU/REL model is not a consequence of less atrophy because the SOL atrophied 35% following 14 days of HU (Table 3) and only 19% following 10 days of immobilization (6). The variable results could be related to differential effects of the disuse models on joint mobility. Periods of limb immobilization can result in the development of joint stiffness and loss of joint mobility (34,35), whereas in the tail suspension model the joints remain mobile and do not develop contractures (S. Bodine, unpublished observations). Consequently, upon reloading, movement may be restricted at the knee and ankle joints following cast immobilization, especially in old rats that may be more susceptible to developing joint contractures. A loss of joint mobility could alter overall locomotor activity and the loads placed on the muscle resulting in a reduction in growth signals.
The general response to reloading in the old rats was a decrease in the amount of growth, although the absolute effect was variable across muscles. In general, the muscles that showed the poorest recovery of mass following unloading were those muscles that experienced the greatest age-related loss of mass. Both the impairment in recovery of muscle mass and the loss of muscle mass as a function of age were least in the SOL and greatest in the MG (SOL < PL < TA < MG). It is interesting to note that the responses to both FO (9) and to reloading following atrophy were better in SOL than PL in the old animals. Although the SOL in old rats is able to hypertrophy in response to chronic loading following atrophy and FO, its response to intermittent reloading during HU is significantly reduced. Gallegly and colleagues (36) found that intermittent reloading (consisting of 1 hour per day of weight bearing activity) during 14 days of HU is capable of attenuating atrophy in the SOL of young and middle aged, but not old FBN rats. The explanation for the lack of response is unclear; however, it may be that a longer duration of loading or higher loads are required in the older animals to get a growth response similar to the young animals.
CR Improves Muscle Growth Response
Caloric restriction (CR) in rodents is recognized to retard the rate of aging and delay the appearance and intensity of many age-related diseases such as diabetes and hypertension (37–39). Although CR has been reported to slow the loss of muscle mass and prevent the decline in force per cross-sectional area (40–42), it is not known whether CR improves the ability of aged skeletal muscle to respond to growth signals that occur during resistance exercise or during reloading after atrophy. This study presents the first evidence that lifetime CR has an effect on the ability of muscles from old rats to respond to growth stimuli. The amount of growth in response to 14 days of FO was significantly improved in 30-month old rats maintained on a CR diet versus an ad-libitum diet. The mechanisms responsible for the beneficial effects of CR are not understood; however, a number of gene expression studies have shown that, in skeletal muscle, CR prevents the age-associated downregulation of genes involved in protein metabolism and energy metabolism, specifically oxidative metabolism (42–45). One possibility is that muscles from aged CR rats may have improvements in the ability to activate protein synthetic pathways in response to loading. Whether CR improves the growth response of middle-aged rats or regrowth following atrophy is unknown and requires further study.
Muscle Growth and Activation of Protein Synthesis
The mechanism(s) responsible for the age-associated attenuation in the growth response to loading signals are unknown. The signaling pathways responsible for regulating cell size in adult muscle under growth and atrophy conditions are complex; however, evidence suggests a critical role for the PI3K/Akt/mTOR pathway and the initiation of protein translation (22,46). A reduced capacity to either activate protein translation through a reduced capacity to sense changes in mechanical load or activate specific signal transduction pathways could affect the ability to increase cell size in response to “growth signals” such as mechanical loading.
Recent findings suggest that protein translation may not be fully activated following resistance exercise in older rats. Parkington and colleagues (47) found that a single bout of contractile activity elicited by high-frequency stimulation results in decreased activation of mTOR, S6K1, and ERK1/2 in old relative to young muscles. Further, Funai and colleagues (48) found that eIF4G–eIF4E association and phosphorylation of 4E-BP1 and GSK3 (markers of increases in protein translation) increase in young, but not old muscle in response to high-frequency electrical stimulation.
In the present study, we demonstrate that in older rats (26 and 30 months), there appears to be a delay, and possibly a reduction, in the phosphorylation and activation of Akt following increased loading induced by synergist ablation. Additionally, there was a reduction in the formation of eIF4G:eIF4E complexes and a decrease in the upregulation of eIF2Bϵ expression in old rats 14 days after FO that could lead to alterations in protein synthesis as the result of a decrease in protein translation. It should be mentioned that our results were made with animals in a postprandial state that could influence the phosphorylation status of protein kinases in the Akt signaling pathway. Whether a reduction in protein translation and protein synthesis occurs in the older rats in response to loading needs to be directly measured. Our results, however, are consistent with those of Thomson and Gordon (49) who noted a decrease in the activation of mTOR and its downstream targets S6K1 and 4E-BP1 in the PL of old FBN rats subjected to 7 days of FO. With respect to Akt signaling, the data are puzzling because the response of middle-aged rats (18-month) was similar to the young rats (6-month) even though they showed a significant decrease in muscle growth in response to loading. Further studies are required to determine whether different mechanisms are responsible for the growth deficiencies in middle-aged versus old rats.
Summary
The present data document the extent of the growth deficit in various muscle types in response to growth cues induced by chronic loading and provide a framework for future studies. These data provide further evidence demonstrating that under a variety of loading conditions, muscles from old animals, while capable of hypertrophy, demonstrate a reduction in the absolute amount of growth. Further, this study provides evidence that the loss of growth capacity begins in middle age and progresses with advanced age, supporting the need for studies that examine a range of ages from young adult to old age. An inability to respond to mechanical loading or to restore muscle size following extended periods of inactivity could accelerate the progression of sarcopenia and contribute to the loss of functional mobility, independence, and the onset of frailty. An understanding of the mechanisms that regulate age-related loss of growth capacity will assist with the development of therapies to promote muscle growth, especially following injury and atrophy in the elderly.
Acknowledgments
We thank Tamara Mahmood for providing technical assistance. Parts of this work were presented in abstract form at the Experimental Biology Meetings. We thank S. Kimball for the generous gift of the antibodies.
References
- 1.Kosek DJ, Kim JS, Petrella JK, Cross JM, Bamman MM. Efficacy of 3 days/wk resistance training on myofiber hypertrophy and myogenic mechanisms in young vs. older adults. J Appl Physiol. 2006;101(2):531–544. doi: 10.1152/japplphysiol.01474.2005. [DOI] [PubMed] [Google Scholar]
- 2.Faulkner JA, Brooks SV, Zerba E. Muscle atrophy and weakness with aging: contraction-induced injury as an underlying mechanism. J Gerontol A Biol Sci Med Sci. 1995 doi: 10.1093/gerona/50a.special_issue.124. 50 Spec No:124–129. [DOI] [PubMed] [Google Scholar]
- 3.Brooks SV, Faulkner JA. Contraction-induced injury: recovery of skeletal muscles in young and old mice. Am J Physiol. 1990;258(3 Pt 1):C436–C442. doi: 10.1152/ajpcell.1990.258.3.C436. [DOI] [PubMed] [Google Scholar]
- 4.Rathbone CR, Wenke JC, Warren GL, Armstrong RB. Importance of satellite cells in the strength recovery after eccentric contraction-induced muscle injury. Am J Physiol Regul Integr Comp Physiol. 2003;285(6):R1490–R1495. doi: 10.1152/ajpregu.00032.2003. [DOI] [PubMed] [Google Scholar]
- 5.McBride TA, Gorin FA, Carlsen RC. Prolonged recovery and reduced adaptation in aged rat muscle following eccentric exercise. Mech Ageing Dev. 1995;83(3):185–200. doi: 10.1016/0047-6374(95)01629-e. [DOI] [PubMed] [Google Scholar]
- 6.Morris RT, Spangenburg EE, Booth FW. Responsiveness of cell signaling pathways during the failed 15-day regrowth of aged skeletal muscle. J Appl Physiol. 2004;96(1):398–404. doi: 10.1152/japplphysiol.00454.2003. [DOI] [PubMed] [Google Scholar]
- 7.Blough ER, Linderman JK. Lack of skeletal muscle hypertrophy in very aged male Fischer 344 x Brown Norway rats. J Appl Physiol. 2000;88(4):1265–1270. doi: 10.1152/jappl.2000.88.4.1265. [DOI] [PubMed] [Google Scholar]
- 8.Degens H, Alway SE. Skeletal muscle function and hypertrophy are diminished in old age. Muscle Nerve. 2003;27(3):339–347. doi: 10.1002/mus.10314. [DOI] [PubMed] [Google Scholar]
- 9.Thomson DM, Gordon SE. Diminished overload-induced hypertrophy in aged fast-twitch skeletal muscle is associated with AMPK hyperphosphorylation. J Appl Physiol. 2005;98(2):557–564. doi: 10.1152/japplphysiol.00811.2004. [DOI] [PubMed] [Google Scholar]
- 10.Zarzhevsky N, Carmeli E, Fuchs D, Coleman R, Stein H, Reznick AZ. Recovery of muscles of old rats after hindlimb immobilisation by external fixation is impaired compared with those of young rats. Exp Gerontol. 2001;36(1):125–140. doi: 10.1016/s0531-5565(00)00189-3. [DOI] [PubMed] [Google Scholar]
- 11.Roy RR, Baldwin KM, Edgerton VR. The plasticity of skeletal muscle: effects of neuromuscular activity. Exerc Sport Sci Rev. 1991;19:269–312. [PubMed] [Google Scholar]
- 12.Booth FW. Regrowth of atrophied skeletal muscle in adult rats after ending immobilization. J Appl Physiol. 1978;44(2):225–230. doi: 10.1152/jappl.1978.44.2.225. [DOI] [PubMed] [Google Scholar]
- 13.Childs TE, Spangenburg EE, Vyas DR, Booth FW. Temporal alterations in protein signaling cascades during recovery from muscle atrophy. Am J Physiol Cell Physiol. 2003;285(2):C391–C398. doi: 10.1152/ajpcell.00478.2002. [DOI] [PubMed] [Google Scholar]
- 14.Hepple RT, Baker DJ, Kaczor JJ, Krause DJ. Long-term caloric restriction abrogates the age-related decline in skeletal muscle aerobic function. Faseb J. 2005;19(10):1320–1322. doi: 10.1096/fj.04-3535fje. [DOI] [PubMed] [Google Scholar]
- 15.Hepple RT, Baker DJ, McConkey M, Murynka T, Norris R. Caloric restriction protects mitochondrial function with aging in skeletal and cardiac muscles. Rejuvenation Res. 2006;9(2):219–222. doi: 10.1089/rej.2006.9.219. [DOI] [PubMed] [Google Scholar]
- 16.Lopez-Lluch G, Hunt N, Jones B, et al. Calorie restriction induces mitochondrial biogenesis and bioenergetic efficiency. Proc Natl Acad Sci U S A. 2006;103(6):1768–1773. doi: 10.1073/pnas.0510452103. [DOI] [PMC free article] [PubMed] [Google Scholar]
- 17.Grindeland RE, Roy RR, Edgerton VR, et al. Interactive effects of growth hormone and exercise on muscle mass in suspended rats. Am J Physiol. 1994;267(1 Pt 2):R316–R322. doi: 10.1152/ajpregu.1994.267.1.R316. [DOI] [PubMed] [Google Scholar]
- 18.Spangenburg EE, Brown DA, Johnson MS, Moore RL. Exercise increases SOCS-3 expression in rat skeletal muscle: potential relationship to IL-6 expression. J Physiol. 2006;572(Pt 3):839–848. doi: 10.1113/jphysiol.2005.104315. [DOI] [PMC free article] [PubMed] [Google Scholar]
- 19.Kubica N, Bolster DR, Farrell PA, Kimball SR, Jefferson LS. Resistance exercise increases muscle protein synthesis and translation of eukaryotic initiation factor 2Bepsilon mRNA in a mammalian target of rapamycin-dependent manner. J Biol Chem. 2005;280:7570–7580. doi: 10.1074/jbc.M413732200. [DOI] [PubMed] [Google Scholar]
- 20.Bolster DR, Kubica N, Crozier SJ, et al. Immediate response of mammalian target of rapamycin (mTOR)-mediated signalling following acute resistance exercise in rat skeletal muscle. J Physiol. 2003;553(Pt 1):213–220. doi: 10.1113/jphysiol.2003.047019. [DOI] [PMC free article] [PubMed] [Google Scholar]
- 21.Turturro A, Witt WW, Lewis S, Hass BS, Lipman RD, Hart RW. Growth curves and survival characteristics of the animals used in the biomarkers of aging program. J Gerontol A Biol Sci Med Sci. 1999;54(11):B492–B501. doi: 10.1093/gerona/54.11.b492. [DOI] [PubMed] [Google Scholar]
- 22.Bodine SC, Stitt TN, Gonzalez M, et al. Akt/mTOR pathway is a crucial regulator of skeletal muscle hypertrophy and can prevent muscle atrophy in vivo. Nat Cell Biol. 2001;3(11):1014–1019. doi: 10.1038/ncb1101-1014. [DOI] [PubMed] [Google Scholar]
- 23.Kimball SR, Farrell PA, Jefferson LS. Invited review: role of insulin in translational control of protein synthesis in skeletal muscle by amino acids or exercise. J Appl Physiol. 2002;93(3):1168–1180. doi: 10.1152/japplphysiol.00221.2002. [DOI] [PubMed] [Google Scholar]
- 24.Harris TE, Lawrence JC. TOR signaling. Sci STKE. 2003;((212)) doi: 10.1126/stke.2122003re15. re15. [DOI] [PubMed] [Google Scholar]
- 25.Marsh DR, Criswell DS, Carson JA, Booth FW. Myogenic regulatory factors during regeneration of skeletal muscle in young, adult, and old rats. J Appl Physiol. 1997;83(4):1270–1275. doi: 10.1152/jappl.1997.83.4.1270. [DOI] [PubMed] [Google Scholar]
- 26.Altun M, Bergman E, Edstrom E, Johnson H, Ulfhake B. Behavioral impairments of the aging rat. Physiol Behav. 2007;92(5):911–923. doi: 10.1016/j.physbeh.2007.06.017. [DOI] [PubMed] [Google Scholar]
- 27.Holloszy JO. Mortality rate and longevity of food-restricted exercising male rats: a reevaluation. J Appl Physiol. 1997;82(2):399–403. doi: 10.1152/jappl.1997.82.2.399. [DOI] [PubMed] [Google Scholar]
- 28.Bodine SC, Latres E, Baumhueter S, et al. Identification of ubiquitin ligases required for skeletal muscle atrophy. Science. 2001;294(5547):1704–1708. doi: 10.1126/science.1065874. [DOI] [PubMed] [Google Scholar]
- 29.Hornberger TA, Hunter RB, Kandarian SC, Esser KA. Regulation of translation factors during hindlimb unloading and denervation of skeletal muscle in rats. Am J Physiol Cell Physiol. 2001;281(1):C179–C187. doi: 10.1152/ajpcell.2001.281.1.C179. [DOI] [PubMed] [Google Scholar]
- 30.Nguyen HX, Tidball JG. Expression of a muscle-specific, nitric oxide synthase transgene prevents muscle membrane injury and reduces muscle inflammation during modified muscle use in mice. J Physiol. 2003;550(Pt 2):347–356. doi: 10.1113/jphysiol.2003.040907. [DOI] [PMC free article] [PubMed] [Google Scholar]
- 31.Tidball JG, Wehling-Henricks M. Macrophages promote muscle membrane repair and muscle fibre growth and regeneration during modified muscle loading in mice in vivo. J Physiol. 2007;578(Pt 1):327–336. doi: 10.1113/jphysiol.2006.118265. [DOI] [PMC free article] [PubMed] [Google Scholar]
- 32.Pistilli EE, Siu PM, Alway SE. Molecular regulation of apoptosis in fast plantaris muscles of aged rats. J Gerontol A Biol Sci Med Sci. 2006;61(3):245–255. doi: 10.1093/gerona/61.3.245. [DOI] [PMC free article] [PubMed] [Google Scholar]
- 33.Leeuwenburgh C, Gurley CM, Strotman BA, Dupont-Versteegden EE. Age-related differences in apoptosis with disuse atrophy in soleus muscle. Am J Physiol Regul Integr Comp Physiol. 2005;288(5):R1288–R1296. doi: 10.1152/ajpregu.00576.2004. [DOI] [PubMed] [Google Scholar]
- 34.Okita M, Yoshimura T, Nakano J, Motomura M, Eguchi K. Effects of reduced joint mobility on sarcomere length, collagen fibril arrangement in the endomysium, and hyaluronan in rat soleus muscle. J Muscle Res Cell Motil. 2004;25(2):159–166. doi: 10.1023/b:jure.0000035851.12800.39. [DOI] [PubMed] [Google Scholar]
- 35.Jarvinen TA, Jozsa L, Kannus P, Jarvinen TL, Jarvinen M. Organization and distribution of intramuscular connective tissue in normal and immobilized skeletal muscles. An immunohistochemical, polarization and scanning electron microscopic study. J Muscle Res Cell Motil. 2002;23(3):245–254. doi: 10.1023/a:1020904518336. [DOI] [PubMed] [Google Scholar]
- 36.Gallegly JC, Turesky NA, Strotman BA, Gurley CM, Peterson CA, Dupont-Versteegden EE. Satellite cell regulation of muscle mass is altered at old age. J Appl Physiol. 2004;97(3):1082–1090. doi: 10.1152/japplphysiol.00006.2004. [DOI] [PubMed] [Google Scholar]
- 37.Merry BJ. Molecular mechanisms linking calorie restriction and longevity. Int J Biochem Cell Biol. 2002;34(11):1340–1354. doi: 10.1016/s1357-2725(02)00038-9. [DOI] [PubMed] [Google Scholar]
- 38.Smith JV, Heilbronn LK, Ravussin E. Energy restriction and aging. Curr Opin Clin Nutr Metab Care. 2004;7(6):615–622. doi: 10.1097/00075197-200411000-00005. [DOI] [PubMed] [Google Scholar]
- 39.Gredilla R, Barja G. Minireview: the role of oxidative stress in relation to caloric restriction and longevity. Endocrinology. 2005;146(9):3713–3717. doi: 10.1210/en.2005-0378. [DOI] [PubMed] [Google Scholar]
- 40.McKiernan SH, Bua E, McGorray J, Aiken J. Early-onset calorie restriction conserves fiber number in aging rat skeletal muscle. Faseb J. 2004;18(3):580–581. doi: 10.1096/fj.03-0667fje. [DOI] [PubMed] [Google Scholar]
- 41.Payne AM, Dodd SL, Leeuwenburgh C. Life-long calorie restriction in Fischer 344 rats attenuates age-related loss in skeletal muscle-specific force and reduces extracellular space. J Appl Physiol. 2003;95(6):2554–2562. doi: 10.1152/japplphysiol.00758.2003. [DOI] [PubMed] [Google Scholar]
- 42.Spindler SR. Calorie restriction enhances the expression of key metabolic enzymes associated with protein renewal during aging. Ann N Y Acad Sci. 2001;928:296–304. doi: 10.1111/j.1749-6632.2001.tb05659.x. [DOI] [PubMed] [Google Scholar]
- 43.Park SK, Prolla TA. Lessons learned from gene expression profile studies of aging and caloric restriction. Ageing Res Re. 2005;4(1):55–65. doi: 10.1016/j.arr.2004.09.003. [DOI] [PubMed] [Google Scholar]
- 44.Weindruch R, Kayo T, Lee CK, Prolla TA. Microarray profiling of gene expression in aging and its alteration by caloric restriction in mice. J Nutr. 2001;131(3):918S–923S. doi: 10.1093/jn/131.3.918S. [DOI] [PubMed] [Google Scholar]
- 45.Sreekumar R, Unnikrishnan J, Fu A, et al. Effects of caloric restriction on mitochondrial function and gene transcripts in rat muscle. Am J Physiol Endocrinol Metab. 2002;283(1):E38–E43. doi: 10.1152/ajpendo.00387.2001. [DOI] [PubMed] [Google Scholar]
- 46.Bolster DR, Jefferson LS, Kimball SR. Regulation of protein synthesis associated with skeletal muscle hypertrophy by insulin-, amino acid- and exercise-induced signalling. Proc Nutr Soc. 2004;63(2):351–356. doi: 10.1079/PNS2004355. [DOI] [PubMed] [Google Scholar]
- 47.Parkington JD, LeBrasseur NK, Siebert AP, Fielding RA. Contraction-mediated mTOR, p70S6K, and ERK 1/2 phosphorylation in aged skeletal muscle. J Appl Physiol. 2004;97:243–248. doi: 10.1152/japplphysiol.01383.2003. [DOI] [PubMed] [Google Scholar]
- 48.Funai K, Parkington JD, Carambula S, Fielding RA. Age-associated decrease in contraction-induced activation of downstream targets of Akt/mTor signaling in skeletal muscle. Am J Physiol Regul Integr Comp Physiol. 2006;290(4):R1080–R1086. doi: 10.1152/ajpregu.00277.2005. [DOI] [PubMed] [Google Scholar]
- 49.Thomson DM, Gordon SE. Impaired overload-induced muscle growth is associated with diminished translational signalling in aged rat fast-twitch skeletal muscle. J Physiol. 2006;574(Pt 1):291–305. doi: 10.1113/jphysiol.2006.107490. [DOI] [PMC free article] [PubMed] [Google Scholar]