

Abstract
The number of human cases of several climate-related infectious diseases, including tick- and mosquito-borne diseases, has increased in Canada and other parts of the world since the end of the last century. Predicting and mapping the risks associated with these diseases using environmental and climatic determinants derived from satellite images is an emerging method that can support research, surveillance, prevention and control activities and help to better assess the impacts of climate change in Canada. Earth observation images can be used to systematically monitor changes in the Earth’s surface and atmosphere at different scales of time and space. These images can inform estimation and monitoring of environmental and climatic determinants, and thus disease prediction and risk mapping. The current array of Earth observation satellites provides access to a large quantity and variety of data. These data have different characteristics in terms of spatial, temporal and thematic precision and resolution. The objectives of this overview are to describe how Earth observation images may inform risk assessment and mapping of tick-borne and mosquito-borne diseases in Canada, their potential benefits and limitations, the implications and next steps.
Keywords: Earth observation images, climate change, risk mapping, infectious diseases, tick-borne diseases, mosquito-borne diseases, remote sensing, environmental determinants, climatic determinants, Canada
Introduction
Climate change has resulted in rising temperatures and ocean levels, increased climatic variability, and changes in the frequency and intensity of precipitation (1,2). Evidence of climate change started in Canada in the 1950s (3–6) and the average temperature has increased more than 1.5°C between 1950 and 2010—almost double the global average (7). The extent of this change has varied by region, with the most significant changes occurring in northern Canada and especially in the Arctic (8). The average humidity levels in Canada have also increased, with an average increase in precipitation of about 12% (8). These trends are likely to continue, with an increase in the intensity and frequency in extreme weather events such as heat waves, droughts, floods and forest fires (5,6,8–10). Urbanization, and its creation of heat islands, has contributed to these climate changes (11).
Climate has a direct impact on the movements of human populations and infectious disease vectors, such as ticks and mosquitoes, and their host populations (12,13). Increased temperature and climate variability are leading to an increase and geographic expansion of vector populations and the diseases that they transmit (1,7,11,14–22). The northern expansion of ticks, for example, has been demonstrated in numerous studies and has been associated with a steady increase in the number of human cases of Lyme disease (23–25). One study predicted that West Nile virus is likely to increase more than 17-fold by 2050 (26). With the northward expansion of the Aedes albopictus mosquito in the United States (US) (27,28), North America may be at risk for exotic mosquito-borne diseases (MBDs) such as dengue, Zika, yellow fever and chikungunya viruses. Other tick-borne diseases (TBDs) and MBDs are likely to increase or emerge in Canada as global warming occurs (26,27,29–31).
In light of the interplay between climate change and vector-borne diseases, it is increasingly important to be able to measure changes in temperature, precipitation and other variables related to habitat. Canada is a huge country, and current surveillance strategies are not designed to monitor the impact of climate change on the geographic spread of TBDs and MBDs. Earth observation tools are increasingly being used to increase our capacity to do so. Earth observation refers to the acquisition, processing, analysis, interpretation and dissemination of physical, chemical and biological information on land, oceans and the atmosphere by using satellite, airborne or in situ remote sensing sensors. Remote sensing technologies, which measure the properties of an object by means of electromagnetic waves, can be used in combination with many other terrestrial sensors, such as weather stations and balloon-probes (32).
This overview focuses on Earth observation images acquired by remote sensing satellites. Earth observation images and their derivatives provide data related to temperature, precipitation, humidity, forest, wetlands, agriculture, built environments and more. A number of studies have demonstrated the effectiveness of Earth observation images and their derivatives for risk assessment and mapping of TBDs and MBDs around the world. The Malaria Atlas Project (MAP) (33,34), the Epidemic Prognosis Incorporating Disease and Environmental Monitoring for Integrated Assessment (EPIDEMIA) (35) and the Mapping Malaria Risk in Africa (MARA) (36,37) are examples of monitoring programs based on the use of Earth observation images and their derivatives. In light of this, the use of Earth observation images to track TBDs and MBDs, and assess the geographic and climactic conditions for their spread, has been applied in Canada. The objectives of this overview are to describe how Earth observation image may inform risk assessment and mapping for the surveillance of TBD and MBD in Canada; summarize their potential benefits and limitations and identify the implications and next steps.
Earth observation images for risk assessment and mapping
Earth observation images are obviously not used to directly observe ticks and mosquitoes inside their habitats. Instead, Earth observation images are used to derive data on variables and indicators that serve to characterize the environmental and climatic determinants (ECD) that influence the presence and the development of ticks and mosquitoes. The ECD data is derived from Earth observation images through several processing and analyses methods, including geometric, radiometric and atmospheric corrections and image classification analyses. The resultant ECDs include surface temperature, air temperature, soil moisture, surface moisture, atmospheric water vapor, air humidity, amount of precipitation, topography, snow cover and thickness, soil type, vegetation type and density, vegetation indices, flooded areas, wetlands, water quality parameters (such as chlorophyll concentration, dissolved organic matter, suspended sediments, color, salinity), forests, urban and built-up areas and agricultural areas (33,38–40). Thus, many ECDs derived from Earth observation images are important determinants of TBDs and MBDs vectors survival and abundance. Table 1 lists some of the most commonly used Earth observation satellites, their sensors, and their derivatives.
Table 1. In-operation open access Earth observation images and their derivative environmental and climatic determinants.
| Satellite name |
Sensor | Spatial Res |
Temp Res |
Derivative environmental and climatic determinants | ||||||||||
|---|---|---|---|---|---|---|---|---|---|---|---|---|---|---|
| Land cover |
Soil type |
Veg type |
Veg quantity |
Snow cover depth |
Water quality |
Surface humidity |
Surface Temp° |
Air Temp° |
Water vapour |
Prec | ||||
| Aqua | AIRS | 2.3–41 km | 0.5 day | - | - | - | - | - | - | - | Y | Y | - | - |
| DMSP | SSM/I | 13–69 km | 1 day | - | - | - | - | Y | - | - | - | - | Y | Y |
| GCOM-W1 | AMSR-2 | 3–62 km | 1 day | - | - | - | - | Y | Y | - | - | - | Y | Y |
| GPM | DPR | 5 km | 1–2 hours | - | - | - | - | - | - | - | - | - | - | Y |
| GPM | GMI | 4–32 km | 1–2 hours | - | - | - | - | - | - | - | Y | - | Y | Y |
| Landsat-5 | TM | 30–120 m | 16 days | Y | Y | Y | Y | Y | - | Y | Y | - | - | - |
| Landsat-7 | ETM+ | 15–60 m | 16 days | Y | Y | Y | Y | Y | - | Y | Y | - | - | - |
| Landsat-8 | OLI | 15–30 m | 16 days | Y | Y | Y | Y | Y | - | - | - | - | - | - |
| Landsat-8 | TIRS | 100 m | 8 days | - | - | - | - | - | - | - | Y | - | Y | - |
| MSG | SEVIRI | 1–4.8 km | 15 min | - | - | - | Y | - | - | Y | Y | - | Y | Y |
| NOAA 15-19 | AVHRR/3 | 1.1 km | 0.5 day | Y | - | - | Y | Y | - | Y | Y | - | Y | - |
| Sentinel-1 | C-SAR | 5–100 m | 12 days | Y | - | Y | Y | Y | - | - | - | - | - | - |
| Sentinel-2 | MSI | 10–60 m | 5 days | Y | Y | Y | Y | Y | - | - | - | - | - | - |
| Sentinel-3 | OLCI | 300 m | 2 days | Y | - | - | Y | - | Y | - | - | - | - | - |
| Sentinel-3 | SLSTR | 500–1000 m | 1–4 days | - | - | - | Y | Y | - | - | Y | - | - | - |
| SMAP | MWR | 40 km | 1.5 days | - | - | - | - | - | Y | Y | - | - | - | - |
| SNPP | ATMS | 16–75 km | 0.5 day | - | - | - | - | - | - | Y | - | Y | - | - |
| SNPP | VIIRS | 375–750 m | 6 min | - | - | - | Y | Y | - | Y | Y | - | Y | - |
| Terra | ASTER | 15–90 m | 5 days | Y | Y | - | Y | Y | - | - | Y | - | Y | - |
| Terra, Aqua | MODIS | 250–1000 m | 5 min | Y | Y | Y | Y | Y | Y | Y | Y | Y | Y | - |
Abbreviations: min, minutes; Prec, precipitation; Res, resolution, Temp, temperature; Veg, vegetation; Y, images acquired by the satellite/sensor system; -, not applicable
Satellite names: DMSP, Defense Meteorological Satellite Program; GCOM, Global Change Observation Mission; GPM, Global Precipitation Measurement Mission; MSG, Meteosat Second Generation; NOAA, National Oceanic and Atmospheric Administration; SMAP, Soil Moisture Active Passive; SNPP, Suomi National Polar-orbiting Partnership Satellite
Sensor names: AIRS, Atmospheric Infrared Sounder; AMSR, Advanced Microwave Scanning Radiometer; ASTER, Advanced Spaceborne Thermal Emission and Reflection radiometer; ATMS, Advanced Technology Microwave Sounder; AVHRR, Advanced Very High Resolution Radiometer; C-SAR, C-band Synthetic Aperture Radar; DPR, Dual-frequency Precipitation Radar; ETM+, Enhanced Thematic Mapper Plus; GMI, Global Precipitation Measurement (GPM) Microwave Imager; MODIS, Moderate Resolution Imaging Spectroradiometer; MSI, Multispectral Imager; MWR, Microwave (MW) radiometer; OLCI, Ocean and Land Colour Instrument; OLI, Operational Land Imager; SEVIRI, Spinning Enhanced Visible and Infrared Imager; SLSTR, Sea and Land Surface Temperature Radiometer; SSM/I, Special Sensor Microwave Imager; TIRS, Thermal Infrared Sensor; TM, Thematic Mapper; VIIRS, Visible Infrared Imaging Radiometer Suite (41–48)
Mosquito-borne diseases
Environmental and climatic determinants of MBDs include both anthropogenic environments (such as urban, peri-urban and rural areas) and natural environments (such as forests and wetlands) (7,17,49–52). The ECDs include climatic and microclimatic factors that are known to affect the spread of mosquito-borne disease, such as temperature, humidity and precipitation (17,20,52–54). There are also specific ECDs for specific mosquito species. Some species, such as Aedes albopictus (that spreads dengue, chikungunya and Zika viruses) or Culex pipiens (that spreads West Nile virus), are highly adapted to urban environments. Other species, such as Culiseta melanura (that spreads Eastern equine encephalitis), are specific to natural wetlands and are found only in rural areas.
Tick-borne diseases
The ECDs of tick-borne diseases also vary by species. The Lyme disease vector, Ixodes scapularis, has evolved within temperate forest biomes (mixed hardwood) in North America, while the Powassan virus vector, Ixodes cookei, lives primarily in burrows and more rarely on vegetation. Historically, changes in the distribution of various types of habitat and host species have been associated with changes in the distribution and abundance of ticks (55). Tick-borne disease ECD include the type and density of forest cover and degree of forest fragmentation, as well as the prevailing temperature and humidity conditions in the forest habitats (12,13,17,56–63).
Risk assessment
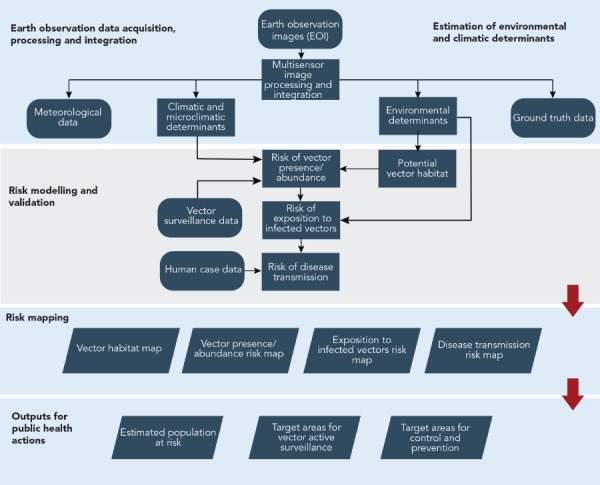
The ECDs derived from Earth observation images have been used to assess the risks associated with different climate-related diseases (49,50,52,64–69). The possibility of human infection depends on a series of risks: the risk that the relevant vectors are present in the environment; the risk that those vectors are infected with a pathogen; the risk that human populations are exposed to those infected vectors; and the risk of disease transmission. The ECDs, derived from Earth observation image, combined with surveillance data, are used to assess, model and map these different risk components. Earth observation images and their derivatives can be used to map risk on a regular basis once the risk model based on those data has been developed and validated.
The most common use of Earth observation images for risk assessment and mapping is that of environmental risk associated with the presence or abundance of ticks and mosquitoes. The ECDs derived from Earth observation images can also be combined with human case data to directly assess and map the risk of disease transmission. Figure 1 presents an example of an Earth observation-informed operational framework that can be used for climate-related infectious diseases risk assessment and mapping.
Figure 1. Earth observation-informed operational framework for climate-related infectious diseases risk assessment and mapping.
Benefits and limitations
The use of Earth observation images and their derivatives to estimate ECDs and to map the risk of transmission of climate-related infectious diseases combines numerous advantages that cannot be matched by any other types of data (17,22,70,71). There are at least five potential benefits of using Earth observation images to inform public health risk assessment for vector-borne diseases in Canada.
First, Canada is a vast country that is not currently covered by field observation data use in traditional surveillance methods (e.g. trapping and analyzing density and type of mosquitoes or mapping out tick habitat by checking for ticks). These traditional surveillance data generally cover only a limited number of surveillance sites, which are unevenly distributed across provinces. In contrast, the Earth observation images cover continuous surfaces of the country, where each point of the observed territory is a “surveillance site”. In addition, these images can cover large geographic areas such as Canada in a timeframe (minutes, hours and days, depending on the satellite used) that cannot be achieved by traditional surveillance methods.
Second, Canada has many remote regions that are difficult to access. These regions are covered by Earth observation images in the same way as the rest of the country. This offers the unique advantage of being able to continuously monitor even the more remote regions. This is particularly important in Canada, as some of these remote regions, such as the Arctic, are being disproportionately affected by climate change.
Third, in a related benefit, the use of Earth observation images would address the high cost of active surveillance over a large geographical area. Earth observation images acquired by multiple satellites are freely accessible via open data platforms or are accessible at low-cost. In Canada, there is a large amount of ready-to-use Earth observation image derivative data. These data are produced by federal departments, such as Agriculture and Agri-Food Canada, Natural Resources Canada and Environment and Climate Change Canada. They are freely available via the open government web site (https://open.canada.ca/en/open-data).
Fourth, active surveillance methods and protocols vary according to projects, years, programs and jurisdictions. This variability renders it difficult to make comparisons by time and place. In contrast, the Earth observation images are acquired on a standardised and regular basis. This enables comparisons of signal detections (e.g. abnormal situations and alerts) in a more efficient manner across the country.
Fifth, Earth observation satellites can be mobilized quickly to support real-time emergency operations in the event of major disasters that pose public health risks. For example, in the case of flooding, Earth observation images can be used to delineate and monitor risk areas where mosquito-control activities may be needed. The International Charter on Space and Major Disasters (72) was established to facilitate the mobilization of Earth observation satellites from various space agencies to support emergency operations related to major disasters. This charter was first activated for an infectious disease event during the Ebola outbreak in West Africa in 2014 (73). The benefits of using Earth observation images and their derivatives are summarized in Table 2.
Table 2. Advantages of using Earth observation images in the estimation of environmental and climatic determinants and risk mapping of climate-related infectious diseases.
| Advantage | Description |
|---|---|
| Accurate, regular measurements at different spatial and temporal resolutions | Compared with data acquired on the ground, the homogeneity and regularity of observations made using Earth observation images permit more accurate measurement of changes occurring over time, such as environmental and climatic changes. These measurements are made at different spatial and temporal resolutions which allow for the observation of phenomena (e.g. vector habitats, microclimatic conditions) and their changes according to a varied spectrum of measurement scales ranging from 0.31 m to over 75 km, and temporal observation frequencies ranging from 5 minutes to 16 days. This multi-scale observation capacity offered by Earth observation images is unique and makes it possible to estimate ECD and to map risk on local, regional and global scales according to the public health objectives. |
| High spatial density of observations, combined with coverage of vast territories, remote regions and areas difficult to access | The measurements made using Earth observation images are continuous data covering the entire geographic area covered by the sensor. ECDs can be estimated and low-risk or high-risk areas identified for any part of the territory. Earth observation image cover immense territories that cannot be sampled with ground data. Most Earth observation satellites can pick up images covering the entire planet, including remote regions and geographic areas difficult to access. This is very useful in supporting public health initiatives that target remote communities. |
| Recurrence of observations over a long period | Earth observation images have been acquired recurrently for nearly 40 years. The observation capacity for any given territory over long periods offers a great opportunity to study and predict the impact of climate change on the emergence and re-emergence of climate-related diseases. |
| Ready-to-use Earth observation image derivatives | Many ready-to-use products have been developed from Earth observation images to make these data accessible to a broader community of persons not expert in the processing and analysis of Earth observation images. These products relate to both environmental determinants and climatic determinants. |
| Low-cost access to vast amounts of data | There are over 1,700 Earth observation satellites in operation (74). Earth observation images from many of these satellites are accessible free of charge via open data platforms, as are the majority of Earth observation image derivatives. The majority of commercial Earth observation images involve data with very high spatial resolution (less than 2 m). Costs associated with these data are dropping quickly with the increase in Earth observation systems and the improvement of their performance. |
| Speed of mobilization of many satellites to support emergency operations | Under the International Charter on Space and Major Disasters (72), satellites and services can be rapidly mobilized by numerous space agencies to support the management of emergencies in major disaster zones. They offer the ability to quickly assess risks of epidemics in these zones in a context where the number of major disasters is rising with climate change. The Charter has been operational since the year 2000. It was activated to support responses related to the outbreak of the Ebola virus in West Africa in 2014 (73). This marked the first time the Charter was activated for the management of an infectious disease. |
Abbreviation: ECD, environmental and climatic determinants
Limitations
There are a number of limitations to consider with the use of Earth observation images and their derivatives.
First, Earth observation image derivatives were originally developed for other fields of application, including agriculture, forestry, and nature conservation and these data quality indicators were primarily intended to respond to the application objectives for which they were created. This means there is a lack of specific Earth observation image derivatives developed for targeted infectious diseases like TBDs and MBDs. As a result, several data quality indicators (geographic coverage, spatial resolution, temporal resolution, temporal aggregation scale, update frequency, archiving period, composition of thematic classes, and data accuracy) of common Earth observation images and their derivatives do not meet data quality criteria needed for the estimation of ECDs associated to climate-related infectious diseases.
Second, the most used Earth observation images for the estimation of climatic and microclimatic determinants rarely have both high spatial and temporal resolution. For example, surface temperature and soil moisture can vary a good deal by place and over time. The Earth observation images that are used to calculate them do not allow for the combination of a high spatial resolution (less than 30 m) with a high temporal resolution (less than one day) (17,68,75); however, this combination is necessary to characterize the dynamics of the microclimatic conditions and vectors’ microhabitats. Thus, these data do not always allow for control and prevention activities at a local scale (e.g. for a municipality).
Third, the use of Earth observation images and their derivatives to estimate ECDs on a fine scale and to produce risk maps over long periods and over large geographic areas generates a huge amount of data. The classic methods and technologies used for processing, analyzing, storage and management of such big data are currently limited.
These and other limitations associated with the use of Earth observation images and their derivatives are summarized in Table 3.
Table 3. Limitations associated with the use of Earth observation images and their derivatives.
| Limitation | Description |
|---|---|
| Coarse spatial resolution | The spatial resolution expresses the size of the smallest detail that can be observed in the image. A spatial resolution less than 30 m is generally recommended for mapping applications on a local scale. Earth observation images and their derivatives relating to climatic and microclimatic determinants have generally a coarse spatial resolution (more than 1000 m). |
| Low temporal resolution | Temporal resolution expresses the temporal frequency at which a satellite acquires Earth observation images for a same area. Bimonthly temporal resolution (16 days) is appropriate for Earth observation images used to estimate land cover environmental determinants. For Earth observation images that are used to estimate microclimatic determinants, a temporal resolution that can serve to establish daily averages would be more appropriate. However, commonly used free-access Earth observation images with a high spatial resolution (e.g. Landsat-8 images) do not have this temporal resolution. |
| Unknown or low accuracy | Climate change projections indicate temperature increases of 1°C to over 5°C in high latitudes, from the 1950s (76,77). An uncertainty below 1°C would be appropriate for Earth observation images and their derivatives related to temperature. Metadata of numerous Earth observational image derivatives do not indicate their accuracy, and the accuracy within any given Earth observation image derivatives can be highly variable and is generally not available. |
| Incomplete land cover classes composition | An Earth observation image derivative of environmental determinants must contain all the land cover classes representing environmental determinants of interest. However, the composition of land cover classes of a given Earth observation image derivative depends on its producer and the objectives of creating it. And, there is not a specifically-developed Earth observation image derivative to estimate all the ECDs of every climate-related infectious disease. |
| Inappropriate temporal aggregation scale | Temporal aggregation scale is the time step that is used to aggregate multi-temporal data. The aggregation scales that are mostly used for Earth observation image derivatives are daily, weekly, monthly and annual averages. The temporal aggregation scale to be used will depend on the vectors of the disease. The lifecycle of MBD vectors is very short (a few days to a few months), compared with that of TBD vectors (several years). A weekly scale is more appropriate in the first case and an annual scale in the second. However, for some ECDs, there are no Earth observation image derivatives with the target temporal aggregation scales (e.g. annual accumulation of surface degree-days, derived from land surface temperature images). |
| Long periods between updates | An annual update frequency is generally appropriate for Earth observation image derivatives used to estimate environmental determinants. However, several of these products are not updated annually. |
| Short archiving period | A relatively long archiving period—more than 15 or 30 years—may be necessary to study the evolution of infectious disease risks in the context of climate change. However, the archiving period of several Earth observation images and their derivatives is not long enough to study the impact of climate change on infectious diseases. |
| Incomplete geographic coverage | Risk assessment and risk mapping of infectious disease at borders often requires data covering several different administrative areas (e.g. Quebec/Ontario; Canada/United States). |
| Traditional methods and tools not adapted for massive Earth observation image data | An Earth observation image dataset covering a huge country like Canada, with a high spatial resolution, a high temporal resolution, frequent updates, and a long archiving period, will generate massive data for whose traditional methods and tools for Earth observation image data processing and management are not appropriate. |
Abbreviations: ECD, environmental and climatic determinants; MBD, mosquito-borne diseases; TBD, tick-borne diseases
Discussion
Climate change is facilitating the emergence and re-emergence of tick-borne and mosquito-borne diseases in Canada. The use of ECDs derived from Earth observation images makes it possible to map the geographic expansion of these vectors and assess their disease risks. Currently, Earth observation images can cover all the urban, rural and remote regions of Canada in a standardized way on a regular basis at various spatial and temporal resolutions. However, the accuracy of Earth observation image derivatives is often not well known.
The accuracy of a risk mapping depends largely on the quality of the data used to model the risk and to produce the risk map. Improvements are being developed to derive better quality Earth observation image derivatives. For example, Earth observation images with different characteristics (including spatial resolution and spectral bands) have been combined via image fusion or downscaling methods to produce value-added Earth observation image derivatives that can meet the quality criteria required to estimate ECDs. For example, when land surface temperature (LST) images from Landsat-8’s Thermal Infrared Sensor (100 m, 16 days) are combined with LST images from the Moderate Resolution Imaging Spectroradiometer (MODIS) (1000 m, 5 minutes), 8-day averages of LST images can be derived with a spatial resolution of 100 m (78). Using multisensor or multiproduct data combination, there are almost infinite possibilities for the estimation of ECDs and climate-related infectious diseases risk assessment and mapping in a context of rapid environmental change and increased climatic variability. Also, there is a need to apply artificial intelligence approaches to processing and analyzing the big data derived from combining data from multiple satellites. By doing so, it would be possible to create an Earth observation-informed operational framework for rapid risk assessment and mapping (EO-OFRAM) of climate-related infectious diseases. Such a platform would be fully automated and have an easy-to-use user interface that integrates monitoring data and other contextual data, and could be used to answer questions, visualize responses on maps, and produce status reports to inform public health action.
The authors are currently working with their academic and governmental partners to develop improved microclimatic indicators, vector microhabitat indicators and a data integration and fusion system. These innovative tools will improve the accuracy of ECDs estimation and support dynamic multi-scale risk assessment and risk mapping of climate-related infectious diseases via the EO-OFRAM. Under the Innovative Solutions Canada Program, the Public Health Agency of Canada has issued a challenge to industry regarding the processing and analysis of big data (79). Better processing and analysis of big data, including the application of innovative machine learning techniques (a subset of artificial intelligence), will enable the better use of the large volume of data produced by Earth observation images. The application of an artificial intelligence-enabled EO-OFRAM in public health depends on its effectiveness in assessing risk in different environments and at different levels of decision-making (local, provincial/territorial and national). The creation of an EO-OFRAM aims to equip and optimize monitoring as well as control and prevention activities at these three levels of governance. The major challenges of such an initiative are funding, the participation of public health from different levels of government and the development of common standards.
Conclusion
The risks associated with emerging climate-related infectious diseases are highly variable for different geographic regions over time. Earth observation images and their derivatives offer numerous advantages for characterizing this heterogeneity through the estimation of the environmental and climatic determinants and the mapping of climate-related infectious disease risks. With the development and application of improved approaches to process and analyze big data derived from Earth observation images, including machine learning, as well as the development of vector microhabitat and microclimatic indicators, the determinants derived from these Earth observation images offer some innovative tools to advance our risk modelling and mapping capacity to better support public health action again vector-borne diseases.
Footnotes
Conflict of interest: None.
Funding: This work was supported by the Public Health Agency of Canada and the Canadian Space Agency.
References
- 1.Luber G, Prudent N. Climate change and human health. Trans Am Clin Climatol Assoc 2009;120:113–7. [PMC free article] [PubMed] [Google Scholar]
- 2.Prudent N, Houghton A, Luber G. Assessing climate change and health vulnerability at the local level: travis County, Texas. Disasters 2016. Oct;40(4):740–52. 10.1111/disa.12177 [DOI] [PubMed] [Google Scholar]
- 3.Warren FJ, Lemmen DS, editors. Canada in a Changing Climate: Sector Perspectives on Impacts and Adaptation. Ottawa (ON): Government of Canada; 2014. 286 p. www.nrcan.gc.ca/sites/www.nrcan.gc.ca/files/earthsciences/pdf/assess/2014/pdf/Full-Report_Eng.pdf [Google Scholar]
- 4.Du X, Shrestha NK, Wang J. Assessing climate change impacts on stream temperature in the Athabasca River Basin using SWAT equilibrium temperature model and its potential impacts on stream ecosystem. Sci Total Environ 2019. Feb;650(Pt 2):1872–81. 10.1016/j.scitotenv.2018.09.344 [DOI] [PubMed] [Google Scholar]
- 5.Statistics Canada. Human Activity and the Environment: Annual Statistics 2007 and 2008. Section 1: Climate change in Canada. Ottawa (ON): StatsCan; 2016. (Accessed 2019-02-25) https://www150.statcan.gc.ca/n1/pub/16-201-x/2007000/10542-eng.htm
- 6.Lemmen DS, Warren FJ, Lacroix J, Bush E, editors. From Impacts to Adaptation: Canada in a Changing Climate 2008. Ottawa (ON): Government of Canada; 2018. 448 p. (Accessed 2019-02-25) www.nrcan.gc.ca/environment/resources/publications/impacts-adaptation/reports/assessments/2008/10253
- 7.Ogden NH. Vector-borne disease, climate change and urban design. Can Commun Dis Rep 2016. Oct;42(10):202. 10.14745/ccdr.v42i10a04 [DOI] [PMC free article] [PubMed] [Google Scholar]
- 8.Zhang L, Zhao Y, Hein-Griggs D, Barr L, Ciborowski JJ. Projected extreme temperature and precipitation of the Laurentian Great Lakes Basin. Global Planet Change 2019;172:325–35. 10.1016/j.gloplacha.2018.10.019 [DOI] [Google Scholar]
- 9.Zhang L, Zhao Y, Hein-Griggs D, Ciborowski JJ. Projected monthly temperature changes of the Great Lakes Basin. Environ Res 2018. Nov;167:453–67. 10.1016/j.envres.2018.08.017 [DOI] [PubMed] [Google Scholar]
- 10.Waits A, Emelyanova A, Oksanen A, Abass K, Rautio A. Human infectious diseases and the changing climate in the Arctic. Environ Int 2018. Dec;121(Pt 1):703–13. 10.1016/j.envint.2018.09.042 [DOI] [PubMed] [Google Scholar]
- 11.Mathieu K, Karmali M. Vector-borne diseases, climate change and healthy urban living: next steps. Can Commun Dis Rep 2016. Oct;42(10):219–21. 10.14745/ccdr.v42i10a13 [DOI] [PMC free article] [PubMed] [Google Scholar]
- 12.Simon JA, Marrotte RR, Desrosiers N, Fiset J, Gaitan J, Gonzalez A, Koffi JK, Lapointe FJ, Leighton PA, Lindsay LR, Logan T, Milord F, Ogden NH, Rogic A, Roy-Dufresne E, Suter D, Tessier N, Millien V. Climate change and habitat fragmentation drive the occurrence of Borrelia burgdorferi, the agent of Lyme disease, at the northeastern limit of its distribution. Evol Appl 2014. Aug;7(7):750–64. 10.1111/eva.12165 [DOI] [PMC free article] [PubMed] [Google Scholar]
- 13.Brownstein JS, Skelly DK, Holford TR, Fish D. Forest fragmentation predicts local scale heterogeneity of Lyme disease risk. Oecologia 2005. Dec;146(3):469–75. 10.1007/s00442-005-0251-9 [DOI] [PubMed] [Google Scholar]
- 14.Ogden NH, Bigras-Poulin M, O’Callaghan CJ, Barker IK, Lindsay LR, Maarouf A, Smoyer-Tomic KE, Waltner-Toews D, Charron D. A dynamic population model to investigate effects of climate on geographic range and seasonality of the tick Ixodes scapularis. Int J Parasitol 2005. Apr;35(4):375–89. 10.1016/j.ijpara.2004.12.013 [DOI] [PubMed] [Google Scholar]
- 15.Clow KM, Leighton PA, Ogden NH, Lindsay LR, Michel P, Pearl DL, Jardine CM. Northward range expansion of Ixodes scapularis evident over a short timescale in Ontario, Canada. PLoS One 2017. Dec;12(12):e0189393. 10.1371/journal.pone.0189393 [DOI] [PMC free article] [PubMed] [Google Scholar]
- 16.Bouchard C, Beauchamp G, Nguon S, Trudel L, Milord F, Lindsay LR, Bélanger D, Ogden NH. Associations between Ixodes scapularis ticks and small mammal hosts in a newly endemic zone in southeastern Canada: implications for Borrelia burgdorferi transmission. Ticks Tick Borne Dis 2011. Dec;2(4):183–90. 10.1016/j.ttbdis.2011.03.005 [DOI] [PubMed] [Google Scholar]
- 17.Kotchi SO, Brazeau S, Ludwig A, Aube G, Berthiaume P. Earth Observation and Indicators Pertaining to Determinants of Health – An Approach to Support Local Scale Characterization of Environmental Determinants of Vector-Borne Diseases. In: Ouwehand L, editor. Proceedings of Living Planet Symposium 2016; 2016 May 9–13; Prague, Czech Republic. Noordwijk (The Netherlands): ESA Communications; 2016. http://lps16.esa.int/
- 18.Karmali M, Weinstock D. Introduction to emerging vector-borne disease and cities workshop proceedings. Can Commun Dis Rep 2016. Oct;42(10):197. 10.14745/ccdr.v42i10a01 [DOI] [PMC free article] [PubMed] [Google Scholar]
- 19.Kulkarni MA. Global spread and impacts of emerging vector-borne diseases. Can Commun Dis Rep 2016. Oct;42(10):198–9. 10.14745/ccdr.v42i10a02 [DOI] [PMC free article] [PubMed] [Google Scholar]
- 20.Berrang-Ford L, Harper SL, Eckhardt R. Vector-borne diseases: reconciling the debate between climatic and social determinants. Can Commun Dis Rep 2016. Oct;42(10):211–2. 10.14745/ccdr.v42i10a09 [DOI] [PMC free article] [PubMed] [Google Scholar]
- 21.Savić S, Vidić B, Grgić Z, Potkonjak A, Spasojevic L. Emerging Vector-Borne Diseases - incidence through vectors. Front Public Health 2014. Dec;2:267. 10.3389/fpubh.2014.00267 [DOI] [PMC free article] [PubMed] [Google Scholar]
- 22.Brazeau S, Kotchi SO, Ludwing A, Turgeon P, Petcat Y, Aube G, Ogden NH. Tele-Epidemiology and Public Health in the Canadian Context. In: Ouwehand L, editor. Proceedings of Living Planet Symposium 2016; 2016 May 9–13; Prague, Czech Republic. Noordwijk (The Netherlands): ESA Communications; 2016. http://lps16.esa.int/
- 23.Government of Canada. 2019. Surveillance of Lyme disease. Ottawa (ON): PHAC; 2018. (Accessed 2019-02-26) www.canada.ca/en/public-health/services/diseases/lyme-disease/surveillance-lyme-disease.html
- 24.Ogden NH, Koffi JK, Lindsay LR, Fleming S, Mombourquette DC, Sanford C, Badcock J, Gad RR, Jain-Sheehan N, Moore S, Russell C, Hobbs L, Baydack R, Graham-Derham S, Lachance L, Simmonds K, Scott AN. Surveillance for Lyme disease in Canada, 2009 to 2012. Can Commun Dis Rep 2015. Jun;41(6):132–45. 10.14745/ccdr.v41i06a03 [DOI] [PMC free article] [PubMed] [Google Scholar]
- 25.Gasmi S, Ogden NH, Lindsay LR, Burns S, Fleming S, Badcock J, Hanan S, Gaulin C, Leblanc MA, Russell C, Nelder M, Hobbs L, Graham-Derham S, Lachance L, Scott AN, Galanis E, Koffi JK. Surveillance for Lyme disease in Canada: 2009-2015. Can Commun Dis Rep 2017. Oct;43(10):194–9. 10.14745/ccdr.v43i10a01 [DOI] [PMC free article] [PubMed] [Google Scholar]
- 26.Chen CC, Jenkins E, Epp T, Waldner C, Curry PS, Soos C. Climate change and West Nile virus in a highly endemic region of North America. Int J Environ Res Public Health 2013. Jul;10(7):3052–71. 10.3390/ijerph10073052 [DOI] [PMC free article] [PubMed] [Google Scholar]
- 27.Ludwig A, Zheng H, Vrbova L, Drebot MA, Iranpour M, Lindsay LR. Increased risk of endemic mosquito-borne diseases in Canada due to climate change. Can Commun Dis Rep 2019;45(4):91–7. 10.14745/ccdr.v45i04a03 [DOI] [PMC free article] [PubMed] [Google Scholar]
- 28.Armstrong PM, Andreadis TG, Shepard JJ, Thomas MC. Northern range expansion of the Asian tiger mosquito (Aedes albopictus): analysis of mosquito data from Connecticut, USA. PLoS Negl Trop Dis 2017. May;11(5):e0005623. 10.1371/journal.pntd.0005623 [DOI] [PMC free article] [PubMed] [Google Scholar]
- 29.Bouchard C, Dibernardo A, Koffi J, Wood H, Leighton PA, Lindsay LR. Increased risk of tick-borne diseases with climate and environmental changes. Can Commun Dis Rep 2019;45(4):83–9. 10.14745/ccdr.v45i04a02 [DOI] [PMC free article] [PubMed] [Google Scholar]
- 30.Sonenshine DE. Range Expansion of Tick Disease Vectors in North America: Implications for Spread of Tick-Borne Disease. Int J Environ Res Public Health 2018. Mar;15(3):E478. 10.3390/ijerph15030478 [DOI] [PMC free article] [PubMed] [Google Scholar]
- 31.Hongoh V, Berrang-Ford L, Scott ME, Lindsay LR. Expanding geographical distribution of the mosquito, Culex pipiens, in Canada under climate change. Appl Geogr 2012;33(1):53–62. 10.1016/j.apgeog.2011.05.015 [DOI] [Google Scholar]
- 32.Group on Earth Observations (GEO). What is Earth observation? (Accessed February 2019). https://www.earthobservations.org/g_faq.html
- 33.Clements AC, Reid HL, Kelly GC, Hay SI. Further shrinking the malaria map: how can geospatial science help to achieve malaria elimination? Lancet Infect Dis 2013. Aug;13(8):709–18. 10.1016/S1473-3099(13)70140-3 [DOI] [PubMed] [Google Scholar]
- 34.Hay SI, Snow RW. The malaria Atlas Project: developing global maps of malaria risk. PLoS Med 2006. Dec;3(12):e473. 10.1371/journal.pmed.0030473 [DOI] [PMC free article] [PubMed] [Google Scholar]
- 35.Merkord CL, Liu Y, Mihretie A, Gebrehiwot T, Awoke W, Bayabil E, Henebry GM, Kassa GT, Lake M, Wimberly MC. Integrating malaria surveillance with climate data for outbreak detection and forecasting: the EPIDEMIA system. Malar J 2017. Feb;16(1):89. 10.1186/s12936-017-1735-x [DOI] [PMC free article] [PubMed] [Google Scholar]
- 36.Thomson MC, Connor SJ, Milligan P, Flasse SP. Mapping malaria risk in Africa: what can satellite data contribute? Parasitol Today 1997. Aug;13(8):313–8. 10.1016/S0169-4758(97)01097-1 [DOI] [PubMed] [Google Scholar]
- 37.Gemperli A, Sogoba N, Fondjo E, Mabaso M, Bagayoko M, Briët OJ, Anderegg D, Liebe J, Smith T, Vounatsou P. Mapping malaria transmission in West and Central Africa. Trop Med Int Health 2006. Jul;11(7):1032–46. 10.1111/j.1365-3156.2006.01640.x [DOI] [PubMed] [Google Scholar]
- 38.Beck LR, Lobitz BM, Wood BL. Remote sensing and human health: new sensors and new opportunities. Emerg Infect Dis 2000. May-Jun;6(3):217–27. 10.3201/eid0603.000301 [DOI] [PMC free article] [PubMed] [Google Scholar]
- 39.Clements AC, Reid HL, Kelly GC, Hay SI. Further shrinking the malaria map: how can geospatial science help to achieve malaria elimination? Lancet Infect Dis 2013. Aug;13(8):709–18. 10.1016/S1473-3099(13)70140-3 [DOI] [PubMed] [Google Scholar]
- 40.Correia VR, Carvalho MS, Sabroza PC, Vasconcelos CH. Remote sensing as a tool to survey endemic diseases in Brazil. Cad Saude Publica 2004. Jul-Aug;20(4):891–904. 10.1590/S0102-311X2004000400003 [DOI] [PubMed] [Google Scholar]
- 41.Canadian Space Agency (CSA). Earth Observation Satellites. CSA, Canada, 2017 (Accessed January 2019). http://www.asc-csa.gc.ca/eng/satellites/default-eo.asp
- 42.National Aeronautics and Space Administration (NASA). AIRS Instrument Specs. NASA, United States of America (Accessed January 2019). https://airs.jpl.nasa.gov/mission_and_instrument/instrument/specs
- 43.National Aeronautics and Space Administration (NASA). Precipitation measurement missions. United States of America (Accessed January 2019). https://pmm.nasa.gov/precipitation-measurement-missions
- 44.National Aeronautics and Space Administration (NASA). Remote Sensors. NASA, United States of America (Accessed January 2019). https://earthdata.nasa.gov/user-resources/remote-sensors
- 45.National Aeronautics and Space Administration (NASA). Suomi NPP Visible Infrared Imaging Radiometer Suite (VIIRS). NASA, United States of America (Accessed January 2019). https://ladsweb.modaps.eosdis.nasa.gov/missions-and-measurements/viirs/
- 46.Remote Sensing Systems (RSS). Research-quality geophysical products from satellite microwave sensors. RSS, United States of America (Accessed January 2019). http://www.remss.com/
- 47.Satellite Imaging Corporation (SIC). Satellite Sensors. SIC, United States of America (Accessed January 2019). https://www.satimagingcorp.com/satellite-sensors/
- 48.World Meteorological Organization (WMO). Observing Systems Capability Analysis and Review Tool (OSCAR). Switzerland: WMO; 2011-2019 (Accessed January 2019). https://www.wmo-sat.info/oscar/
- 49.Manore CA, Davis J, Christofferson RC, Wesson D, Hyman JM, Mores CN. Towards an early warning system for forecasting human west nile virus incidence. PLoS Curr 2014. Mar;6:ecurrents.outbreaks.ed6f0f8a61d20ae5f32aaa5c2b8d3c23. 10.1371/currents.outbreaks.ed6f0f8a61d20ae5f32aaa5c2b8d3c23 [DOI] [PMC free article] [PubMed] [Google Scholar]
- 50.Tran A, Sudre B, Paz S, Rossi M, Desbrosse A, Chevalier V, Semenza JC. Environmental predictors of West Nile fever risk in Europe. Int J Health Geogr 2014. Jul;13:26. 10.1186/1476-072X-13-26 [DOI] [PMC free article] [PubMed] [Google Scholar]
- 51.Brown L, Medlock J, Murray V. Impact of drought on vector-borne diseases--how does one manage the risk? Public Health 2014. Jan;128(1):29–37. 10.1016/j.puhe.2013.09.006 [DOI] [PubMed] [Google Scholar]
- 52.Rosà R, Marini G, Bolzoni L, Neteler M, Metz M, Delucchi L, Chadwick EA, Balbo L, Mosca A, Giacobini M, Bertolotti L, Rizzoli A. Early warning of West Nile virus mosquito vector: climate and land use models successfully explain phenology and abundance of Culex pipiens mosquitoes in north-western Italy. Parasit Vectors 2014. Jun;7:269. 10.1186/1756-3305-7-269 [DOI] [PMC free article] [PubMed] [Google Scholar]
- 53.Gardner AM, Lampman RL, Muturi EJ. Land use patterns and the risk of West Nile virus transmission in central Illinois. Vector Borne Zoonotic Dis 2014. May;14(5):338–45. 10.1089/vbz.2013.1477 [DOI] [PubMed] [Google Scholar]
- 54.Rees EE, Petukhova T, Mascarenhas M, Pelcat Y, Ogden NH. Environmental and social determinants of population vulnerability to Zika virus emergence at the local scale. Parasit Vectors 2018. May;11(1):290. 10.1186/s13071-018-2867-8 [DOI] [PMC free article] [PubMed] [Google Scholar]
- 55.Barbour AG. Fall and rise of Lyme disease and other Ixodes tick-borne infections in North America and Europe. Br Med Bull 1998;54(3):647–58. 10.1093/oxfordjournals.bmb.a011717 [DOI] [PubMed] [Google Scholar]
- 56.Kilpatrick AM, Dobson AD, Levi T, Salkeld DJ, Swei A, Ginsberg HS, Kjemtrup A, Padgett KA, Jensen PM, Fish D, Ogden NH, Diuk-Wasser MA. Lyme disease ecology in a changing world: consensus, uncertainty and critical gaps for improving control. Philos Trans R Soc Lond B Biol Sci 2017. Jun;372(1722):20160117. 10.1098/rstb.2016.0117 [DOI] [PMC free article] [PubMed] [Google Scholar]
- 57.Gabriele-Rivet V, Koffi JK, Pelcat Y, Arsenault J, Cheng A, Lindsay LR, Lysyk TJ, Rochon K, Ogden NH. A Risk Model for the Lyme Disease Vector Ixodes scapularis (Acari: Ixodidae) in the Prairie Provinces of Canada. J Med Entomol 2017. Jul;54(4):862–8. 10.1093/jme/tjx036 [DOI] [PubMed] [Google Scholar]
- 58.Bouchard C, Beauchamp G, Leighton PA, Lindsay R, Bélanger D, Ogden NH. Does high biodiversity reduce the risk of Lyme disease invasion? Parasit Vectors 2013. Jul;6:195. 10.1186/1756-3305-6-195 [DOI] [PMC free article] [PubMed] [Google Scholar]
- 59.Cuber P, Andreassen Å, Vainio K, Asman M, Dudman S, Szilman P, Szilman E, Ottesen P, Ånestad G, Cieśla-Nobis S, Solarz K. Risk of exposure to ticks (Ixodidae) and the prevalence of tick-borne encephalitis virus (TBEV) in ticks in Southern Poland. Ticks Tick Borne Dis 2015. Apr;6(3):356–63. 10.1016/j.ttbdis.2015.02.010 [DOI] [PubMed] [Google Scholar]
- 60.Dantas-Torres F. Climate change, biodiversity, ticks and tick-borne diseases: the butterfly effect. Int J Parasitol Parasites Wildl 2015. Aug;4(3):452–61. 10.1016/j.ijppaw.2015.07.001 [DOI] [PMC free article] [PubMed] [Google Scholar]
- 61.Estrada-Peña A, de la Fuente J. The ecology of ticks and epidemiology of tick-borne viral diseases. Antiviral Res 2014. Aug;108:104–28. 10.1016/j.antiviral.2014.05.016 [DOI] [PubMed] [Google Scholar]
- 62.Werden L, Barker IK, Bowman J, Gonzales EK, Leighton PA, Lindsay LR, Jardine CM. Geography, deer, and host biodiversity shape the pattern of Lyme disease emergence in the Thousand Islands Archipelago of Ontario, Canada. PLoS One 2014. Jan;9(1):e85640. 10.1371/journal.pone.0085640 [DOI] [PMC free article] [PubMed] [Google Scholar]
- 63.Ripoche M, Lindsay LR, Ludwig A, Ogden NH, Thivierge K, Leighton PA. Multi-Scale Clustering of Lyme Disease Risk at the Expanding Leading Edge of the Range of Ixodes scapularis in Canada. Int J Environ Res Public Health 2018. Mar;15(4):603. 10.3390/ijerph15040603 [DOI] [PMC free article] [PubMed] [Google Scholar]
- 64.Batallán GP, Estallo EL, Flores FS, Sartor P, Contigiani MS, Almirón WR. St. Louis Encephalitis virus mosquito vectors dynamics in three different environments in relation to remotely sensed environmental conditions. Acta Trop 2015. Jun;146:53–9. 10.1016/j.actatropica.2015.03.009 [DOI] [PubMed] [Google Scholar]
- 65.Bowden SE, Magori K, Drake JM. Regional differences in the association between land cover and West Nile virus disease incidence in humans in the United States. Am J Trop Med Hyg 2011. Feb;84(2):234–8. 10.4269/ajtmh.2011.10-0134 [DOI] [PMC free article] [PubMed] [Google Scholar]
- 66.Chuang TW, Henebry GM, Kimball JS, Vanroekel-Patton DL, Hildreth MB, Wimberly MC. Satellite microwave remote sensing for environmental modeling of mosquito population dynamics. Remote Sens Environ 2012. Oct;125:147–56. 10.1016/j.rse.2012.07.018 [DOI] [PMC free article] [PubMed] [Google Scholar]
- 67.DeGroote JP, Sugumaran R, Brend SM, Tucker BJ, Bartholomay LC. Landscape, demographic, entomological, and climatic associations with human disease incidence of West Nile virus in the state of Iowa, USA. Int J Health Geogr 2008. May;7:19. 10.1186/1476-072X-7-19 [DOI] [PMC free article] [PubMed] [Google Scholar]
- 68.Liu H, Weng Q. Enhancing temporal resolution of satellite imagery for public health studies: A case study of West Nile Virus outbreak in Los Angeles in 2007. Remote Sens Environ 2012;117:57–71. 10.1016/j.rse.2011.06.023 [DOI] [Google Scholar]
- 69.vonHedemann N, Butterworth MK, Robbins P, Morin CW, Landau K. Visualizations of mosquito risk: A political ecology approach to understanding the territorialization of hazard control. Landsc Urban Plan 2015;142:159–69. 10.1016/j.landurbplan.2015.03.001 [DOI] [Google Scholar]
- 70.Kotchi SO, Turgeon P, Michel P, Lavigne MP, Brazeau S. Assessing and Monitoring Microbiological Quality of Surface Waters Using Tele-Epidemiology. Glob Bioet 2011;24(1-4):65–70. 10.1080/11287462.2011.10800700 [DOI] [Google Scholar]
- 71.United Nations Office for Outer Space Affairs (UNOOSA). Space Solutions for the World's Problems: How the United Nations family uses space technology for achieving development goals. Vienna (Austria): UNOOSA; 2005. http://www.unoosa.org/oosa/oosadoc/data/documents/2005/stspace/stspace200501_0.html
- 72.United Nations Office for Outer Space Affairs (UNOOSA). International Charter Space and Major Disasters. UNOOSA, Austria (Accessed January 2018). www.un-spider.org/space-application/emergency-mechanisms/international-charter-space-and-major-disasters
- 73.Asrar FM, Asrar S, Clark JB, Kendall DJ, Ngo-Anh TJ, Brazeau S, Hulsroj P, Williams RS. Help from above: outer space and the fight against Ebola. Lancet Infect Dis 2015. Aug;15(8):873–5. 10.1016/S1473-3099(15)00153-X [DOI] [PubMed] [Google Scholar]
- 74.Yang C, Luo J, Hu C, Tian L, Li J, Wang K. An Observation Task Chain Representation Model for Disaster Process-Oriented Remote Sensing Satellite Sensor Planning: A Flood Water Monitoring Application. Remote Sens 2018;10(3):375 10.3390/rs10030375 [DOI] [Google Scholar]
- 75.Hamm NA, Soares Magalhães RJ, Clements AC. Earth Observation, Spatial Data Quality, and Neglected Tropical Diseases. PLoS Negl Trop Dis 2015. Dec;9(12):e0004164. 10.1371/journal.pntd.0004164 [DOI] [PMC free article] [PubMed] [Google Scholar]
- 76.Johnson DP, Wilson JS, Luber GC. Socioeconomic indicators of heat-related health risk supplemented with remotely sensed data. Int J Health Geogr 2009. Oct;8:57. 10.1186/1476-072X-8-57 [DOI] [PMC free article] [PubMed] [Google Scholar]
- 77.Luber G, McGeehin M. Climate change and extreme heat events. Am J Prev Med 2008. Nov;35(5):429–35. 10.1016/j.amepre.2008.08.021 [DOI] [PubMed] [Google Scholar]
- 78.Hazaymeh K, Hassan QK. Fusion of MODIS and landsat-8 surface temperature images: a new approach. PLoS One 2015. Mar;10(3):e0117755. 10.1371/journal.pone.0117755 [DOI] [PMC free article] [PubMed] [Google Scholar]
- 79.Government of Canada. Innovation, Science and Economic Development Canada. Earth observation images processing and management system. ISED; 2018 (Accessed December 2018). http://www.ic.gc.ca/eic/site/101.nsf/eng/00029.html