

Abstract
Background
In vitro models of prostate cancer (PCa) are not always reliable to evaluate anticancer treatment efficacy. This limitation may be overcome by using viable tumor slice material. Here we report on the establishment of an optimized ex vivo method to culture tissue slices from patient‐derived xenografts (PDX) of prostate cancer (PCa), to assess responses to PCa treatments.
Methods
Three PDX models were used that are characterized by different androgen receptor (AR) expression and different homology directed DNA repair capacities, due to a breast cancer associated two (BRCA2) wild‐type or mutated status. Tumors were removed from mice, sliced using a vibratome and cultured for a maximum of 6 days. To test the sensitivity to androgen antagonist, tumor slices from the AR‐expressing and AR‐negative PDX tumors were treated with the anti‐androgen enzalutamide. For sensitivity to DNA repair intervention, tumors slices from BRCA2 wild‐type and mutated PDXs were treated with the poly (ADP‐ribose) polymerase‐1 inhibitor olaparib. Treatment response in these tumor slices was determined by measuring slice morphology, cell proliferation, apoptosis, AR expression level, and secretion of prostate specific antigen (PSA).
Results
We compared various culture conditions (support materials, growth media, and use of a 3D smooth rocking platform) to define the optimal condition to maintain tissue viability and proliferative capacity up to least 6 days. Under optimized conditions, enzalutamide treatment significantly decreased proliferation, increased apoptosis, and reduced AR‐expression and PSA secretion of AR‐expressing tumor slices compared to AR‐negative slices, that did not respond to the intervention. Olaparib treatment significantly increased cell death in BRCA2 mutated tumors slices as compared to slices from BRCA2 wild type tumors.
Conclusions
Ex vivo treatment of PCa PDX tumor slices with enzalutamide and olaparib recapitulates responses previously observed in vivo. The faithful retention of tissue structure and function in this ex vivo model offers an ideal opportunity for treatment efficacy screening, thereby reducing costs and numbers of experimental animals.
Keywords: enzalutamide, ex vivo culture, olaparib, prostate cancer, tissue slices
1. INTRODUCTION
Prostate cancer (PCa) is the second most common cancer in men and the fourth most common tumor type worldwide.1 PCa remains a high burden in the current healthcare system, especially once it develops into castration resistant PCa (CRPC). Although therapeutic strategies have improved over the past decades, their gains are often transient and only marginally increase survival of CRPC patients. Therefore, there is a clear unmet clinical need for better treatment options and predictive markers for CPRC patients. Currently, a multitude of novel targets and compounds are in the pipeline for testing. In order to speed up the process from development toward clinical use, faster and better test models are urgently needed. When developing and testing novel therapies, it is essential to have a cancer model that is both reliable and representative.
Most preclinical studies of PCa depend heavily on immortalized cancer cell lines, which are grown in culture dishes as a two‐dimensional model. These models do not recapitulate the complex architecture of tumors nor the important interaction between tumor cells and their microenvironment.2 They do therefore not always accurately predict treatment efficacy and these limitations could lead to a failure when transitioning a new drug from the bench to the clinic.
As an alternative, ex vivo culturing of tumor slices represent a solid model system for drug sensitivity testing due to its relatively short generation time and reflection of the tumor microenvironment.3, 4, 5, 6, 7 For example, several studies have shown that breast tumor tissue slices can be used to assess chemotherapy response in the context of personalized medicine.8, 9, 10 In recent years, efforts have been undertaken to establish such strategies to generate primary cultures from human prostate tumors and innovative complex culture systems. Unfortunately, the establishment of primary PCa organotypic cultures proved to be extremely challenging due to the slow‐growing characteristics of the PCa cells; basal epithelial cells proliferate faster than tumor cells and often outgrow them during prolonged culture.11, 12, 13
To allow testing of therapy responses in different genetic and functional backgrounds of PCa, we set out to develop an optimized tissue slice culture system. We used well‐established patient‐derived xenograft (PDXs) models as a source for the tissue slices14, 15, 16 and show that our tissue slice culture system provides treatment outcome that recapitulates responses previously found in vivo.
2. MATERIALS AND METHODS
2.1. Reagents
Reagents were purchased from Sigma‐Aldrich (Darmstadt, Germany) unless otherwise specified.
2.2. Collection of PDX tumor tissue
PDXs of PCa (PC295, PC339, and PC310) were established by van Weerden et al14 and were routinely passaged by subcutaneous grafting of small fragments onto both shoulders of intact male athymic NMRI nu/nu mice (Taconic Biosciences, Cologne, Germany). Characteristics of the different PDXs are summarized in Table 1. Fresh PDX tumors with volume of 500–1000 mm3 were obtained. After removal from mice, the tumors were kept on ice in Dulbecco's Modified Eagle Medium (DMEM; Lonza, Verviers Sprl, Belgium).
Table 1.
| PDX | Origin 1 | AD2 | AR3 | PSA4 | BRCA | TD (days)5 | Pathology type |
|---|---|---|---|---|---|---|---|
| PC295 | LN | + | + | + | WT5 | 9‐11 | adenocarcinoma |
| PC339 | TURP | ‐ | ‐ | ‐ | WT | 4‐7 | adenocarcinoma |
| PC310 | PC | + | + | + | HD6 | 9‐11 | adenocarcinoma |
LN, lymph node metastasis; TURP, transurethral resection of the prostate; PC, primary prostate tumor; 2AD, androgen dependence; 3AR, androgen receptor; 4PSA, prostate specific antigen; 5WT, wild type; 6HD, homozygous deletion; 5TD, Tumor doubling time
2.3. Tissue slice and culture
Tumor slices were generated using a vibratome (Leica VT1200S; Leica, Nussloch, Germany) with a thickness set at 300 µm, vibration amplitude at 3.0 mm and slicing speed at 0.6 mm/sec. Slices were either submerged directly in 3 mL culture medium or placed on Falcon 40 µm Cell Strainers or Millicell 0.4 µm Cell inserts (Merck Millipore, Bedford, UK) and then cultured in 3 mL culture medium in six well plates. The culture media that were tested for quality assessment are summarized in Table 2. Slices were put in culture within 3 h after the tumor was removed from the mouse. Culturing was performed at 5% CO2 at 37°C and at atmospheric oxygen levels. Culture plates were standing still or were subjected to movement at 6 rpm using Luckham 4RT Rocking Table (Luckham 200 Ltd, West Sussex, UK). One third of medium was refreshed and collected daily. Slices were harvested at various time points and fixed in 10% neutral buffered formalin for at least 24 h at room temperature (RT). Subsequently, tumor slices were embedded in paraffin and 4 µm sections were made for further microscopy analysis (for practical setup, see Figure 1).
Table 2.
Overview of the different medium compositions
| PGM | aDMEM/F12 K | M199: K‐SFM | DMEM |
|---|---|---|---|
| DMEM/Ham's F12 (1:1) BSA (0.01%) FCS (2%) Epidermal growth factor (10 ng/mL) Insulin‐transferrin‐selenium (1%) Hydrocortison (0.5 μg/mL) Triiodothyronine (1 nM) Phosphoethanolamine(0.1 mM) Cholera toxin(50 ng/mL) Fibronectin(100 ng/mL) Fetuine (20 μg/mL) R1881(0.1 nM) Penicillin/streptomycin (100 U/mL, 100 μg/mL) | PFMR‐4A (aDMEM/F12 K) | M199: K‐SFM (1:1) Antibiotic/antimycotic solution | DMEM‐high glucose Penicillin/streptomycin (100 U/mL, 100 μg/mL) |
Figure 1.

PDX tissue culture methodology. The tumor was removed from the mice and sliced with a Leica Vibratome into 300 µm tumor slices. Slices were either submerged in culture medium, on Cell Strainers or on Cell Culture inserts. Culture dishes were then placed on a Rocking Table or incubated without movement. Slices were harvested at various time points and EdU was added 2 h before fixation. Subsequently, fixed tissue was embedded in paraffin (FFPE). [Color figure can be viewed at wileyonlinelibrary.com]
2.4. Ex vivo antiandrogen and PARP‐1 inhibitor treatment
To test the response of antiandrogen and poly (ADP‐ribose) polymerase‐1 (PARP‐1) inhibitor treatment, tissue slices were cultured under optimal conditions and treated with enzalutamide (1 µM, Sequoia Research Products, Pangbourne, UK), olaparib (10 µM, Selleck Chemicals, Munich, Germany), or with vehicle control (dimethyl sulfoxide, DMSO) for different time points.
2.5. Hematoxylin and eosin staining
Histological tumor architecture was examined by hematoxylin and eosin (H&E) staining. Briefly, sections were deparaffinized in xylene followed by rehydration in graded alcohols. They were then stained with hematoxylin for 1 min, rinsed with tap water, stained with eosin for 1 min, and rinsed again with tap water. The slides were then dehydrated with increasing concentration of ethanol successively followed by xylene and mounted with entellan.
2.6. Immunohistochemical and fluorescent procedures
Sections were deparaffinized in xylene followed by rehydration in graded alcohols. Antigen retrieval was performed with target retrieval buffer (Dako, Glostrup, Denmark). For diaminobenzidine (DAB) staining, endogenous peroxidase activity was blocked by using 3% hydrogen peroxide solution in methanol at RT for 20 min. 5% bovine serum albumin (BSA) in phosphate buffered saline (PBS, Lonza, Verviers, Belgium) was used to block nonspecific binding. Primary androgen receptor (AR) antibody (M4074, 1/200, SPRING Bioscience, Pleasanton, CA) and Ki67 antibody (ab16667, 1/200, Abcam, Cambridge, UK) diluted in blocking buffer were applied to the sections at 4°C overnight. Ki67 was detected with anti‐rabbit Alexa Fluor 488 and mounted with Vectashield containing DAPI (Vector Laboratories, Burlingame, CA). AR staining continues with a horseradish peroxidase (HRP)‐conjugated anti‐rabbit IgG secondary antibody (Dako) at a 1:100 dilution for 1 h at RT. AR positive cells were visualized using DAB staining kit (Agilent, Santa Clara, CA) followed by counterstaining with hematoxylin. Negative controls were performed for all samples by omitting the primary antibodies.
2.7. EdU incorporation and Click‐iT™ reaction
5‐ethynyl‐2′‐deoxyuridine (EdU, Invitrogen, Carlsbad, CA) at a concentration of 3 µg/mL was added to the culture medium 2 h before fixation. For the Click reaction, tissue sections were deparaffinized in xylene followed by rehydration in graded alcohols and then blocked with PBS containing 1% BSA. After additional washing with PBS, sections were incubated with freshly made Click‐iT Alexa Fluor 594 cocktail buffer for 30 min as previously reported.10 Samples were mounted using Vectashield mounting medium with DAPI.
2.8. TUNEL assay
Terminal deoxynucleotidyl transferase dUTP nick end‐labeling (TUNEL) assay was performed using In Situ Cell Death Detection Kit (Roche Life Sciences, Penzberg, Germany) according to instruction of the manufacturer.
2.9. Medium prostate‐specific antigen (PSA) measurement
Tumor slices culture medium (1 mL) was collected daily for PSA measurement. The PSA concentration was measured using a PSA enzyme‐linked immunosorbent assay (ELISA) kit (Abnova, Taipei City, Taiwan) according to the manufacturer instructions. The accumulated PSA concentration in the culture medium was calculated using the following formula (which corrects for medium removal each day):
2.10. Image acquisition
AR staining was imaged using a light microscope (Olympus, Tokyo, Japan) and four fields (200× magnification) from each section were captured. For Ki67, EdU, and TUNEL staining quantifications, 10 random images (400× magnification) from each tumor slice section were generated using a Leica fluorescence microscope (DM4000b) to represent the slice heterogeneity. Representative EdU and TUNEL photos were taken by using a Leica SP5 confocal microscope (Leica, Nussloch, Germany). Image size:512 × 512 pixels, pixel size 0.7 µm, 200× magnification.
2.11. Image quantification
AR expression was quantified by Image J software to yield the pixel ratio of AR positive to total nuclei. To quantify the TUNEL microscopy images, all pictures were analyzed with the Fraction of overlap with Otsu's thresholding method: The DAPI and the TUNEL image were both thresholded according to Otsu's algorithm17 which resulted into two binary images. The pixel number was measured and subsequently the Mander's M1 coefficient was used to calculate the fraction of TUNEL positive pixel overlapped with DAPI pixel.18 To quantify the fraction of EdU positive cells, the fraction of overlap of silhouette images method was used. This method relies on edge detection to obtain a binary image. For both the DAPI and EdU pictures, a gradient magnitude image was obtained from the image of entry. This binary image was created using a modified triangle‐thresholding method in which black areas completely enclosed by white areas were filled.19 Next, a morphological dilation was applied using a circular structuring element with a radius of three pixels. All pixels that still had a value of one then constitute a newly formed gradient mask image. The same thresholding was applied to the original grayscale image. The intersection of this image and all pixels greater than the mean intensity of the original grayscale image formed the intensity mask image. A new image was obtained through seeded region growing, whereby the gradient mask served as a seed point image and the intensity mask as the target image. This newly formed image was subjected to a median filter with a 5 × 5 neighborhood and all pixels equal to one constitute the final binary image. Finally, Mander's M1 coefficient was calculated for the fraction of overlap.
2.12. Statistical analysis
Results are expressed as the mean ± SEM or median ± quartile in bar graph. Mann‐Whitney test was used to analyze the differences between two groups. Statistical analysis and generation of graphs was performed using Graphpad Prism 6.0 (La Jolla, CA). P < 0.05 was considered statistically significant. *P < 0.05, **P < 0.01, ***P < 0.001.
3. RESULTS
3.1. Culture condition selection
To establish the most optimal culture method for preservation of PCa tissue slice viability we developed an optimized culture system and compared it to previously reported systems.20, 21 Tumor slices from PC295, PC339, and PC310 PCa PDXs were generated using a vibratome and these slices were cultured in prostate growth medium (PGM) for 4 days under the different conditions in which we compared supporting materials (Figure 1). Furthermore, stationary condition and 3D orbital movement on a rocking table were compared as smooth 3D orbital movement could increase oxygen and nutrition exchange as reported previously.21 H&E stained sections of slices of all three tumors showed that slices cultured on cell strainers maintained tissue morphology, while slices cultured without support or on inserts lost tissue integrity and showed an increase in apoptotic nuclei and vacuolated structures over time (Figure 2A and Figure S1). Moreover, in contrast what was observed previously using inserts, we did not observe a viability gradient nor loco‐regional changes in morphology.15
Figure 2.
Effect of filter support and 3D orbital movement on PCa tissue slice morphology and viability. A, Representative H&E images of PC295 tumor slice sections after 4 days of culturing under the different culture conditions, compared to an initial slice (day 0). Scale bar 50 µm. B, Representative EdU/TUNEL/DAPI images of PC295 tumor slice sections after 4 days of culturing under the different culture conditions, compared to an initial slice (day 0) (blue = DAPI, red = EdU, green = TUNEL). Represented H&E and EdU/TUNEL images of PC339 and PC310 tumor slices can be found in Figure S1. Scale bar 50 µm. C, Quantification of the fraction of EdU‐positive cells in the tissue slices. D, Quantification of the fraction of TUNEL positive cells in the tissue slices. For all graphs, 10 image fields were analyzed per tumor slice. Each point represents one image field, interquartile range, and median values are indicated (results from 1 representative tumor per graph). [Color figure can be viewed at wileyonlinelibrary.com]
The thymidine analog EdU was used as a real‐time proliferation marker to assess tissue viability. We tested the reliability of our newly developed EdU quantification algorithm by comparing automatic counting with manual counting and a good correlation was observed (an R2 of 0.922 and 0.841, respectively for two individuals compared to automatic counting; Figure S2). A large variability of EdU‐positive cells was observed between individual image fields, and therefore, 10 fields of view were quantified per slice to provide a reliable assessment. Tissue slices cultured on cell strainers and under continues 3D orbital movement outperformed the other tissue slice methods when looking at maintenance of proliferation at day 4 (Figures 2B and 2C). We further evaluated the induction of cell death during ex vivo culturing by TUNEL staining, which labels DNA strand breaks generated during apoptosis.22 In line with the results on proliferation, slices cultured on cell strainers did not show an increase in apoptosis at 4 days of culture, while slices cultured under the other conditions showed enhanced apoptosis. No significant difference in TUNEL signal was observed between slices in the stationary condition and those cultured on a rocking table (Figures 2B and 2D). From the EdU and TUNEL results combined, we concluded that cell strainer‐support and continuous 3D orbital movement are optimal for maintenance of tissue slice morphology, proliferation, and viability.
3.2. Optimal medium selection
The culture medium composition has vital impact on the viability of tissue slices. To select the optimal medium, we therefore tested four different culture media that have been reported previously for primary prostate cell or tumor culturing (Table 2).20, 21, 23, 24, 25 Tissue morphology analysis showed that Prostate Growth Medium (PGM)24 and aDMEM/F12 K outperformed the other media tested (Figure S3). We compared incubation of tissue slices from PC295 and PC339 to determine which medium preserved tumor cell viability most optimally. Average tissue proliferation remained constant for PC339 (average 10%) up to 6 days of culturing in both media while proliferation of PC295 reduced over time in both media (initial 10.7%, and 2.5% and 3.6% in PGM and aDMEM/F12 K, respectively after 6 days). There was no significant difference in performance between the two culture media for both PDXs (Figure 3A).
Figure 3.

Optimization of culture medium. A, Quantification of the fraction of EdU‐positive cells of PC295 and PC339 slices cultured up to 6 days in PGM and aDMEM/F12 K medium. B, Quantification of the fraction of EdU‐positive cells for PC295 and PC339 slices cultured up to 6 days in aDMEM/F12 K and aDMEM/F12 K supplemented with R1881. C, Quantification of the fraction of TUNEL‐positive cells for PC295 and PC339 slices cultured in aDMEM/F12 K and aDMEM/F12 K supplemented with R1881 at 6 days. For all graphs, 10 image fields were analyzed per tumor slice section. Each point represents one image field, average and SEM are indicated (three independent experiments for each tumor type). **P < 0.01, ***P < 0.001, ns, non‐significant. [Color figure can be viewed at wileyonlinelibrary.com]
PGM constitutes 2% fetal calf serum (FCS) and is supplemented with the synthetic androgen R1881 (0.1 nM), while aDMEM/F12 K devoid of FCS and does not contain R1881. The clear benefit of using serum‐free medium led us to test the impact of addition of the same concentration of R1881 to the aDMEM/F12 K medium. Three tumors of PC295 and PC339 each were cultured under optimal conditions in aDMEM/F12 K or in aDMEM/F12 K supplemented with R1881. We found a significantly higher proliferation rate of the PC295 slices cultured in aDMEM/F12 K supplemented with R1881 compared to aDMEM/F12 K without R1881 (1.9 fold at day 6) (Figure 3B). As expected, addition of R1881 did not affect proliferation rates of androgen independent PC339 slices (Figure 3B). Some increase in apoptosis was observed in PC339, while PC295 maintained its low apoptosis levels for up to 6 days of ex vivo culturing (Figure 3C).
To further assess tissue maintenance, we measured AR expression, a major characteristic of androgen dependent prostate tumors. Immunohistochemical stainings showed that AR expression was largely maintained during ex vivo culturing of PC295 slices, with a small but significant decrease of AR expression in slices cultured at 6 days in either PGM or aDMEM/F12 K (Figures 4A and 4B). The addition of R1881 to aDMEM/F12 K medium preserved AR levels up to 6 days of incubation (Figures 4C and 4D).
Figure 4.

Prostate characteristics during prolonged ex vivo culturing. A, Representative images of AR staining of PC295 tumor slice sections cultured in two media for different time points, compared to the stained section of the initial slice (day 0). B, Quantification of the AR staining. Four image fields were analyzed per tumor slice, each point represents one image field, average, and SEM are indicated (three independent experiments). C, Representative images of AR staining of PC295 tissue slice sections cultivated in aDMEM/F12 K and aDMEM/F12 K supplemented with R1881 for different time points, compared to the stained section of the initial slice (day 0). D, Quantification of the AR staining. Four image fields were analyzed per tumor slice, each point represents one image field, average, and SEM are indicated (three independent experiments). E, Normalized accumulated PSA concentrations of PC295 slices from day 1 to day 6 cultured in aDMEM/F12 K and aDMEM/F12 K supplemented with R1881. Line represent mean values and bars indicates SEM (three independent experiments). For all graphs scale bar 50 µm and *P < 0.05, **P < 0.01, ***P < 0.001, ns, non‐significant. [Color figure can be viewed at wileyonlinelibrary.com]
Because androgen stimulates PSA secretion from PCa cells, we measured PSA levels in the culture media. Medium from PC295 tumor slices was collected for up to 6 days and PSA accumulation was monitored. After normalization to initial PSA levels, we observed a continuous increase in PSA for up to 6 days in cultures supplemented with R1881 while slices cultured in aDMEM/F12 K without R1881 showed a stabilization of PSA levels (Figure 4E). Altogether, we concluded that serum‐free aDMEM/F12 K plus R1881 is the optimal medium for further use showing maintenance of tissue slice morphology, viability, and AR‐functionality.
3.3. Enzalutamide treatment of tissue slices
In order to validate the accuracy of the tissue slice system to reflect clinical responses to relevant therapies, we investigated the response to enzalutamide, a second generation antiandrogen which is currently being tested in a randomized phase III trial.26 PC295 (AR positive and androgen dependent) and PC339 (AR negative and androgen independent) slices were treated with enzalutamide with or without R1881. As shown in Figure 5A, we observed a significant drop in the fraction of EdU positive cells in PC295 slices treated with enzalutamide after 6 days of culturing (decreased by a factor of 5.5), while we did not observe a change in proliferation in PC339 slices. Simultaneously, a significant of 2.8 folds increase of TUNEL positive cells was observed in PC295 slices treated with enzalutamide, with no effect in the PC339 slices (Figure 5B). Presence of R1881 was unable to restore proliferation or revert apoptosis induced by enzalutamide treatment in PC295 slices (Figures 5A and 5B). AR staining of PC295 slices showed a dramatic reduction of 45% upon enzalutamide treatment at day 6 which could also not be reversed by the presence of R1881 (Figure 5C). PSA measurement in medium samples further confirmed the inhibitory effect of enzalutamide on AR positive tumor slices. After an initial rise in PSA at day 2, PSA secretion decreased after enzalutamide treatment, both in presence or absence of R1881 (Figure 5D). Similar antiandrogenic effects of enzalutamide were observed in tumor slices from the AR positive and androgen dependent PC310 PDX model (Figure S4).
Figure 5.

Response to ex vivo enzalutamide treatment. A, Quantification of the fraction of EdU‐positive cells for PC295 and PC339 slices at different time points. Scale bar 100 µm. B, Quantification of the fraction of TUNEL‐positive cells for PC295 and PC339 slices at different time points. Scale bar 100 µm. C, Representative images of AR staining for PC295 tissue slice sections at day 6 and quantification of the AR stainings. Scale bar 50 µm. D, Normalized accumulated PSA concentrations of PC295 and PC339 slices from day 1 to day 6 treated or not with Enzalutamide. Line represent mean values and bars indicates SEM. Ten image fields for EdU/TUNEL and four image fields for AR were analyzed per tumor slice section. Each point represents one image field, average, and SEM are indicated (four independent experiments for each tumor type). *P < 0.05, **P < 0.01, ***P < 0.001, ns, non‐significant. [Color figure can be viewed at wileyonlinelibrary.com]
3.4. Olaparib treatment of tissue slices
Mutations in the DNA repair gene BRCA2 have been identified in PCa patients, and previous studies have shown that these specific patients benefit from treatment with olaparib, an inhibitor of poly[adenosine diphosphate (ADP)‐ribose] polymerase‐1 (PARP‐1).27 We therefore assessed the response to olaparib treatment in PC295 (BRCA2 wild‐type) and PC310 (BRCA2 mutated) tumors. A significant drop in the fraction of S‐phase cells was observed for both PC295 and PC310 tumor slices (decreased by a factor of 2.65 and 10, respectively) when treated with olaparib for 6 days, with a more pronounced reduction in cell proliferation for PC310 (Figure 6A). A significant increase of 10.9 folds of TUNEL positive cells was observed only in PC310 slices treated with olaparib, and not in PC295 tumor slices (Figure 6B). AR staining showed a reduction of AR positive tumor cells in PC310 tumor slices upon olaparib treatment, while only a slight reduction of AR‐positive tumor cells was observed in PC295 tumor slices (Figure 6C). PSA measurement revealed reduced PSA levels of both PC295 and PC310 slices (Figure 6D). In conclusion, both BRCA2 deficient and proficient tumors are hampered by olaparib treatment, but only BRCA2 deficiency causes induction of apoptotic cell death.
Figure 6.

Response to ex vivo olaparib treatment. A, Quantification of the fraction of EdU‐positive cells of PC295 and PC310 slices treated with olaparib for 6 days. B, Quantification of the fraction of TUNEL positive cells of PC295 and PC310 slices treated with olaparib for 6 days. C, Representative images of AR staining of PC295 and PC310 slices treated with olaparib for 6 days. Scale bar 50 µm. D, Normalized accumulated PSA concentrations of PC295 and PC310 slices from day 1 to day 6 treated or not with olaparib. Ten image fields for EdU/TUNEL and four image fields for AR were analyzed per tumor slice section. Each point represents one image field, average and SEM are indicated (three independent experiments for each tumor type). *P < 0.05, **P < 0.01, ***P < 0.001, ns, non‐significant. [Color figure can be viewed at wileyonlinelibrary.com]
4. DISCUSSION
We have established an optimized ex vivo tissue slice culture system using PCa PDXs. Under optimal culture conditions, tumor morphology, cell proliferation, and prostatic characteristics are preserved for up to 6 days with minimal induction of cell death. Furthermore, we showed that this system is suitable for PCa drug testing: we observed responses to enzalutamide in androgen dependent tumor slices as well as to olaparib in BRCA2 mutant tumor slices that reflect in vivo therapy responses.
An ex vivo tumor culture system should maintain cancer characteristics and tumor proliferating capacity during ex vivo culturing to allow reliable therapy response evaluation. Since the 1970s, various studies have been described that aim to establish an ex vivo culture system for PCa tumors. This has resulted in the development of different tumor culture methods, ranging from direct culturing of 1‐2 mm3 human tissue samples in medium to more recently developed techniques to culture precision cut tissue slices on various scaffolds and supporting filters, such as gelatin, collagen sponges, or titanium mesh inserts.21, 23, 28, 29 As reported in these studies, maintenance of prostate or PCa tissue slices for a week could be achieved, but conservation of tissue structure and functionality was not always comprehensively reported with extensive variability in tissue origin and evaluation in the different studies. Application of the ex vivo culture system for drug testing was only reported in a few studies, describing reduced cell proliferation in response to genistein,29 cisplatin combined with a BcL‐2 antagonist,30 heat shock protein 90 inhibitors28 PARP‐1 inhibitors,31 and most recently published studies with bicalutamide32 and docetaxel.33 However detailed cell cycle progression (proliferation) of the tumor cells was not investigated, making direct comparison to our studies difficult. Importantly, our study validates the response to different tumor genotypes, represented by different PDXs, and hence provide evidence that ex vivo drug testing can indeed predict in vivo responses.
Although ex vivo tumor cultures from other cancer types can be maintained for weeks or months,8, 11, 12, 34, 35, 36 PCa tissue maintenance of primary tumors has been challenging probably due to the slow‐growing characteristics and fast proliferation of basal cells.25, 37, 38 Also, obtaining aggressive metastatic PCa material is met with limitations as metastatic disease is predominantly found in bone restricting easy excess. Nowadays, prostate‐specific membrane antigen (PSMA) guided biopsy and salvage lymphadenectomy is reported,39, 40, 41 which may offer new opportunities for acquiring aggressive PCa material for ex vivo drug response tests. Our tissue slice culture platform for PCa defined in this study may be helpful to standardize ex vivo culturing of patient material.
We used PDX tumors to thoroughly evaluate the impact of different culture condition and the ability of tissue slices to recapitulate tumor responses characteristic for a particular genotype. PDX tumors have limited intra‐tumoral heterogeneity and high tumor content which allows for intensive technical studies. In order to reduce slice heterogeneity from the same tumor as much as possible, slices were consecutive allocated to each experimental treatment. We were able to keep longevity of tumor slices by using serum‐free aDMEM/F12 K medium with the addition of synthetic androgen up to 6 days. This medium shares many similar ingredients with medium PFMR‐4A which was reported previously for successful maintenance of benign and malignant prostate tissue slices for 5 days.21 Serum‐free medium allows more precise evaluations of cellular function and better control over physiological responsiveness.
One of the strengths of this study is the use of EdU incorporation to assess cell proliferation, allowing real time measurement of DNA synthesis during replication. We believe that this is a more reliable way to measure early treatment effects compared to the commonly used Ki67 marker. Ki67 protein is present in all cycling cells, even for several days after cells have ceased to proliferate.42 Indeed, we observed a disparity between EdU ratio and Ki67 expression: after 6 days culturing EdU ratio dropped significantly while Ki67 only showed a slight reduction (Figure S5). In the majority of tumor slices from all three PDXs tested, we observed an increase of proliferation after one day of incubation, followed by maintenance of proliferation for PC339 and PC310, or only a slight decrease of proliferation in case of PC295 compared to day 0. The first‐day proliferation boost might be a result of the availability of a high level of nutrients and oxygen. The initial high TUNEL level in PC339 slices is most likely due to a higher level of necrosis in the original tumor sample, since TUNEL assay is unable to distinguish necrosis and apoptosis.43
We observed a marginal effect of androgen deprivation on tumor slice viability in androgen responsive PDX tissue slices. This might be caused by the presence of endogenous androgen maintained in the tumor slices and which is gradually released into the medium during culturing. Thus, endogenously present androgen can be used to maintain activation of AR signaling and proliferation for a few days. Similar observations were done by Zhou et al44 in rat prostates that retained similar androgen tissue levels independent of the serum concentrations.
A clear antiandrogenic response to enzalutamide was observed in androgen dependent tissue slices of PC295 and PC310. Our ex vivo response of tissue slices to enzalutamide are also supported by in vivo data reported by Guerrero et al45 in which enzalutamide inhibits tumor growth significantly during the first 6 days of treatment compared with vehicle‐treated mice. Additionally, we showed that olaparib induced cell death in the BRCA2 mutant PC310 tumor slices, confirming the expected response when targeting DNA damage repair deficient tumors. This was in concordance with recent clinical studies, showing that that CRPC patients with somatic loss and germline mutation of BRCA2 respond well to olaparib.27 Similar was reported by Beshiri et al46 for PCa PDX organoid cultures in which BRCA2 deficiency correlates with olaparib sensitivity. PARP‐1 inhibitors with high PARP trapping potency, such as olaparib, can yield intense replication stress,47, 48 which can explain the decrease of fraction of S‐phase cells in the BRCA2 wild‐type PC295 slices.
So far, several publications have suggested that tumor tissue slice culture can be utilized to predict drug response in breast cancer8, 9, 10 and monitor cytotoxic drug effects in liver, intestine, and lung.49, 50, 51 We have established dedicated tissue slice system for PCa that shows robust and specific antiandrogen and PARP‐1 inhibition treatment effects and that can be extended to testing of novel compounds relevant to PCa.
5. CONCLUSIONS
The faithful retention of tissue structure and function in our ex vivo culture system offers an opportunity to evaluate PCa response to therapeutic compounds making it an ideal system for low to medium throughput testing in drug discovery.
CONFLICT OF INTEREST
We have nothing to disclose.
Supporting information
Additional Supporting Information may be found online in the supporting information tab for this article.
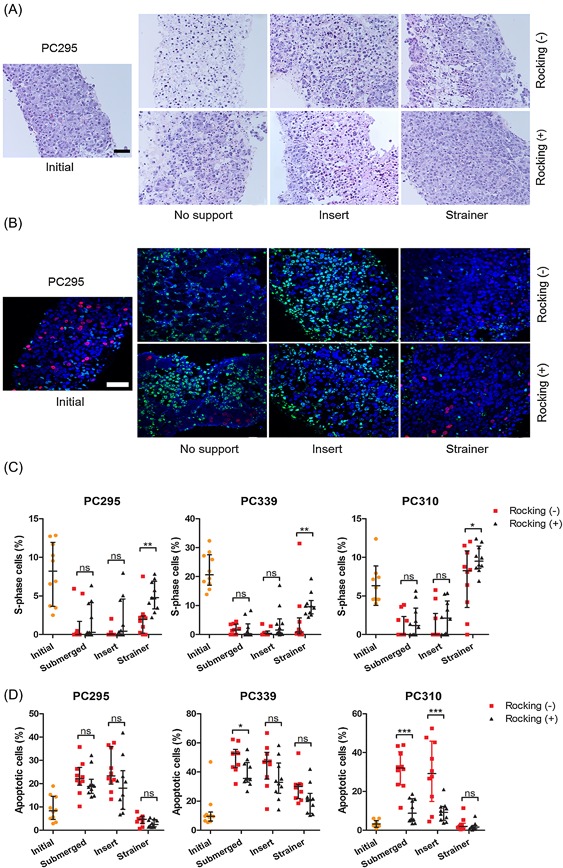
Figure S1. Effect of filter support and 3D orbital movement on PCa tissue slice morphology
Figure S2. Correlation between manual counting and automatic counting
Figure S3. TUNEL level in individual PC339 tumor slices.
Figure S4. Ex‐vivo Enzalutamide treatment effect on PC310 tumor
Figure S5. Double staining of Ki67 and EdU
ACKNOWLEDGMENTS
We thank Alex Nigg (Optical Imaging Center, Erasmus University Medical Center, Rotterdam, The Netherlands) for the AR quantification macro and Nikita Frehé for assistance during the development of the EdU quantification program. This study was supported by the Chinese Scholarship Council (grant number 201506270172 (WZ)), by the Dutch Cancer Society (Alpe d'Huzes grant number EMCR 2014‐7048 [TM and DvG]), by the gravitation program CancerGenomiCs.nl from the Netherlands Organization for Scientific Research (NWO) (RK), by the Oncode Institute, which is partly financed by the Dutch Cancer Society (RK), and by the Daniel den Hoed Foundation (grant number 107235 [JN]).
Zhang W, van Weerden WM, de Ridder CMA, et al. Ex vivo treatment of prostate tumor tissue recapitulates in vivo therapy response. The Prostate. 2019;79: 390–402. 10.1002/pros.23745
REFERENCES
- 1. Torre LA, Bray F, Siegel RL, Ferlay J, Lortet‐Tieulent J, Jemal A. Global cancer statistics, 2012. CA Cancer J Clin. 2015;65:87–108. [DOI] [PubMed] [Google Scholar]
- 2. Wilding JL, Bodmer WF. Cancer cell lines for drug discovery and development. Cancer Res. 2014;74:2377–2384. [DOI] [PubMed] [Google Scholar]
- 3. Gerlach MM, Merz F, Wichmann G, et al. Slice cultures from head and neck squamous cell carcinoma: a novel test system for drug susceptibility and mechanisms of resistance. Br J Cancer. 2014;110:479–488. [DOI] [PMC free article] [PubMed] [Google Scholar]
- 4. Merz F, Gaunitz F, Dehghani F, et al. Organotypic slice cultures of human glioblastoma reveal different susceptibilities to treatments. Neuro Oncol. 2013;15:670–681. [DOI] [PMC free article] [PubMed] [Google Scholar]
- 5. Koerfer J, Kallendrusch S, Merz F, et al. Organotypic slice cultures of human gastric and esophagogastric junction cancer. Cancer Med. 2016;5:1444–1453. [DOI] [PMC free article] [PubMed] [Google Scholar]
- 6. Hickman JA, Graeser R, de Hoogt R, et al. Three‐dimensional models of cancer for pharmacology and cancer cell biology: capturing tumor complexity in vitro/ex vivo. Biotechnol J. 2014;9:1115–1128. [DOI] [PubMed] [Google Scholar]
- 7. Meijer TG, Naipal KA, Jager A, van Gent DC. Ex vivo tumor culture systems for functional drug testing and therapy response prediction. Future Sci OA. 2017;3:FSO190. [DOI] [PMC free article] [PubMed] [Google Scholar]
- 8. Holliday DL, Moss MA, Pollock S, et al. The practicalities of using tissue slices as preclinical organotypic breast cancer models. J Clin Pathol. 2013;66:253–255. [DOI] [PubMed] [Google Scholar]
- 9. van der Kuip H, Murdter TE, Sonnenberg M, et al. Short term culture of breast cancer tissues to study the activity of the anticancer drug taxol in an intact tumor environment. Bmc Cancer. 2006;6:86. [DOI] [PMC free article] [PubMed] [Google Scholar]
- 10. Naipal KA, Verkaik NS, Sanchez H, et al. Tumor slice culture system to assess drug response of primary breast cancer. Bmc Cancer. 2016;16:78. [DOI] [PMC free article] [PubMed] [Google Scholar]
- 11. Nevalainen MT, Harkonen PL, Valve EM, Ping W, Nurmi M, Martikainen PM. Hormone regulation of human prostate in organ culture. Cancer Res. 1993;53:5199–5207. [PubMed] [Google Scholar]
- 12. Parrish AR, Sallam K, Nyman DW, et al. Culturing precision‐cut human prostate slices as an in vitro model of prostate pathobiology. Cell Biol Toxicol. 2002;18:205–219. [DOI] [PubMed] [Google Scholar]
- 13. Gao H, Korn JM, Ferretti S, et al. High‐throughput screening using patient‐derived tumor xenografts to predict clinical trial drug response. Nat Med. 2015;21:1318–1325. [DOI] [PubMed] [Google Scholar]
- 14. van Weerden WM, de Ridder CM, Verdaasdonk CL, et al. Development of seven new human prostate tumor xenograft models and their histopathological characterization. Am J Pathol. 1996;149:1055–1062. [PMC free article] [PubMed] [Google Scholar]
- 15. Davies EJ, Dong M, Gutekunst M, et al. Capturing complex tumour biology in vitro: histological and molecular characterisation of precision cut slices. Sci Rep. 2015;5:17187. [DOI] [PMC free article] [PubMed] [Google Scholar]
- 16. Navone NM, van Weerden WM, Vessella RL, et al. Movember GAP1 PDX project: An international collection of serially transplantable prostate cancer patient‐derived xenograft (PDX) models. Prostate. 2018;78:1262–1282. [DOI] [PubMed] [Google Scholar]
- 17. Otsu N. A threshold selection method from gray‐level histograms. IEEE Trans Syst Man Cybern. 1979;9:62–66. [Google Scholar]
- 18. Manders EMM, Verbeek FJ, Aten JA. Measurement of Colocalization of Objects in Dual‐Color Confocal Images. J Microsc‐Oxford. 1993;169:375–382. [DOI] [PubMed] [Google Scholar]
- 19. Soille P. Morphological Image Analysis: Principles and Applications. Berlin Heidelberg: Springer‐Verlag; 2003. p 391. [Google Scholar]
- 20. De Hoogt R, Estrada MF, Vidic S, et al. Protocols and characterization data for 2D, 3D, and slice‐based tumor models from the PREDECT project. Scientific Data. 2017;4:170170. [DOI] [PMC free article] [PubMed] [Google Scholar]
- 21. Maund SL, Nolley R, Peehl DM. Optimization and comprehensive characterization of a faithful tissue culture model of the benign and malignant human prostate. Lab Invest. 2014;94:208–221. [DOI] [PMC free article] [PubMed] [Google Scholar]
- 22. Loo DT. In situ detection of apoptosis by the TUNEL assay: an overview of techniques DNA Damage Detection In Situ, Ex Vivo, and In Vivo. New York City, NY: Springer; 2011. pp 3–13. [DOI] [PubMed] [Google Scholar]
- 23. Papini S, Rosellini A, De Matteis A, et al. Establishment of an organotypic in vitro culture system and its relevance to the characterization of human prostate epithelial cancer cells and their stromal interactions. Pathol Res Pract. 2007;203:209–216. [DOI] [PubMed] [Google Scholar]
- 24. Marques RB, van Weerden WM, Erkens‐Schulze S, et al. The human PC346 xenograft and cell line panel: a model system for prostate cancer progression. Eur Urol. 2006;49:245–257. [DOI] [PubMed] [Google Scholar]
- 25. Blauer M, Tammela TL, Ylikomi T. A novel tissue‐slice culture model for non‐malignant human prostate. Cell Tissue Res. 2008;332:489–498. [DOI] [PubMed] [Google Scholar]
- 26. Izumi K, Mizokami A, Namiki M, et al. Enzalutamide versus abiraterone as a first‐line endocrine therapy for castration‐resistant prostate cancer (ENABLE study for PCa): a study protocol for a multicenter randomized phase III trial. Bmc Cancer. 2017;17:677. [DOI] [PMC free article] [PubMed] [Google Scholar]
- 27. Mateo J, Carreira S, Sandhu S, et al. DNA‐Repair Defects and Olaparib in Metastatic Prostate Cancer. N Engl J Med. 2015;373:1697–1708. [DOI] [PMC free article] [PubMed] [Google Scholar]
- 28. Centenera MM, Gillis JL, Hanson AR, et al. Evidence for efficacy of new Hsp90 inhibitors revealed by ex vivo culture of human prostate tumors. Clin Cancer Res. 2012;18:3562–3570. [DOI] [PubMed] [Google Scholar]
- 29. Geller J, Sionit L, Partido C, et al. Genistein inhibits the growth of human‐patient BPH and prostate cancer in histoculture. Prostate. 1998;34:75–79. [DOI] [PubMed] [Google Scholar]
- 30. Bray K, Chen HY, Karp CM, et al. Bcl‐2 modulation to activate apoptosis in prostate cancer. Mol Cancer Res. 2009;7:1487–1496. [DOI] [PMC free article] [PubMed] [Google Scholar]
- 31. Schiewer MJ, Goodwin JF, Han S, et al. Dual roles of PARP‐1 promote cancer growth and progression. Cancer Discov. 2012;2:1134–1149. [DOI] [PMC free article] [PubMed] [Google Scholar]
- 32. Centenera MM, Hickey TE, Jindal S, et al. A patient‐derived explant (PDE) model of hormone‐dependent cancer. Mol Oncol. 2018;12:1608–1622. [DOI] [PMC free article] [PubMed] [Google Scholar]
- 33. van de Merbel AF, van der Horst G, van der Mark MH, et al. An ex vivo Tissue Culture Model for the Assessment of Individualized Drug Responses in Prostate and Bladder Cancer. Front Oncol. 2018;8:400. [DOI] [PMC free article] [PubMed] [Google Scholar]
- 34. Ahlgren H, Henjum K, Ottersen OP, Runden‐Pran E. Validation of organotypical hippocampal slice cultures as an ex vivo model of brain ischemia: different roles of NMDA receptors in cell death signalling after exposure to NMDA or oxygen and glucose deprivation. Cell Tissue Res. 2011;345:329–341. [DOI] [PubMed] [Google Scholar]
- 35. Meneghel‐Rozzo T, Rozzo A, Poppi L, Rupnik M. In vivo and in vitro development of mouse pancreatic beta‐cells in organotypic slices. Cell Tissue Res. 2004;316:295–303. [DOI] [PubMed] [Google Scholar]
- 36. Behrsing HP, Vickers AE, Tyson CA. Extended rat liver slice survival and stability monitored using clinical biomarkers. Biochem Biophys Res Commun. 2003;312:209–213. [DOI] [PubMed] [Google Scholar]
- 37. Centenera MM, Raj GV, Knudsen KE, Tilley WD, Butler LM. Ex vivo culture of human prostate tissue and drug development. Nat Rev Urol. 2013;10:483–487. [DOI] [PubMed] [Google Scholar]
- 38. Varani J, Dame MK, Wojno K, Schuger L, Johnson KJ. Characteristics of nonmalignant and malignant human prostate in organ culture. Lab Invest. 1999;79:723–731. [PubMed] [Google Scholar]
- 39. Westenfelder KM, Lentes B, Rackerseder J, et al. Gallium‐68 HBED‐CC‐PSMA positron emission tomography/magnetic resonance imaging for prostate fusion biopsy. Clin Genitourin Cancer. 2018;16:245–247. [DOI] [PubMed] [Google Scholar]
- 40. Simopoulos DN, Natarajan S, Jones TA, Fendler WP, Sisk AE, Jr. , Marks LS. Targeted prostate biopsy using (68)Gallium PSMA‐PET/CT for image guidance. Urol Case Rep. 2017;14:11–14. [DOI] [PMC free article] [PubMed] [Google Scholar]
- 41. Siriwardana A, Thompson J, van Leeuwen PJ, et al. Initial multicentre experience of 68Gallium‐PSMA PET/CT guided robot‐assisted salvage lymphadenectomy: acceptable safety profile but oncological benefit appears limited. BJU International. 2017;16:245–247. [DOI] [PubMed] [Google Scholar]
- 42. van Oijen MGCT, Medema RH, Slootweg PJ, Rijksen G. Positivity of the proliferation marker Ki‐67 in noncycling cells. Am J Clin Pathol. 1998;110:24–31. [DOI] [PubMed] [Google Scholar]
- 43. Kraupp BG, Ruttkay‐Nedecky B, Koudelka H, Bukowska K, Bursch W, Schulte‐Hermann R. In situ detection of fragmented DNA (TUNEL assay) fails to discriminate among apoptosis, necrosis, and autolytic cell death: a cautionary note. Hepatology. 1995;21:1465–1468. [DOI] [PubMed] [Google Scholar]
- 44. Zhou Y, Otto‐Duessel M, He M, Markel S, Synold T, Jones JO. Low systemic testosterone levels induce androgen maintenance in benign rat prostate tissue. J Mol Endocrinol. 2013;51:143–153. [DOI] [PMC free article] [PubMed] [Google Scholar]
- 45. Guerrero J, Alfaro IE, Gomez F, Protter AA, Bernales S. Enzalutamide, an androgen receptor signaling inhibitor, induces tumor regression in a mouse model of castration‐resistant prostate cancer. Prostate. 2013;73:1291–1305. [DOI] [PubMed] [Google Scholar]
- 46. Beshiri ML, Tice CM, Tran C, et al. PDX/organoid biobank of advanced prostate cancers captures genomic and phenotypic heterogeneity for disease modeling and therapeutic screening. Clin Cancer Res. 2018;24:4332–4345. [DOI] [PMC free article] [PubMed] [Google Scholar]
- 47. Parsels LA, Karnak D, Parsels JD, et al. PARP1 trapping and DNA replication stress enhance radiosensitization with combined WEE1 and PARP inhibitors. Mol Cancer Res. 2018;16:222–232. [DOI] [PMC free article] [PubMed] [Google Scholar]
- 48. Colicchia V, Petroni M, Guarguaglini G, et al. PARP inhibitors enhance replication stress and cause mitotic catastrophe in MYCN‐dependent neuroblastoma. Oncogene. 2017;36:4682. [DOI] [PubMed] [Google Scholar]
- 49. De Graaf IAM, Olinga P, De Jager MH, et al. Preparation and incubation of precision‐cut liver and intestinal slices for application in drug metabolism and toxicity studies. Nature Protocols. 2010;5:1540. [DOI] [PubMed] [Google Scholar]
- 50. Sauer UG, Vogel S, Aumann A, et al. Applicability of rat precision‐cut lung slices in evaluating nanomaterial cytotoxicity, apoptosis, oxidative stress, and inflammation. Toxicol Appl Pharmacol. 2014;276:1–20. [DOI] [PubMed] [Google Scholar]
- 51. Drahushuk AT, McGarrigle BP, Tai HL, Kitareewan S, Goldstein JA, Olson JR. Validation of precision‐cut liver slices in dynamic organ culture as an in vitro model for studying CYP1A1 and CYP1A2 induction. Toxicol Appl Pharmacol. 1996;140:393–403. [DOI] [PubMed] [Google Scholar]
Associated Data
This section collects any data citations, data availability statements, or supplementary materials included in this article.
Supplementary Materials
Additional Supporting Information may be found online in the supporting information tab for this article.
Figure S1. Effect of filter support and 3D orbital movement on PCa tissue slice morphology
Figure S2. Correlation between manual counting and automatic counting
Figure S3. TUNEL level in individual PC339 tumor slices.
Figure S4. Ex‐vivo Enzalutamide treatment effect on PC310 tumor
Figure S5. Double staining of Ki67 and EdU