

Abstract
3′‐deoxy‐3′‐[18F]fluorothymidine (18FLT) is a radiopharmaceutical tracer used with positron emission tomography (PET), often in combination with computed tomography (CT), to image DNA synthesis, and thus, cellular proliferation. Characteristic accumulation of the tracer within haematopoietic bone marrow provides a noninvasive means to assess marrow activity and distribution throughout the living animal. The present study utilizes three‐dimensional analysis of 18FLT‐PET/CT scans to quantify the relative skeletal distribution of active marrow by anatomic site in the dog. Scans were performed on six healthy, adult (3–6 years of age), mixed‐breed dogs using a commercially available PET/CT scanner consisting of a 64‐slice helical CT scanner combined with an integrated four ring, high‐resolution LSO PET scanner. Regions of interest encompassing 11 separate skeletal regions (skull, cervical vertebral column, thoracic vertebral column, lumbar vertebral column, sacrum, ribs, sternum, scapulae, proximal humeri, ossa coxarum, and proximal femora) were manually drawn based on CT images and thresholded by standardized uptake value to delineate bone marrow activity. Activity within each skeletal region was then divided by the total skeletal activity to derive the per cent of overall marrow activity within an individual site. The majority of proliferative marrow was located within the vertebral column. Of the sites traditionally accessed clinically for marrow sampling, the proximal humerus contained the largest percentage, followed by the ossa coxarum, proximal femur, and sternum, respectively. This information may be used to guide selection of traditional marrow sampling sites as well as inform efforts to spare important sites of haematopoiesis in radiation therapy planning.
Keywords: bone marrow, computed tomography, dogs, haematopoiesis, positron emission tomography, radiopharmaceuticals
1. INTRODUCTION
Bone marrow is a dynamic organ found throughout the skeleton within the medullary cavities of long bones and the interstices of spongy bone. In the neonate, most of the marrow is active and functions in the formation of blood cells, known as red or haematopoietic marrow. As an animal ages, however, much of the marrow is progressively replaced by fat, particularly in the extremities (Gurevitch, Slavin, & Feldman, 2007). As a result, active marrow is normally restricted to portions of the axial and proximal appendicular skeleton of the adult. Since much of the axial haematopoietic marrow is difficult to access clinically, most diagnostic sampling in veterinary medicine is limited to a few accessible sites within the appendicular portion of the distribution.
Compared to most tissues, haematopoietic marrow is particularly sensitive to radiation toxicity. Doses as low as 2–4 Gy have been shown to be capable of producing reductions of both cellularity (Lehar, Kiely, Pease, & Scanlon, 1966) and proliferation (Everitt et al., 2009). Fractionated doses beyond 30 Gy generally produce permanent ablation (Perez, 2004), but a local fractionated dose of only 18 Gy was sufficient to produce long‐standing cell death in the adjacent vertebral marrow of a dog receiving intensity‐modulated radiation therapy (IMRT) for a primary lung tumour (the lung mass itself received a fractionated total dose of 30 Gy as a palliative therapy protocol) (Ballegeer, Forrest, Jeraj, Mackie, & Nickles, 2006). Although the ultimate clinical impact of bone marrow suppression also depends on volume, the concurrent use of chemotherapy and/or the potential to expose rather large areas of bone marrow to lower radiation doses with techniques like IMRT make detailed knowledge of marrow distribution an important consideration in radiotherapy planning (Hayman et al., 2011).
To date, there are few reports that provide specific information about the overall skeletal distribution of canine haematopoietic marrow, and most available data are several decades old. Existing canine functional marrow distribution data have been based on the uptake of 59Fe and 99mTc‐sulphur colloid by erythroid precursors and reticuloendothelial cells, respectively (Greenberg, Atkins, & Schiffer, 1966). Additionally, local cellularity estimates have been provided based on microscopic examinations of samples collected from several sites throughout the skeleton of euthanized animals (Calvo, Fliedner, Herbst, & Fache, 1975). Unfortunately, both studies appear to be based on relatively young animals; as a result, it is not clear whether their results accurately reflect marrow distribution in the mature dog.
Today, positron emission tomography combined with computed tomography (PET/CT) offers a state‐of‐the‐art method to image and quantify whole‐body bone marrow activity. Compared to other modern techniques like magnetic resonance imaging (MRI), which provides an anatomical approach to imaging marrow distribution based largely on its relative fat and water content (Sebag, Dubois, Tabet, Bonato, & Lallemand, 1993), PET/CT more directly interrogates marrow function by exploiting specific physiologic pathways that mediate the distribution of certain positron‐emitting radiopharmaceuticals. In particular, PET/CT using 3′‐deoxy‐3′‐[18F]fluorothymidine (18FLT) has gained attention in recent years as a powerful tool to analyse marrow proliferation (Agool et al., 2011; Agool, Schot, Jager, & Vellenga, 2006; Ballegeer et al., 2006; Hayman et al., 2011; McGuire et al., 2016; McGuire, Menda, Boles Ponto, et al., 2011; McGuire, Menda, Ponto, et al., 2011; Menda et al., 2010). As a substrate for the pyrimidine salvage pathway of DNA synthesis, 18FLT enters proliferating cells and becomes trapped due to phosphorylation by thymidine kinase 1 (TK1) (Salskov, Tammisetti, Grierson, & Vesselle, 2007; Shields et al., 1998, 2002 ). Although it is not subsequently incorporated into DNA, TK1 expression is tightly regulated to the synthetic phase of the cell cycle, and 18FLT retention in various tumours has generally correlated well with traditional assessments of cellular proliferation (Buck et al., 2008, 2002 ; Chen et al., 2005; Choi et al., 2005; Kenny et al., 2005; Salskov et al., 2007; Wagner et al., 2003). Since the salvage pathway is particularly robust in haematopoietic marrow due to the recovery of DNA liberated by red blood cell enucleation (Muzi et al., 2005), 18FLT‐PET/CT is especially well‐suited for assessing the distribution of proliferating marrow.
Using existing whole‐body 18FLT‐PET/CT scans from normal dogs, the present study seeks to analyse uptake within the marrow compartment to quantify the relative distribution of active marrow throughout the skeleton by anatomical site. This information will provide updated distribution data for the adult dog, and may be used to improve bone marrow sparing efforts during radiotherapy planning or to inform clinical selection of sampling sites for aspirates and biopsies.
2. MATERIALS AND METHODS
18FLT‐PET/CT scans from six adult, University of Tennessee‐maintained, research dogs were utilized to gather data on proliferative bone marrow distribution. All scans were performed in accordance with a University of Tennessee Institutional Animal Care and Use Committee (IACUC)‐approved protocol. The dogs that were imaged ranged in age from 3 to 6 years (mean = 4.67 years), weighed between 15.45 and 25.91 kg (mean = 19.09 kg), and included one intact male, one castrated male, and four spayed females. Routine history records as well as results of physical examination, haematology, clinical chemistry panels, and whole‐body CT imaging were evaluated to verify that the animals had no underlying adverse health conditions.
All scans were performed in ventral recumbency under general anaesthesia to facilitate immobilization. As part of this protocol, animals were fasted for a minimum of 12 hr prior to placement of an intravenous catheter within a peripheral vein and subsequent intravenous injection of acepromazine (0.025–0.05 mg/kg) and butorphanol (0.2–0.4 mg/kg) for sedation and either 146.34 ± 0.26 MBq 18FLT (mean ± SD; 2 animals) or 66.88 ± 9.98 MBq 18FLT (mean ± SD; 4 animals). The 18FLT injected was produced on‐site by the radiochemistry laboratory of the Molecular Imaging and Translational Research Program at the University of Tennessee Graduate School of Medicine in accordance with previously published methods (Akula et al., 2010; Collier, Kabalka, & Akula, 2011) and was verified by high‐performance liquid chromatography to be >99% radiochemically pure with acceptable endotoxin level prior to injection. Following an uptake period of 77.10 ± 12.83 min (mean ± standard deviation [SD]), during which animals were confined to a small cage, general anaesthesia was induced via intravenous bolus of propofol (≤4 mg/kg) followed by maintenance with inhaled isoflurane.
Scans were performed on a Biograph mCT (Siemens Healthineers, Knoxville, TN), which combines a 64‐slice helical CT scanner with a high‐resolution LSO PET scanner within a single gantry. Sequential CT and PET imaging were performed with no alteration in subject positioning. CT scans were performed at 120 kVp using Care Dose™ with a reference value of 150 mAs with a 0.8 pitch and 0.6 mm acquisition slice width reconstructed to 2.5 mm slice thicknesses for image analysis. PET imaging was performed using 9–11 bed positions in order to encompass the entire body of the dogs with data acquired for 3 min per bed position. PET reconstruction utilized CT data for attenuation correction and was performed using the TrueX algorithm (Siemens Healthineers, Knoxville, TN) with 3 iterations and 12 subsets resulting in a reconstructed pixel size of 4.07 × 4.07 mm. Data were normalized and corrected for dead time, scatter, and radioactive decay.
After scanning, animals were returned to their cages for recovery and transportation to a University of Tennessee IACUC‐approved satellite holding facility for radioactive animals, where their catheters were removed and they were held until cleared of residual radioactivity (≤51.6 nanocoulombs per kilogram of air [0.2 milliroentgens] per hour at 1 metre distance) the following day (the half‐life of 18F is 109.8 min). Once cleared, the dogs were returned to their original housing unit.
Regions of interest (ROIs) encompassing 11 separate skeletal sites (skull, cervical vertebral column, thoracic vertebral column, lumbar vertebral column, sacrum, ribs, sternum, scapulae, proximal humeri, ossa coxarum, and proximal femora) were defined by a veterinary anatomist trained in molecular imaging analysis using dedicated analysis software (Inveon Research Workplace v3.0, Siemens Healthineers, Knoxville, TN). For each skeletal region, a three‐dimensional ROI was initially drawn using CT image data with care taken to precisely follow anatomical boundaries in all image planes. Once the ROI was confirmed to encompass the entire skeletal region and exclude neighbouring skeletal sites, co‐registered PET data were utilized to tailor the ROI based on standardized uptake value (SUV). A minimum SUV threshold of 2.0 was employed based on biodistribution data and visual assessment to limit the ROI to bone marrow activity and exclude counts from surrounding tissues (a representative image of thresholded vertebral ROIs is depicted in Figure 1). Tracer activity was measured within each thresholded ROI and divided by total skeletal activity to derive the per cent of marrow activity within each skeletal site.
Figure 1.
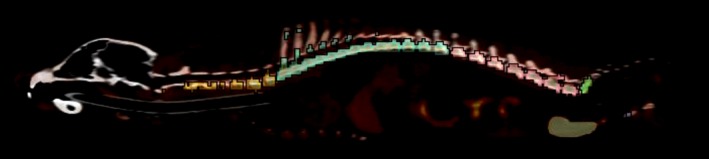
Sagittal plane image depicting canine vertebral column regions of interest. Cervical (yellow), thoracic (teal), lumbar (pink), and sacral (green) regions are shown
3. RESULTS
The relative percentage of proliferative bone marrow by anatomical region is illustrated in Figure 2 and compared with existing data from dogs and humans in Table 1. The measured mean ± SD percentage of active marrow by skeletal site was 5.74 ± 1.08 for the scapulae, 10.10 ± 3.81 for the humeri, 3.98 ± 1.80 for the femora, 6.76 ± 1.03 for the ossa coxarum, 4.08 ± 0.68 for the sacrum, 19.65 ± 2.27 for the lumbar vertebral column, 32.08 ± 3.72 for the thoracic vertebral column, 9.59 ± 2.11 for the cervical vertebral column, 0.22 ± 0.19 for the skull, 2.67 ± 1.00 for the sternum, and 5.14 ± 2.10 for the ribs. Percentages listed for bilateral structures are summed.
Figure 2.
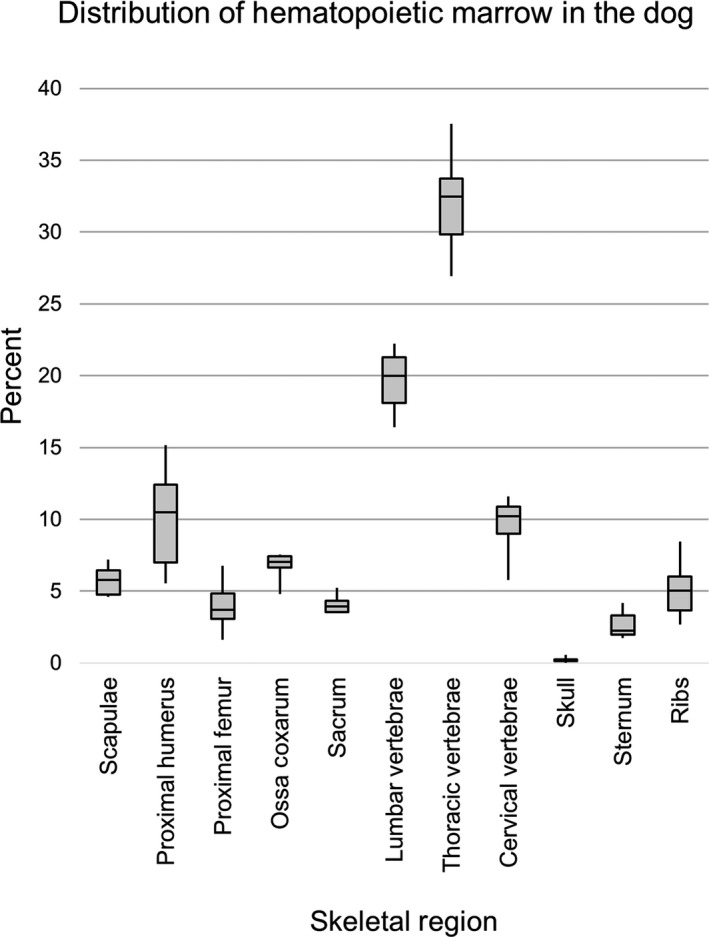
Box plots showing percentage distribution of proliferative bone marrow by skeletal site in the adult dog (n = 6)
Table 1.
Comparison of percentages of total bone marrow activity by skeletal site based on measurements of cellular proliferation (18FLT), erythropoiesis (59Fe), or reticuloendothelial function (99mTc‐sulphur colloid) in dogs and humans
| Skeletal site | Dog | Human | ||
|---|---|---|---|---|
| 18FLT (mean ± SD) | 59Fe (mean ± SD) | 99mTc‐sulphur colloid (mean ± SD) | 18FLT (mean ± SD) | |
| Scapulae | 5.74 ± 1.08 | 5.08 ± 0.75 | 4.48 ± 0.84 | 3.8 ± 0.9 |
| Proximal humeri | 10.10 ± 3.81 | 10.82 ± 1.18 a | 12.15 ± 0.15 a | 1.9 ± 1.2 |
| Proximal femora | 3.98 ± 1.80 | 7.20 ± 1.15 b | 8.20 ± 2.15 b | 4.5 ± 2.5 |
| Ossa coxarum | 6.76 ± 1.03 | 8.89 ± 1.21 | 8.87 ± 1.15 | 25.3 ± 4.9 |
| Sacrum | 4.08 ± 0.68 | 3.09 ± 0.67 | 3.01 ± 0.67 | 9.2 ± 2.3 |
| Lumbar vertebrae | 19.65 ± 2.27 | 14.99 ± 3.07 | 14.33 ± 3.57 | 16.6 ± 2.2 |
| Thoracic vertebrae | 32.08 ± 3.72 | 17.60 ± 1.25 | 16.92 ± 1.13 | 19.9 ± 2.6 |
| Cervical vertebrae | 9.59 ± 2.11 | 6.71 ± 1.07 | 6.53 ± 1.15 | 4.3 ± 1.6 |
| Skull | 0.22 ± 0.19 | 0.97 ± 0.54 | 1.25 ± 0.52 | 2.9 ± 2.1 |
| Sternum | 2.67 ± 1.00 | 2.79 ± 0.67 | 2.73 ± 0.67 | 2.9 ± 1.3 |
| Ribs | 5.14 ± 2.10 | 20.54 ± 1.70 | 18.71 ± 2.33 | 8.8 ± 4.7 c |
59Fe and 99mTc‐sulphur colloid distribution in dogs from Greenberg et al. (1966). 18FLT distribution in humans from Hayman et al. (2011).
SD: standard deviation.
aPercentages reported include entire extent of the humeri, although the authors specify that the majority of activity was concentrated in the proximal one‐third of the bone. bPercentages reported include entire extent of the femur, including observed activity within the distal aspect of the bone. No such activity was observed in the distal femur in the present study. cPercentage reported includes ribs and clavicles in humans.
Appendicular proliferative marrow did not extend beyond the proximal aspects of the humeri or femora in any of the scans included in this study. Specifically, humeral activity was limited to the head and proximal one‐third of the diaphysis; scapular activity was most prominent within the ventral angle near the glenoid cavity; femoral activity was concentrated near the head, neck, and greater trochanter; and activity within the ossa coxarum was most conspicuous within the ilium near the acetabulum. Within the axial skeleton, marrow activity was particularly robust within vertebral bodies throughout the cervical, thoracic, lumbar, and sacral regions (with some activity also present within vertebral arches and spinous processes, especially within the lumbar and cranial thoracic regions, respectively); fairly uniform throughout the sternum; concentrated near the vertebral articulations within the ribs; and minimal and concentrated caudally within the skull. Although some variability was observed between individuals, this pattern of distribution was generally consistent among the animals included in this study, with no obvious differences that could be definitively attributed to imaging protocol, age, size, sex, or alteration status.
Representative dorsal, lateral, and oblique 3‐dimensional images highlighting the overall skeletal distribution of marrow activity in the dog are depicted in Figure 3.
Figure 3.
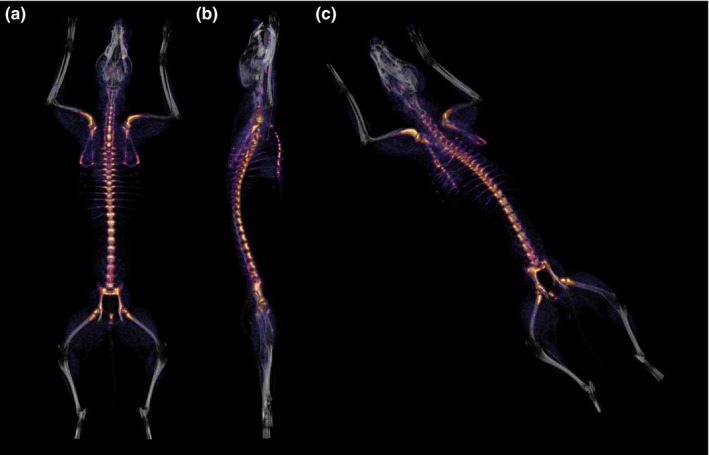
Representative dorsal (a), lateral (b), and oblique (c) 3‐dimensional fused positron emission tomography/computed tomography (PET/CT) images highlighting uptake of 3′‐deoxy‐3′‐[18F]fluorothymidine (18FLT) by haematopoietic marrow. Brightly‐coloured areas represent the skeletal distribution of proliferating marrow in the adult dog
4. DISCUSSION
The relative skeletal distribution of proliferating marrow determined by 18FLT‐PET/CT reflects what would be expected in an adult animal, with the bulk of marrow activity concentrated along the axis of the trunk and adjacent limb bones. When compared with the previous description by Greenberg et al. (1966), as in Table 1, several similarities are observed. Notably, the relative distribution based on 18FLT uptake was within approximately 2% of the previous estimates determined by 59Fe and/or 99mTC‐sulphur colloid for the scapulae, humeri, sacrum, skull, and sternum. Further, all three methods indicate that roughly 10% of total skeletal marrow activity lies within the proximal aspect of the humerus, one of the most commonly and easily accessible marrow sampling sites in veterinary species. Relative distribution was somewhat lower in other common sampling sites, such as the iliac crest and proximal femur, suggesting that sampling from the proximal humerus might be preferable in the dog. Larger differences were observed for other sites, with distribution comparatively biased towards the vertebral column and away from the ossa coxarum, femora, and ribs of the animals included in the present study. The disparity was most conspicuous in the measurements of the ribs and thoracic vertebral column, where estimates using 18FLT were approximately 15% lower or higher in the present study, respectively.
Despite a paucity of information about marrow conversion age with respect to specific skeletal sites in the dog, MRI studies suggest that conversion in the distal femur likely occurs between 1 and 3 years of age (Armbrust, Hoskinson, Biller, & Wilkerson, 2004; Armbrust, Ostmeyer, & McMurphy, 2008; Konar, 2004; Martig, Boisclair, Konar, Spreng, & Lang, 2007). Although age was not reported by Greenberg et al. (1966), marrow activity was described in the distal femora and proximal tibiae. It is therefore probable that the animals used were somewhat younger than those described herein and may have still been undergoing marrow conversion. All of the dogs imaged by 18FLT were greater than 3 years of age and none displayed similar uptake near the genual joint. While this likely explains the differences in femoral measurements, it is unclear the extent to which age‐related conversion explains the discrepancies between the measurements of the ribs or the ossa coxarum, a site that generally maintains the presence of red marrow despite advanced age (Armbrust et al., 2004; Ricci et al., 1990). Further studies imaging dogs of progressive ages are needed to define the pattern and timing of marrow conversion in the canine.
Although comparisons between species should be considered with caution, it is interesting to compare the present canine percentages with those determined in humans using similar technology. A 2011 study by Hayman et al. used 18FLT‐PET/CT scans from 13 human cancer patients to describe relative skeletal distribution of haematopoietic marrow in much the same way as presented herein. The results of this study are included in Table 1. While general trends were similar between our measurements of the dog and those of the human, only the mean values for the femoral, scapular, and sternal anatomical sites were within 2% of one another. Our results indicate that the dog has a greater percentage of active marrow within the humerus and cervical, thoracic, and lumbar portions of the vertebral column, but a relatively smaller percentage within the skull, sacrum, ribs, and ossa coxarum. The ribs and clavicles were grouped in the human data, likely explaining some of the difference observed since the canine clavicle is extremely small and was therefore not included in our assessments. Interestingly, the difference measured between the ossa coxarum of the two species was rather large at approximately 18.5% (6.76% vs. 25.3% in the dog and human, respectively). It is probable that differences in the anatomical proportions of the various sites explain much of the variation between the two species.
These data have several potential limitations. First, the small sample size consisted of only six scans, all of which were from mixed‐breed dogs of moderate age. Consequently, analysis was limited to basic descriptive statistics and the ability to examine potential factors which may influence bone marrow distribution, such as body size, sex, alteration status, breed, or life stage, was limited. Second, two separate 18FLT dosage protocols were implemented for the scans utilized in this study (the dosage protocol was reduced to facilitate scanning of multiple animals per day once it was learned that a lower dose still produced favourable image quality when limited yield of the tracer from the radiochemistry laboratory necessitated scanning with the smaller dose). Although imaging characteristics (e.g., visualized uptake, measured SUVs, and relative bone marrow distribution) were similar between scans utilizing both protocols in the present study, additional scans using a variety of dosage protocols, preferably in a larger sample of animals, would be required to definitively determine any subtle effects that might occur with alterations in 18FLT dosage. Finally, ROIs were drawn to exclude adjacent soft tissues and neighbouring skeletal sites. As a result, partial volume effects (PVE) may have influenced activity measurements between adjoining sites or within very small ROIs due to spillover of imaged activity and averaging within voxels. PVE typically occur whenever an object is less than 2–3 times the full width at half maximum (FWHM) of the reconstructed image resolution (Hoffman, Huang, & Phelps, 1979; Hoffman, Huang, Plummer, & Phelps, 1982; Kessler, Ellis, & Eden, 1984; Soret, Bacharach, & Buvat, 2007). The influence of PVE was likely minimal for most skeletal regions described, but evaluations of relative distribution in narrow or small regions of uptake, like the ribs or skull, may have been underestimated due to this effect.
Despite any potential limitations of this study, 18FLT‐PET/CT provides a robust, whole‐body assessment of proliferative activity within the marrow compartment. The relative distribution data reported herein provide a modern estimate of marrow activity by skeletal site for the adult dog based on functional imaging of cellular proliferation. This information should assist planning, both by radiation oncologists aiming to avoid important sites of proliferative marrow and by clinicians choosing sites that are most likely to yield high‐quality samples for diagnostic testing.
CONFLICT OF INTEREST
The University of Tennessee maintains research collaborations with Siemens Healthineers.
Rowe JA, Morandi F, Osborne DR, et al. Relative skeletal distribution of proliferating marrow in the adult dog determined using 3′‐deoxy‐3′‐[18F]fluorothymidine. Anat Histol Embryol. 2019;48:46–52. 10.1111/ahe.12410
REFERENCES
- Agool, A. , Schot, B. W. , Jager, P. L. , & Vellenga, E. (2006). 18F‐FLT PET in hematologic disorders: A novel technique to analyze the bone marrow compartment. Journal of Nuclear Medicine, 47(10), 1592–1598. 47/10/1592 [pii] [PubMed] [Google Scholar]
- Agool, A. , Slart, R. H. , Kluin, P. M. , de Wolf, J. T. , Dierckx, R. A. , & Vellenga, E. (2011). F‐18 FLT PET: A noninvasive diagnostic tool for visualization of the bone marrow compartment in patients with aplastic anemia: A pilot study. Clinical Nuclear Medicine, 36(4), 286–289. 10.1097/RLU.0b013e31820aa1a1 [DOI] [PubMed] [Google Scholar]
- Akula, M. , Collier, T. , Kabalka, G. , Wall, J. , Kennel, S. , Stuckey, A. , & LeBlanc, A. (2010). Microfluidic synthesis of [18F]FLT. Journal of Nuclear Medicine, 51(Suppl. 2), 1473. [Google Scholar]
- Armbrust, L. J. , Hoskinson, J. J. , Biller, D. S. , & Wilkerson, M. (2004). Low‐field magnetic resonance imaging of bone marrow in the lumbar spine, pelvis, and femur in the adult dog. Veterinary Radiology & Ultrasound, 45(5), 393–401. 10.1111/j.1740-8261.2004.04071.x [DOI] [PubMed] [Google Scholar]
- Armbrust, L. J. , Ostmeyer, M. , & McMurphy, R. (2008). Magnetic resonance imaging of bone marrow in the pelvis and femur of young dogs. Veterinary Radiology & Ultrasound, 49(5), 432–437. 10.1111/j.1740-8261.2008.00402.x [DOI] [PubMed] [Google Scholar]
- Ballegeer, E. A. , Forrest, L. J. , Jeraj, R. , Mackie, T. R. , & Nickles, R. J. (2006). PET/CT following intensity‐modulated radiation therapy for primary lung tumor in a dog. Veterinary Radiology & Ultrasound, 47(2), 228–233. 10.1111/j.1740-8261.2006.00132.x [DOI] [PubMed] [Google Scholar]
- Buck, A. K. , Bommer, M. , Juweid, M. E. , Glatting, G. , Stilgenbauer, S. , Mottaghy, F. M. , … Reske, S. N. (2008). First demonstration of leukemia imaging with the proliferation marker 18F‐fluorodeoxythymidine. Journal of Nuclear Medicine, 49(11), 1756–1762. 10.2967/jnumed.108.055335 [DOI] [PubMed] [Google Scholar]
- Buck, A. K. , Schirrmeister, H. , Hetzel, M. , Von Der Heide, M. , Halter, G. , Glatting, G. , … Neumaier, B. (2002). 3‐deoxy‐3‐[18F]fluorothymidine‐positron emission tomography for noninvasive assessment of proliferation in pulmonary nodules. Cancer Research, 62(12), 3331–3334. [PubMed] [Google Scholar]
- Calvo, W. , Fliedner, T. M. , Herbst, E. W. , & Fache, I. (1975). Regeneration of blood‐forming organs after autologous leukocyte transfusion in lethally irradiated dogs. I. Distribution and cellularity of the bone marrow in normal dogs. Blood, 46(3), 453–457. [PubMed] [Google Scholar]
- Chen, W. , Cloughesy, T. , Kamdar, N. , Satyamurthy, N. , Bergsneider, M. , Liau, L. , … Silverman, D. H. (2005). Imaging proliferation in brain tumors with 18F‐FLT PET: Comparison with 18F‐FDG. Journal of Nuclear Medicine, 46(6), 945–952. [PubMed] [Google Scholar]
- Choi, S. J. , Kim, J. S. , Kim, J. H. , Oh, S. J. , Lee, J. G. , Kim, C. J. , … Moon, D. H. (2005). [18F]3′‐deoxy‐3′‐fluorothymidine PET for the diagnosis and grading of brain tumors. European Journal of Nuclear Medicine and Molecular Imaging, 32(6), 653–659. 10.1007/s00259-004-1742-3 [DOI] [PubMed] [Google Scholar]
- Collier, T. , Kabalka, G. , & Akula, M. (2011). Sequential preparation of two different PET radiotracers employing the Advion NanoTek synthesis system. Journal of Nuclear Medicine, 52(suppl. 1), 289. [Google Scholar]
- Everitt, S. , Hicks, R. J. , Ball, D. , Kron, T. , Schneider‐Kolsky, M. , Walter, T. , … Mac Manus, M. (2009). Imaging cellular proliferation during chemo‐radiotherapy: A pilot study of serial 18F‐FLT positron emission tomography/computed tomography imaging for non–small‐cell lung cancer. International Journal of Radiation Oncology Biology Physics, 75(4), 1098–1104. 10.1016/j.ijrobp.2008.12.039 [DOI] [PubMed] [Google Scholar]
- Greenberg, M. L. , Atkins, H. L. , & Schiffer, L. M. (1966). Erythropoietic and reticuloendothelial function in bone marrow in dogs. Science, 152(3721), 526–528. [DOI] [PubMed] [Google Scholar]
- Gurevitch, O. , Slavin, S. , & Feldman, A. G. (2007). Conversion of red bone marrow into yellow – Cause and mechanisms. Medical Hypotheses, 69(3), 531–536. 10.1016/j.mehy.2007.01.052 [DOI] [PubMed] [Google Scholar]
- Hayman, J. A. , Callahan, J. W. , Herschtal, A. , Everitt, S. , Binns, D. S. , Hicks, R. J. , & Mac Manus, M. (2011). Distribution of proliferating bone marrow in adult cancer patients determined using FLT‐PET imaging. International Journal of Radiation Oncology, Biology, Physics, 79(3), 847–852. 10.1016/j.ijrobp.2009.11.040 [DOI] [PubMed] [Google Scholar]
- Hoffman, E. J. , Huang, S. C. , & Phelps, M. E. (1979). Quantitation in positron emission computed tomography: 1. Effect of object size. Journal of Computer Assisted Tomography, 3(3), 299–308. 10.1097/00004728-197906000-00001 [DOI] [PubMed] [Google Scholar]
- Hoffman, E. J. , Huang, S. C. , Plummer, D. , & Phelps, M. E. (1982). Quantitation in positron emission computed tomography: 6. Effect of nonuniform resolution. Journal of Computer Assisted Tomography, 6(5), 987–999. 10.1097/00004728-198210000-00022 [DOI] [PubMed] [Google Scholar]
- Kenny, L. M. , Vigushin, D. M. , Al‐Nahhas, A. , Osman, S. , Luthra, S. K. , Shousha, S. , … Aboagye, E. O. (2005). Quantification of cellular proliferation in tumor and normal tissues of patients with breast cancer by [18F]fluorothymidine‐positron emission tomography imaging: Evaluation of analytical methods. Cancer Research, 65(21), 10104–10112. 10.1158/0008-5472.CAN-04-4297 [DOI] [PubMed] [Google Scholar]
- Kessler, R. M. , Ellis, J. R. Jr , & Eden, M. (1984). Analysis of emission tomographic scan data: Limitations imposed by resolution and background. Journal of Computer Assisted Tomography, 8(3), 514–522. 10.1097/00004728-198406000-00028 [DOI] [PubMed] [Google Scholar]
- Konar, M. L. J. (2004). Age‐related changes in MR appearance of normal bone marrow in canine stifle joints. Abstracts from the annual conference of the European Association of Veterinary Diagnostic Imaging. Veterinary Radiology & Ultrasound, 45(6), 586–613. [Google Scholar]
- Lehar, T. J. , Kiely, J. M. , Pease, G. L. , & Scanlon, P. W. (1966). Effect of focal irradiation on human bone marrow. American Journal of Roentgenology, 96(1), 183–190. 10.2214/ajr.96.1.183 [DOI] [PubMed] [Google Scholar]
- Martig, S. , Boisclair, J. , Konar, M. , Spreng, D. , & Lang, J. (2007). MRI characteristics and histology of bone marrow lesions in dogs with experimentally induced osteoarthritis. Veterinary Radiology & Ultrasound, 48(2), 105–112. 10.1111/j.1740-8261.2007.00213.x [DOI] [PubMed] [Google Scholar]
- McGuire, S. M. , Bhatia, S. K. , Sun, W. , Jacobson, G. M. , Menda, Y. , Ponto, L. L. , … Buatti, J. M. (2016). Using [18F]fluorothymidine imaged with positron emission tomography to quantify and reduce hematologic toxicity due to chemoradiation therapy for pelvic cancer patients. International Journal of Radiation Oncology, Biology, Physics, 96(1), 228–239. 10.1016/j.ijrobp.2016.04.009 [DOI] [PMC free article] [PubMed] [Google Scholar]
- McGuire, S. M. , Menda, Y. , Boles Ponto, L. L. , Gross, B. , Buatti, J. , & Bayouth, J. E. (2011). 3′‐deoxy‐3′‐[18F]fluorothymidine PET quantification of bone marrow response to radiation dose. International Journal of Radiation Oncology, Biology, Physics, 81(3), 888–893. 10.1016/j.ijrobp.2010.12.009 [DOI] [PMC free article] [PubMed] [Google Scholar]
- McGuire, S. M. , Menda, Y. , Ponto, L. L. , Gross, B. , Juweid, M. , & Bayouth, J. E. (2011). A methodology for incorporating functional bone marrow sparing in IMRT planning for pelvic radiation therapy. Radiotherapy and Oncology, 99(1), 49–54. 10.1016/j.radonc.2011.01.025 [DOI] [PubMed] [Google Scholar]
- Menda, Y. , Ponto, L. L. , Dornfeld, K. J. , Tewson, T. J. , Watkins, G. L. , Gupta, A. K. , … Buatti, J. M. (2010). Investigation of the pharmacokinetics of 3′‐deoxy‐3′‐[18F]fluorothymidine uptake in the bone marrow before and early after initiation of chemoradiation therapy in head and neck cancer. Nuclear Medicine and Biology, 37(4), 433–438. 10.1016/j.nucmedbio.2010.02.005 [DOI] [PMC free article] [PubMed] [Google Scholar]
- Muzi, M. , Vesselle, H. , Grierson, J. R. , Mankoff, D. A. , Schmidt, R. A. , Peterson, L. , … Krohn, K. A. (2005). Kinetic analysis of 3′‐deoxy‐3′‐fluorothymidine PET studies: Validation studies in patients with lung cancer. Journal of Nuclear Medicine, 46(2), 274–282. [PubMed] [Google Scholar]
- Perez, C. A. (2004). Principles and practice of radiation oncology (4th ed.). Philadelphia: Lippincott Williams & Wilkins. [Google Scholar]
- Ricci, C. , Cova, M. , Kang, Y. S. , Yang, A. , Rahmouni, A. , Scott, W. W. Jr , & Zerhouni, E. A. (1990). Normal age‐related patterns of cellular and fatty bone marrow distribution in the axial skeleton: MR imaging study. Radiology, 177(1), 83–88. 10.1148/radiology.177.1.2399343 [DOI] [PubMed] [Google Scholar]
- Salskov, A. , Tammisetti, V. S. , Grierson, J. , & Vesselle, H. (2007). FLT: Measuring tumor cell proliferation in vivo with positron emission tomography and 3′‐deoxy‐3′‐[18F]fluorothymidine. Seminars in Nuclear Medicine, 37(6), 429–439. 10.1053/j.semnuclmed.2007.08.001 [DOI] [PubMed] [Google Scholar]
- Sebag, G. H. , Dubois, J. , Tabet, M. , Bonato, A. , & Lallemand, D. (1993). Pediatric spinal bone marrow: Assessment of normal age‐related changes in the MRI appearance. Pediatric Radiology, 23(7), 515–518. 10.1007/BF02012134 [DOI] [PubMed] [Google Scholar]
- Shields, A. F. , Grierson, J. R. , Dohmen, B. M. , Machulla, H. J. , Stayanoff, J. C. , Lawhorn‐Crews, J. M. , … Mangner, T. J. (1998). Imaging proliferation in vivo with [F‐18]FLT and positron emission tomography. Nature Medicine, 4(11), 1334–1336. 10.1038/3337 [DOI] [PubMed] [Google Scholar]
- Shields, A. F. , Grierson, J. R. , Muzik, O. , Stayanoff, J. C. , Lawhorn‐Crews, J. M. , Obradovich, J. E. , & Mangner, T. J. (2002). Kinetics of 3′‐deoxy‐3′‐[F‐18]fluorothymidine uptake and retention in dogs. Molecular Imaging & Biology, 4(1), 83–89. 10.1016/S1095-0397(01)00070-X [DOI] [PubMed] [Google Scholar]
- Soret, M. , Bacharach, S. L. , & Buvat, I. (2007). Partial‐volume effect in PET tumor imaging. Journal of Nuclear Medicine, 48(6), 932–945. 10.2967/jnumed.106.035774 [DOI] [PubMed] [Google Scholar]
- Wagner, M. , Seitz, U. , Buck, A. , Neumaier, B. , Schultheiss, S. , Bangerter, M. , … Reske, S. N. (2003). 3′‐[18F]fluoro‐3′‐deoxythymidine ([18F]‐FLT) as positron emission tomography tracer for imaging proliferation in a murine B‐Cell lymphoma model and in the human disease. Cancer Research, 63(10), 2681–2687. [PubMed] [Google Scholar]