

Abstract
Bile duct ligation (BDL) is an experimental procedure that mimics obstructive cholestatic disease. One of the early consequences of BDL in rodents is the appearance of so‐called bile infarcts that correspond to Charcot‐Gombault necrosis in human cholestasis. The mechanisms causing bile infarcts and their pathophysiological relevance are unclear. Therefore, intravital two photon–based imaging of BDL mice was performed with fluorescent bile salts (BS) and non‐BS organic anion analogues. Key findings were followed up by matrix‐assisted laser desorption ionization imaging, clinical chemistry, immunostaining, and gene expression analyses. In the acute phase, 1‐3 days after BDL, BS concentrations in bile increased and single‐cell bile microinfarcts occurred in dispersed hepatocytes throughout the liver caused by the rupture of the apical hepatocyte membrane. This rupture occurred after loss of mitochondrial membrane potential, followed by entry of bile, cell death, and a “domino effect” of further death events of neighboring hepatocytes. Bile infarcts provided a trans‐epithelial shunt between bile canaliculi and sinusoids by which bile constituents leaked into blood. In the chronic phase, ≥21 days after BDL, uptake of BS tracers at the sinusoidal hepatocyte membrane was reduced. This contributes to elevated concentrations of BS in blood and decreased concentrations in the biliary tract. Conclusion: Bile microinfarcts occur in the acute phase after BDL in a limited number of dispersed hepatocytes followed by larger infarcts involving neighboring hepatocytes, and they allow leakage of bile from the BS‐overloaded biliary tract into blood, thereby protecting the liver from BS toxicity; in the chronic phase after BDL, reduced sinusoidal BS uptake is a dominant protective factor, and the kidney contributes to the elimination of BS until cholemic nephropathy sets in.
Abbreviations
- Abcb11
adenosine triphosphate–binding cassette, subfamily B, member 11
- ALT
alanine aminotransferase
- AP
alkaline phosphatase
- AST
aspartate aminotransferase
- ATP
adenosine triphosphate
- BDL
bile duct ligation
- BS
bile salts
- CD45
cluster of differentiation 45
- CDCA
chenodeoxycholic acid
- CK‐19
cytokeratin‐19
- CLF
cholyl‐lysyl‐fluorescein
- CMF
5‐chloromethylfluorescein
- CMFDA
CMF diacetate
- Ly6G
lymphocyte antigen 6 complex locus G
- MALDI
matrix‐assisted laser desorption ionization
- Mdr2
multidrug resistance gene 2
- MRP
multidrug resistance–associated protein
- Ntcp
Na+‐taurocholate cotransporting polypeptide
- OATP
organic ion transporting polypeptide
- PI
propidium iodide
- Slc10a1
solute carrier family 10, member a1
- TMRE
tetramethylrhodamine ethyl ester
Recently, the concept of an ascending pathophysiology of cholestatic liver disease has been proposed, whereby lesions start in large or small bile ducts followed by the involvement of upstream structures, such as the bile canalicular network and liver parenchyma.1 Our knowledge of the responses of the biliary tree to cholestasis stems mainly from studies in rodents after bile duct ligation (BDL). BDL in mice or rats cannot fully recapitulate human cholestatic liver diseases, such as primary biliary cholangitis (PBC) or primary sclerosing cholangitis (PSC).1, 2 A major difference is the total disruption of biliary flux after BDL, which is not the case in PBC or PSC. Nevertheless, BDL in rodents shows numerous key features of human obstructive cholestatic disease, such as periportal fibrosis and increased concentrations of bile salts (BS) in blood. In rodents and humans BS and bilirubin concentrations decrease upon chronic cholestasis.1, 3 In humans this phenomenon is known as “white” (colorless) bile after prolonged bile duct obstruction.
The biliary tree can be differentiated into three domains that respond differently to BDL. Large bile ducts predominantly respond with increased diameters, which enhances their capacity to accommodate biliary fluids.1 Further upstream, interlobular bile ducts undergo extensive remodeling, characterized by corrugation of their inner surface, branching, and rejoining, whereby a sparse mesh of bile ducts is transformed to a denser mesh.4 In contrast to the large bile ducts, no major changes in the diameter of interlobular bile ducts are observed.4 The adaptation of the interlobular bile ducts serves to maximize their inner surface, thus increasing their absorptive capacity. The most upstream domain of the biliary tree is the canalicular network, which shows no major topological changes but responds with an increase in the average diameter.1 A further consequence of BDL is the formation of lesions termed “bile infarcts,”5 which are aggravated when ursodeoxycholic acid is fed to BDL mice.6 The term “bile infarct” indicates fields of necrotic hepatocytes in a cholestatic liver probably caused by a breach of the bile‐to‐blood barrier. It was first described in 1887 by Jean‐Martin Charcot and Albert Gombault, also known as Charcot‐Gombault necrosis as a complication of cholestasis.7 In contrast to other organs, where infarcts define a localized area of dead or dying tissue that has been deprived of its blood supply, bile infarcts of the liver are necrotic because of bile leakage.
Currently, the causal relationship between the aforementioned observations remains unclear. Do widened bile canaliculi predispose to bile leakage and infarct formation at the hepatocyte level? Why do bile infarcts only occur in the acute phase of cholestasis and disappear later? And, finally, why do BS concentrations decrease in the biliary tract despite a complete interruption of bile flux by BDL? In the present study, a recently established two photon–based imaging technique employing fluorescent BS tracers8 revealed that widening of bile canaliculi precedes rupturing in the acute phase after BDL, followed by the release of canalicular bile into hepatocytes and into the sinusoidal blood. This decreases the initially strongly elevated BS concentrations in bile canaliculi. In the chronic phase, the net BS uptake by hepatocytes from sinusoidal blood is strongly decreased, which contributes to low BS concentrations in the biliary tract and increased concentrations in blood.
Materials and Methods
Mice, BDL, Bile Flow Measurement, Sample Collection, and Histology
A detailed description including graphical material is given in the Supporting Information. Male C57BL/6N mice, 8‐10 weeks old, and 18‐week‐old multidrug resistance gene 2 knockout (Mdr2–/–) mice as well as age‐matched controls were used. All experiments were approved by the local animal protection agency. BDL was performed in C57BL/6N mice according to the method of Tag et al.9 Sample collection, histopathology, immunostaining, and bile flow measurement are described in the Supporting Information.
Intravital Two Photon–Based Imaging
Intravital imaging of mouse livers was performed under anesthesia using a custom‐modified inverted LSM MP7 according to the method of Reif et al.,8 as described in the Supporting Information. The mice received tail vein bolus injections of the following fluorescent dyes: Hoechst 33258, tetramethylrhodamine ethylester (TMRE), and propidium iodide (PI). In addition, tail vein catheters were applied and used for intravenous injection of cholyl‐lysyl‐fluorescein (CLF), 5‐chloromethylfluorescein diacetate (CMFDA), or amidofluorescein coupled to chenodeoxycholic acid (CDCA) through an amide linkage (chenodeoxycholylfluorescin). Leukocytes were visualized by tail vein injection of phycoerythrin‐coupled anti–cluster of differentiation 45 (CD45) antibody and neutrophils by anti–lymphocyte antigen 6 complex locus G (Ly6G). For all experimental scenarios shown in the figures at least three mice were analyzed. While the main text shows only still photographs taken from one representative video, all available videos have been compiled under https://image.ifado.de/. Image analysis of two‐photon videos is described in detail in the Supporting Information.
Matrix‐Assisted Laser Desorption Ionization–Mass Spectrometry Imaging of Mouse Liver
Frozen mouse liver tissue samples from the median lobe were fixed with an optimal cutting temperature‐freezing medium. Two adjacent 3‐ to 5‐µm‐thick liver tissue sections were prepared, one for matrix‐assisted laser desorption ionization (MALDI) imaging and the other for cytokeratin‐19 (CK‐19) immunostaining. The MALDI images were superimposed with the CK‐19‐stained images. Details of MALDI–mass spectrometry imaging are given in the Supporting Information.
RNA Expression and Biochemical Analyses
Whole‐genome analysis of gene expression in mouse liver after BDL or sham operation was performed with Affymetrix gene arrays as described in the Supporting Information. Quantitative RT‐PCR analysis was performed using custom‐designed TaqMan assays. A detailed description of measurement of alanine aminotransferase (ALT), aspartate aminotransferase (AST), and alkaline phosphatase (AP) activities as well as BS, urea, and creatinine concentrations is given in the Supporting Information.
Statistical Analysis
Statistical analysis was performed using SPSS version 24 software. An independent samples t test was used. P < 0.05 was considered statistically significant.
Results
Bile Infarcts and Reduced Sinusoidal BS Uptake
A prominent acute consequence of BDL in liver tissue was the formation of bile infarcts (Fig. 1A). Tracking of the appearance of these bile infarcts up to 21 days after BDL showed that they first appeared on day 1 as dead cell areas of varying sizes (Fig. 1A). The infarct size was maximal on day 3 and almost absent by day 21 (Fig. 1A, hematoxylin and eosin). On day 21 post‐BDL leukocyte infiltration around bile ducts was seen (CD45 in Fig. 1A), together with bile duct proliferation, branching, and corrugation, as well as fibrosis, as evidenced by CK‐19 and sirius red staining, respectively (Fig. 1A; Supporting Fig. S2 and Video S1A,B).
Figure 1.

Morphological alterations after BDL. (A) Gross pathology with “black” (days 1‐3) and “white” (day 21) bile in the gallbladder; bile infarcts as pale regions in hematoxylin and eosin–stained slides (days 1‐3); infiltration of CD45‐positive leukocytes into bile infarcts and periportal fields; ductular response as evidenced by CK‐19 immunostaining (days 3‐21); periportal fibrosis visualized by sirius red (day 21). (B) Intravital imaging of mouse livers on day 3 after sham operation or BDL after intravenous injection of the green fluorescent bile salt analogue CLF; red indicates mitochondrial membrane potential visualized by TMRE; blue indicates nuclei (Hoechst 33258). Abbreviations: C, column of CLF‐enriching hepatocytes; G, clusters of CLF‐enriching hepatocytes; H&E, hematoxylin and eosin; S, single CLF‐enriching hepatocyte.
Because bile infarcts have been reported to result from BS accumulation in hepatocytes or hepatic stroma, we injected the green fluorescent CLF into anesthetized mice on day 3 after BDL and analyzed liver tissue by two‐photon microscopy (Fig. 1B). CLF‐enriching hepatocytes were observed within a few minutes after CLF injection, which occurred as either single dispersed cells, small groups of cells, sheets of hepatocytes along sinusoids, or clusters of dead cells with degraded nuclei (Fig. 1B).
To understand the mechanisms responsible for BS accumulation, we studied CLF transport in BDL and control mice. CLF was injected into the tail vein, and the fluorescence intensity was quantified in the recorded time‐lapse intravital videos. The stills (Fig. 2A, sham control) and video (Supporting Video S2A) show the inflow of CLF into the sinusoids within 20 seconds after bolus injection, followed by appearance in the Disse space and transport into hepatocytes and finally into bile canaliculi. Quantification of fluorescence intensity in the four compartments in sham control mice illustrated the rapid clearance of CLF from blood and rapid translocation to the Disse space and hepatocytes, while clearance from hepatocytes and canaliculi occurred at comparatively low rates (Fig. 2B). Next, kinetics of CLF in the four compartments on days 3 and 21 after BDL were compared to the corresponding sham control mice (Fig. 2A,C; Supporting Video S2B,C). Hepatic uptake of CLF in BDL mice was reduced. This reduced uptake was detectable on day 3 after BDL, while CLF secretion proceeded at a normal rate (Fig. 2A,C). On day 21 post‐BDL the hepatic uptake of CLF was so strongly reduced that the CLF concentration in hepatocytes was only slightly above the detection limit and CLF clearance from the blood was much slower than on day 3 post‐BDL (Fig. 2A,C).
Figure 2.
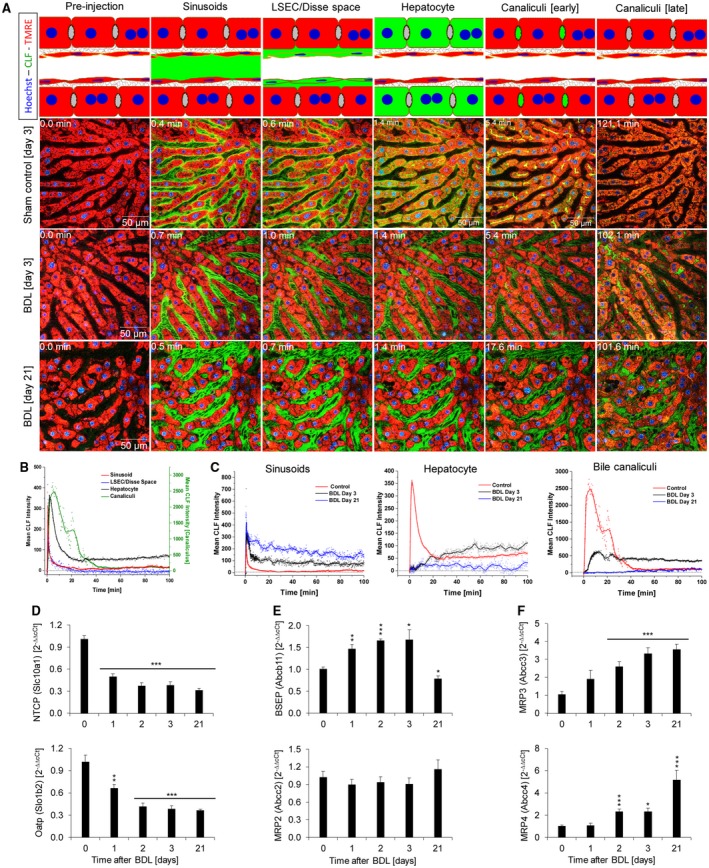
Reduced hepatic uptake of CLF after BDL. (A) Mice at 3 and 21 days post‐BDL as well as sham‐operated controls received intravenous injections of CLF. Subsequently, CLF is seen in the sinusoids, liver sinusoidal endothelial cells/Disse space, cytoplasm of hepatocytes, and bile canaliculi of controls (upper panel). At day 3 post‐BDL (middle panel) uptake of CLF through the sinusoidal membrane is strongly reduced, but export to the bile canaliculus is still active. At day 21 after BDL sinusoidal CLF uptake is blocked to such a degree that almost no increase of green fluorescence can be detected in hepatocytes and in bile canaliculi. (B) Quantification of mean CLF intensity in a control liver. (C) Mean CLF intensity 3 and 21 days post‐BDL in sinusoids, hepatocytes, and bile canaliculi in comparison to sham‐operated controls. (D‐F) Expression changes of carriers of BS and CLF at different time intervals after BDL. (D) Basolateral uptake carriers. (E) Apical export carriers. (F) Basolateral export carriers. Data are mean values and standard errors of five mice per time point. *P < 0.5, **P < 0.01, ***P < 0.001 compared to controls. Abbreviation: LSEC, liver sinusoidal endothelial cell.
To relate the results of two photon–based imaging to the expression of hepatic transporters, gene array analysis was performed at various time intervals after BDL to identify all expression alterations (Supporting Fig. S3). The identified candidates were validated by quantitative RT‐PCR in an independent set of mice (Fig. 2D). Expression of the sinusoidal uptake carriers Na+‐taurocholate cotransporting polypeptide (Ntcp; solute carrier family 10, member a1 [Slc10a1]) and organic ion transporting polypeptide 1b2 (Oatp1b2; Slc1b2) was significantly down‐regulated after BDL, while the apical export carrier bile salt export pump (adenosine triphosphate [ATP]–binding cassette, subfamily B, member 11 [Abcb11]) was up‐regulated in the acute and down‐regulated in the chronic phase after BDL. Expression of the apical transporter multidrug resistance–associated protein 2 (MRP2; Abcc2) did not show significant changes. In contrast, expression of the sinusoidal/basolateral export carriers MRP3 (Abcc3) and MRP4 (Abcc4) was strongly up‐regulated after BDL, particularly in the chronic phase.
Because CLF represents a synthetic BS surrogate, we performed a similar set of experiments with CDCA coupled to a fluorophore. With the amidofluorescein derivative of CDCA, similar results were obtained (Supporting Fig. S4 and Video S3A,B).
Rupture of the Apical Hepatocyte Membrane Represents an Initiating Event of Bile Infarcts
Strong CLF accumulation was observed in dispersed hepatocytes during days 1‐3 after BDL. Two intravital markers were used to characterize these cells: TMRE as a red fluorescent marker of mitochondrial membrane potential and PI, which is taken up into severely damaged hepatocytes as soon as the integrity of the cell membranes is compromised. The first observations after BDL were that individual dispersed hepatocytes lost TMRE‐associated red fluorescence, indicating mitochondrial damage after seconds to minutes, followed by PI uptake into their nuclei, indicating imminent cell death. Analyzing CLF‐enriching cells on day 3 after BDL showed that CLF accumulation occurred exclusively in hepatocytes with compromised mitochondrial membrane potential (Fig. 3A; Supporting Fig. S5A). Analyses of TMRE‐negative, PI‐negative hepatocytes revealed that CLF uptake occurred in two phases: an initial weak increase that coincided with uptake of CLF from the sinusoids, followed by a much stronger enrichment that occurred simultaneously to the filling of the adjacent bile canaliculi (Fig. 3A,B; Supporting Fig. S5A and Video S4A,B). The first phase is likely due to hepatic uptake of the dye, while the second phase must be due to influx of CLF through the apical membrane from the canalicular space. This scenario suggests that leakiness of the apical hepatocyte membranes may be responsible for BS enrichment in these individual hepatocytes.
Figure 3.

Leakiness of the apical hepatocyte membrane. (A) Stills of two‐photon videos of mouse livers on day 3 post‐BDL after intravenous injection of CLF. The video focuses on a TMRE‐negative hepatocyte that is still PI‐negative. Only little CLF is taken up by the sinusoidal membrane of the TMRE‐negative hepatocyte when CLF enters the sinusoids. As soon as CLF occurs in the bile canaliculi, the TMRE‐negative hepatocyte massively takes up green fluorophore. (B) Quantification of the video shown in (A). (C) Quantification of green fluorescence after intravenous injection of CMFDA into control and day 3 post‐BDL mice, from videos shown in Supporting Fig. S5B, showing that filling of TMRE‐negative hepatocytes coincides with filling of bile canaliculi. (D) CLF uptake in TMRE‐negative hepatocytes that are either PI‐negative or PI‐positive. While PI‐positive cells take up CLF simultaneously with the sinusoids, PI‐negative cells fill later, when canaliculi become positive. During the imaging period PI‐negative cells become PI‐positive with the consequence that CLF is taken up also by the sinusoidal side. (E) CLF uptake through the sinusoidal membrane of a TMRE‐negative, PI‐positive hepatocyte. (F,G) Quantifications of the videos shown in (D) and (E).
To further investigate this hypothesis, mice received bolus injections of CMFDA on day 3 post‐BDL. CMFDA remains nonfluorescent until fluorescein (5‐chloromethylfluorescein [CMF]) is released by intracellular esterases. CMF secretion in bile is mediated by Mrp2.10 Strong accumulation of CMF was only seen in TMRE‐negative hepatocytes and only when CMF was also present in the canaliculi (Fig. 3C; Supporting Fig. S5B and Video S4C,D). Again, this suggests that bile leaks from canaliculi through the apical membrane into the hepatocytes.
In the previous paragraph, we focused on CLF‐enriching, TMRE‐negative and PI‐negative hepatocytes. These hepatocytes start to take up PI within seconds to minutes after loss of TMRE‐associated red fluorescence (Fig. 3D; Supporting Fig. S5C and Video S4E). In the PI‐positive state, CLF was taken up from all sides, indicating loss of barrier function and overall increased permeability. Indeed, quantification of intravitally recorded videos demonstrated that all TMRE‐negative/PI‐positive hepatocytes (Fig. 3D‐G; Supporting Video S4E,F) showed a major increase of green fluorescence, when the CLF bolus reaches the sinusoids, followed by only a minor further increase that coincides with the filling of the bile canaliculi (Fig. 3F,G). Thus, we identified two different patterns of CLF uptake: CLF coming from the canalicular space in TMRE‐negative/PI‐negative hepatocytes and CLF coming from all sides in TMRE‐negative/PI‐positive damaged hepatocytes.
To follow these changes in CLF uptake kinetics, we focused on five TMRE‐negative, initially PI‐negative hepatocytes and performed a second CLF bolus injection into the tail vein approximately 50 minutes after the first CLF injection, when all hepatocytes had taken up PI (Fig. 3D,F; Supporting Fig. S5 and Video S4E). These same hepatocytes switched from a situation where CLF was taken up from the canalicular space to a situation where CLF was taken up from the blood as soon as it occurred in the sinusoids (Fig. 3D,F; Supporting Video S4E). Based on these results, we postulate that after BDL dispersed hepatocytes show mitochondrial damage followed by leaks in the apical membrane, allowing BS from the canalicular space to enter and kill the cell. This could be the underlying scenario of “single‐cell bile microinfarcts.”
Domino Effect of Bile Leakage and Systemic Consequences
To gain insight into the mechanisms and consequences of the development of bile infarcts, we performed intravital imaging of bile canaliculi with high magnification and fast recording sequences. These analyses showed that bile canaliculi on day 1 post‐BDL formed dilatations and protrusions into the neighboring hepatocytes (minutes 54.25‐56.75 in Fig. 4A; Supporting Video S5). These protrusions suddenly ruptured with flooding of CLF into the hepatocyte (minutes 57.25‐57.75 in Fig. 4A; Supporting Video S5). Subsequently, CLF‐enriched hepatocytes released green fluorescent CLF into the sinusoids. To study the consequences of CLF enrichment, long‐term recordings up to 270 minutes were performed (Fig. 4B; Supporting Video S6A). The example in Fig. 4B shows a hepatocyte during the process of CLF enrichment (minutes 114.8‐115.3; Supporting Video S6A). CLF enrichment seems to be associated with cell swelling (Fig. 4C). This might explain why the compromised hepatocyte was initially below the imaging plane and after CLF enrichment, minutes 114‐132, moved up into the focus of the recorded z‐level. Interestingly, this green fluorescent hepatocyte intermittently released CLF into its adjacent sinusoid (Fig. 4B, arrows, and D; Supporting Video S6A). Quantifications of TMRE‐associated and CLF‐associated fluorescence demonstrated the following sequence of events: first, mitochondrial potential was lost in single hepatocytes, then CLF leaked into the TMRE‐negative cells, subsequently CLF was released into the adjacent sinusoid (Supporting Fig. S6 and Video S6L), and finally nuclear fragmentation occurred (Fig. 4C; Supporting Video S6B). Under control conditions no reflux of CLF‐associated green fluorescence to sinusoids was observed (e.g., red curve in Fig. 4D).
Figure 4.

Rupture of the apical hepatocyte membrane in the acute phase after BDL. (A) Stills of intravital imaging of mouse liver on day 1 post‐BDL after intravenous injection of CLF. Note the relatively short time between first signs of canalicular swelling (55.25 minutes) and CLF inflow into the cytoplasm of hepatocytes (57.25 minutes). (B) Release of CLF into the sinusoid from a CLF‐loaded hepatocyte. (C) Nuclear fragmentation illustrated by segmentation of the CLF‐enriching hepatocyte from (B). (D) Quantification of the video shown in (B), to illustrate increased CLF intensity in the sinusoid that is in contact with the CLF‐overloaded cell. (E) Stills from processed videos with segmented CD45 and TMRE‐positive immune cells at the moment of (115 minutes) and after (247 minutes) apical membrane rupture. (F) Time‐resolved quantification of the number of immune cells in the imaged view field illustrating that massive immune cell infiltration occurs only after apical membrane rupture and coincides with nuclear fragmentation. (G) No influence of CLF injection on bile flow. (H) Domino effect of bile infarct formation starting from individual dispersed CLF‐loaded hepatocytes. Abbreviations: MovAVG, moving average; PBS, phosphate‐buffered saline.
To study the relationship between apical membrane rupture and immune cell infiltration, intravital imaging was performed after injection of fluorophore‐coupled anti‐CD45 antibodies and CLF bolus injection (Supporting Video S6C,D). The analyses showed that immune cell infiltration did not occur before apical membrane rupture (Fig. 4E,F). After membrane rupture, massive immune cell infiltration was seen coinciding with nuclear fragmentation (approximately at minute 211 in Fig. 4C,F). To specifically visualize neutrophils, a two‐photon intravital imaging technique was established based on fluorophore‐coupled anti‐Ly6G. Imaging at days 1 and 2 after BDL confirmed the temporal sequence of mitochondrial potential loss in single dispersed hepatocytes, leakage of canalicular CLF into these cells, followed by infiltration of neutrophils (Supporting Figs. S7‐S12 and Video S6E‐J).
To control for artifacts caused by a possible choleretic effect of the CLF injection, bile flow was quantified before and after phosphate‐buffered saline/CLF injection using a catheter fixed in the extrahepatic bile duct. Phosphate‐buffered saline/CLF injection did not increase bile flow (Fig. 4G). Moreover, injection of CLF did not induce single‐cell infarcts in sham‐operated or in BDL mice at day 21.
The observation that CLF‐enriched hepatocytes release CLF (and BS) to their immediate environment and neighboring cells leads to the hypothesis that these neighboring cells may also be damaged by exposure to high local BS concentrations. To study this, long‐term intravital recordings of dispersed CLF‐enriched hepatocytes on day 1 post‐BDL were performed (Fig. 4H; Supporting Video S6K). Interestingly, a “domino effect” was observed, wherein cells neighboring the CLF‐enriched hepatocytes also accumulated CLF. Together these CLF‐accumulating cells led to large areas of dead cells (infarcts). Compromised hepatocytes shunt CLF from the canaliculi into neighboring sinusoids. Often, this domino effect involved sheets of hepatocytes following the direction of sinusoidal blood flow. It should, however, be considered that the domino effect of bile infarct formation represents a highly stochastic process because some individual green hepatocytes did not involve their neighbors during the entire recording process, while others formed large infarct areas within minutes.
Parenchymal and Systemic Consequences of Bile Obstruction
To study the course of endogenous canalicular BS concentrations after BDL, MALDI imaging was performed to visualize and analyze concentrations of taurocholate, the most abundant endogenous BS in the mouse, before as well as 6 hours and 1, 2, 3, and 21 days after BDL (Fig. 5; Supporting Fig. S13). To identify the periportal regions, the MALDI images were aligned with adjacent liver tissue sections immunostained using antibodies against CK‐19. In control livers, the taurocholate‐associated signal was predominantly seen in the periportal fields. After 6 hours and days 1‐3 post‐BDL, the taurocholate signal became more intensive and extended to the midzonal and pericentral regions (Fig. 5A,B). Interestingly, the highest taurocholate signal was detected in the infarct regions (Fig. 5A). On day 21 post‐BDL the signal of taurocholate decreased to concentrations slightly above control levels (Fig. 5A,B). In conclusion, MALDI imaging clearly demonstrates an initial increase of the endogenous BS taurocholate concentration in liver lobules after BDL on days 1‐3, with normalization on day 21.
Figure 5.

MALDI imaging of taurocholate in livers after BDL. (A) Transient increase of taurocholate after BDL. Superimposed MALDI images and CK‐19 immunostaining are shown. In controls the taurocholate signal is limited to the bile ducts in periportal fields. It extends to almost the entire liver lobules until day 2 and returns to levels slightly above controls until day 21 post‐BDL. The highest taurocholate signal can be seen in the infarct regions (*). (B) Quantifications of the taurocholate signal in (A). Data are mean values and standard errors of three mice per time point. *P < 0.05, **P < 0.01 compared to controls; ## P < 0.01 compared to day 21 post‐BDL. Abbreviation: AU, arbitrary units.
To understand the results of functional two‐photon and MALDI‐based imaging in relation to systemic consequences, well‐established clinical parameters were analyzed. ALT and AST, as markers of hepatocyte damage, increased strongly on days 1 and 2 post‐BDL (Fig. 6A). In contrast, the cholestasis marker AP increased only slightly in the acute (days 1‐3) and strongly in the chronic (day 21) phase (Fig. 6A). In bile obtained from the gallbladder, total BS increased in the acute phase, reaching a peak on day 1 after BDL, but decreased significantly below control levels in the chronic phase (Fig. 6B). In blood, a continuous increase of BS was observed during the entire period (Fig. 6B). In control mice, the highest BS concentrations (approximately 70 µM) were detected in the portal vein blood, while in blood collected from the hepatic vein or the heart, the concentrations of BS were <1 µM. In contrast, following BDL the concentrations in blood taken from the portal vein, the hepatic vein, or the heart were about equal. Total BS in urine increased dramatically in the acute phase after BDL but decreased in the chronic phase to almost basal levels (Fig. 6B). The concentrations of 15 individual BS were analyzed in bile, blood, and urine (Supporting Fig.S14 and Table S4). Most of these showed a similar trend as the total BS profile, except for the primary BS α‐muricholate and the secondary BS glycoursodeoxycholate, deoxycholate, and taurodeoxycholate. They all decreased strongly in bile and blood after BDL. Total bilirubin showed similar trends in bile, blood, and urine as total BS (Fig. 6B).
Figure 6.

Clinical chemistry at several time periods after BDL. Data are mean values and standard errors of three to five mice per time point. *P < 0.05, **P < 0.01, ***P < 0.001 compared to controls; # P < 0.05, ## P < 0.01, ### P < 0.001 compared to day 21 post‐BDL.
Histological analysis of kidney tissue revealed cystic dilatation of renal tubules on day 21 post‐BDL (Supporting Fig. S15A), which was accompanied by urea as well as creatinine concentrations increased in blood and decreased in urine (Supporting Fig. S15B,C).
Similarities and Differences in Mdr2–/– Mice Compared to BDL
Mdr2–/– (Abcc4–/–) mice (18 weeks old) were used to compare the observations in BDL mice to another model of cholestasis (Fig. 7). These knockout mice are deficient for the ATP‐binding cassette transporter B4, which represents the hepatobiliary phosphatidylcholine translocase and is mutated in patients with progressive familial intrahepatic cholestasis (PFIC type 3). Like chronic BDL (day 21), Mdr2–/– mice showed a ductular reaction, periportal immune cell infiltration, and fibrosis (Fig. 7A). Single‐cell bile infarcts, as seen after BDL (Fig. 4A,B), were not observed in Mdr2–/– mice. Rather, individual dispersed hepatocytes transiently enriched CLF, leading to the impression of “blinking” hepatocytes (Fig. 7B,C; Supporting Fig. S16A‐F and Video S7A). The clearance of CLF from bile canaliculi in Mdr2–/– mice was slightly delayed compared to that in wild‐type mice (Fig. 7D; Supporting Fig. S16G and Video S7B,C). In contrast to chronic BDL mice, no impairment of basolateral uptake was seen, probably because of the milder cholangiopathy in Mdr2–/– mice, reflected by lower total BS concentrations in blood (Fig. 7E). Bile canaliculi in Mdr2–/– mice formed spine‐like protrusions, whereas the massive dilatation as seen after BDL was not observed (Fig. 7F). Two‐photon imaging of liver tissue with visible interlobular bile ducts showed the ductular reaction both in Mdr2–/– mice and after chronic BDL (Fig. 7G; Supporting Video S7D‐F). In chronic BDL (day 21), CLF from sinusoids does not enrich in bile canaliculi or interlobular bile ducts, whereas in Mdr2–/– mice CLF enrichment in bile canaliculi and ducts showed only minor differences compared to wild‐type controls (Fig. 7G‐J).
Figure 7.

Comparison of bile flux in Mdr2–/– and BDL mice. (A) Gross pathology, histology, ductular reaction (CK‐19), immune cell infiltration (CD45), and fibrosis (sirius red) in 18‐week‐old Mdr2–/– mice and age‐matched wild‐type controls. (B) Transiently CLF‐enriching individual hepatocytes in Mdr2–/– mice. (C) Quantification of CLF and TMRE‐associated fluorescence in the hepatocyte indicated by a white circle in (B). (D) Quantification of CLF intensity in sinusoids, hepatocytes, and bile canaliculi after CLF bolus injection. (E) Total BS concentrations in blood of BDL and Mdr2–/– and corresponding wild‐type mice of different ages. (F) Morphology of bile canaliculi in WT, Mdr2–/–, and day 3 post‐BDL mice. (G‐J) CLF intensities after bolus injection in sinusoids, hepatocytes, canaliculi, and interlobular bile ducts of wild‐type, Mdr2–/–, and day 21 post‐BDL mice. After BDL, TMRE (red) appears in the lumen of the interlobular bile ducts, a phenomenon that was not seen in Mdr2–/– or in wild‐type mice. Abbreviations: BA, bile acid; H&E, hematoxylin and eosin; WT, wild type.
Discussion
BDL is a frequently applied experimental procedure with the aim to mimic human cholestatic disease in experimental animals and to gain insight into disease mechanisms.9 Intravital imaging of BS transport after BDL has not yet been performed. We describe here the application of a two‐photon microscopy–based technique8 to image BS transport in intact healthy and cholestatic livers of anesthetized mice. Recordings of fast sequences in the millisecond range with a resolution close to the theoretical limit of 200 nm are possible. Analyses of mice up to 3 weeks after BDL led to the following concept (Fig. 8): In normal mice the total BS concentrations in the gallbladder (approximately 100 mM) and large bile ducts (approximately 20 mM) are higher than in bile canaliculi.1 Ligation of the common bile duct initially leads to a strong increase of BS concentrations in the upstream domains of the biliary tract, including the bile canaliculi. BS increases first in the periportal area (6 hours post‐BDL) and later in the entire liver lobules (days 1‐3 post‐BDL) as evidenced by MALDI imaging. After BDL, biliary BS concentrations increase into the cytotoxic concentration range of 0.2‐2 mM.11, 12, 13 At 1‐3 days after BDL we observed leakage of CLF from bile canaliculi into dispersed single hepatocytes. Rupture of the apical membrane initially affecting single hepatocytes later also affected neighboring cells (Fig. 8A). Within minutes after apical membrane rupture the sinusoidal/basolateral membranes of these same cells become leaky. This creates a physical shunt between the bile canaliculi and sinusoidal blood. Consequently, BS leak into the blood, and the BS concentration decreases in the biliary tract. Dead hepatocytes are to be replaced later when the critical phase immediately after BDL has subsided.14 Our techniques would allow detection of CLF that leaks through tight junctions in between hepatocytes, but we did not observe this.
Figure 8.

Concept of bile infarcts. (A) Rupture of the apical hepatocyte membrane and (B) systemic consequences. Abbreviation: BR, bilirubin.
In chronic cholestasis, day 21 after BDL, a different scenario was observed (Fig. 8B): the concentrations of BS in bile decrease even below those of control animals. This in part may be the result of the reduced hepatic uptake of BS. The reduced hepatic uptake of CLF and fluorescein‐conjugated CDCA corresponds to down‐regulation of the uptake carriers Ntcp and Oatp (Slco1b2) and up‐regulation of the basolateral export carriers Mrp3 and Mrp4.
In the kidney, we observed cystic dilatation of renal tubules.15, 16 Markers of decreased renal function, creatinine and urea increased in blood on day 21 post‐BDL. Likewise, BS and bilirubin decreased in urine. Therefore, compromised renal function is likely to contribute to the high blood concentrations of BS and bilirubin.
The so‐called ductular reaction4 represents an additional adaptive response, whereby intermediate‐size bile ducts (bile ductules) increase their inner surface by branching and looping accompanied by surface corrugation. These morphological changes probably allow increased reabsorption of some bile constituents by the obstructed bile ducts. Of note is the behavior of serum AP. The highest levels of serum AP were observed 21 days after BDL, with intermediate elevations at days 1‐3 after BDL. This suggests that early AP elevation is due to biliary leakage (days 1‐3), while during the later phase, at which the “ductular reaction” occurs, plasma AP shows the highest elevation.
As mechanisms of BS‐mediated hepatocyte cell death in cholestasis, both necrosis and apoptosis have been shown to play a role.17 The present study demonstrates rupture of the canalicular membrane as a third mechanism of hepatocyte death, followed by retroflux of BS from the canaliculus into the cytoplasm. Bile canalicular rupture has two consequences. First, neighboring cells of BS‐flooded hepatocytes have an increased risk of also becoming leaky, leading to a domino effect of bile infarcts. Second, bile infarcts create a transient shunt between bile canaliculi and sinusoids. A recently published landmark review about BS in hepatobiliary injury discussed that it is not yet clear why biliary BS levels may be reduced after biliary obstruction.17 The two‐photon videos and MALDI imaging of the present study support the hypothesis that the leakage through bile infarcts contributes to the decreased BS concentrations in the biliary tract.
Three mechanisms of BS loss from the obstructed biliary tract have been reported: cholehepatic shunting,18, 19 vesicular regurgitation of BS from bile canaliculi through intact hepatocytes to sinusoids, and leakage through tight junctions.1, 20, 21 In addition, up‐regulation of the basolateral BS export carriers MRP3 and MRP4 occurs with the reverse transport of BS from hepatocytes to blood.18 Leakage of BS into and from bile infarcts may represent a plausible additional fourth mechanism.17 Leakage through tight junctions was not observed in this study.
MALDI data show that BS concentrations in liver tissue increase at days 1‐3 after BDL. This may lead to mitochondrial damage as indicated by loss of TMRE signal, followed by apical membrane rupture causing CLF entry from canaliculi into ruptured cells; death of affected cells as evidenced, e.g., by PI uptake and a subsequent domino effect of further death events; and immune cell infiltration. Resistance of the apical membrane toward BS depends on the asymmetrical distribution of phospholipids in the outer and inner membrane leaflet. This is an active ATP‐dependent process involving phospholipid flippases. Thus, mitochondrial damage and ATP depletion could lead to loss of asymmetry, thereby increasing the vulnerability of the apical membrane.
The present study clearly demonstrates that BS from bile canaliculi leak into hepatocytes with compromised apical membranes and from there leak into the sinusoidal blood. The biliary tract (bile canaliculi and bile ducts) contributes ~10% of the total liver volume,22 which corresponds to ~0.15 cm3 for a mouse liver of 1.5 cm3. The volume of bile infarcts can be up to 20% of the liver volume in the acute phase after BDL (Supporting Fig. S17) corresponding to ~0.30 cm3. These numbers illustrate that the leakiness between bile canaliculi and infarct regions leads to an increase of ~3‐fold in the distribution volume for BS. Thus, the leakiness of apical hepatocyte membranes in the acute phase after BDL will indeed cause a relevant decrease in BS concentrations in the biliary tract.
Within 1‐2 hours after apical membrane rupture, a strong increase in CD45 and Ly6G‐positive immune cells was observed in the sinusoids. It has been reported that mitigating the inflammatory response can reduce the extent of necrosis after BDL.23 This may be due to enhancement of the initial damage by some infiltrating immune cells. However, time‐resolved analysis clearly shows that apical membrane rupture and nuclear fragmentation occur prior to the massive infiltration of CD45‐positive immune cells, which corresponds to descriptions that stressed hepatocytes release DNA fragments and cytokines that attract neutrophils.24
For comparison, we also studied 18‐week‐old Mdr2–/– mice that show milder cholangiopathy compared to mice after BDL but represent the bona fide model of the human disease PFIC type 3. Intravital two‐photon imaging in Mdr2–/– mice confirms the described spine‐like alterations of bile canaliculi.25 No single‐cell bile infarcts occurred, but individual transient CLF‐enriching (blinking) hepatocytes were consistently observed. CLF enrichment in these hepatocytes appeared when CLF had already been cleared from the sinusoids and was only present in bile canaliculi, indicating that CLF in the “blinking” hepatocytes originates from the canaliculi. The reason for the transient nature of this phenomenon was not elucidated in this study but may be due to efficient reverse export.
A limitation of the present study is the use of the synthetic BS analogue CLF for functional imaging. Uptake and export of CLF and BS by hepatocytes may not be entirely identical. For example, human BS carriers NTCP and ABCB11 are incapable of transporting CLF.26 In contrast, in humans OATP1B1, OATP1B3, and ABCC2 would be the candidate transporters for CLF uptake and secretion. In the mouse these are Oatp1b2 and Abcc2, respectively. Therefore, we repeated the CLF studies with fluorescently labeled CDCA. Also, with this agent reduced uptake after BDL was observed and leakage through apical membranes confirmed. For further confirmation, CMFDA, a non–bile acid model compound for organic anion secretion, was used. After bolus injection of CMFDA at day 3 post‐BDL, green fluorescent CMF was released in hepatocytes, followed by uptake in bile canaliculi, from where CMF leaked into TMRE‐negative hepatocytes to further shunt into the adjacent sinusoid. In contrast to CLF, CMFDA was taken up from the sinusoids into hepatocytes even on day 21 post‐BDL and shunted from hepatocytes back into sinusoids (Supporting Fig. S18). Thus, despite differences in transport properties, studies with three different tracers, CLF, CDCA, and CMFDA, support the concept of apical membrane rupture and the establishment of canalicular to sinusoidal shunting as presented in Fig. 8.
In conclusion, following biliary obstruction, bile infarcts occur by rupture of the apical membrane of hepatocytes. This causes a transient canaliculus‐to‐blood shunt that reduces the BS concentrations in the biliary tract. A long‐term consequence of BDL on biliary transport is a farnesoid X receptor (FXR)–mediated reduced hepatic uptake of BS and enhanced reverse transport through up‐regulated Mrp3 and Mrp4 in the basolateral membrane, protecting the liver parenchyma at the expense of increased blood BS concentrations and kidney damage.
Taken together these results form the background of a multiorgan “cholestatic syndrome” in which toxic effects mediated by high concentrations of bile salts are counterbalanced by protective mechanisms that are mediated in part by FXR but in part also by the creation of physical shunts releasing BS from high‐concentration to low‐concentration areas. Also, the kidney is involved in protecting the organism against the toxicity of BS during cholestasis.
Potential conflict of interest
Dr. Kuepfer is employed by Bayer. Dr. Jansen advises Intercept and NGM. He is on the speakers’ bureau for Falk.
Author names in bold designate shared co‐first authorship.
Supporting information
Acknowledgment
We thank Ms. Simone Keil, Ms. Brigitte Begher‐Tibbe, and Ms. Katharina Rochlitz (Leibniz Research Centre for Working Environment and Human Factors, Technical University Dortmund, Dortmund, Germany) for competent technical assistance. We also thank the Permanent Senate Commission on Food Safety of the DFG (SKLM) for helpful discussion.
Supported by the Bundesministerium für Bildung und Forschung (BMBF, Germany)–funded project LiSyM (FKZ 031L0052, 031L0045, 031L0055, 031L0037, 031L0051), including contributions from the following projects: BMBF (031L0073F, 031A355A), IMI (031L0117B), and an AOP concept of EUToxRisk (681002).
SEE EDITORIAL ON PAGE 473
Contributor Information
Ahmed Ghallab, Email: Ghallab@ifado.de.
Jan G. Hengstler, Email: Hengstler@ifado.de
References
- 1. Jansen PL, Ghallab A, Vartak N, Reif R, Schaap FG, Hampe J, et al. The ascending pathophysiology of cholestatic liver disease. Hepatology 2017;65:722‐738. [DOI] [PubMed] [Google Scholar]
- 2. Fickert P, Pollheimer MJ, Beuers U, Lackner C, Hirschfield G, Housset C, et al. Characterization of animal models for primary sclerosing cholangitis (PSC). J Hepatol 2014;60:1290‐1303. [DOI] [PMC free article] [PubMed] [Google Scholar]
- 3. Masyuk TV, Ritman EL, LaRusso NF. Quantitative assessment of the rat intrahepatic biliary system by three‐dimensional reconstruction. Am J Pathol 2001;158:2079‐2088. [DOI] [PMC free article] [PubMed] [Google Scholar]
- 4. Vartak N, Damle‐Vartak A, Richter B, Dirsch O, Dahmen U, Hammad S, et al. Cholestasis‐induced adaptive remodeling of interlobular bile ducts. Hepatology 2016;63:951‐964. [DOI] [PMC free article] [PubMed] [Google Scholar]
- 5. Harnoss JC, Heidecke CD, Vollmar B, Eipel C. In vivo imaging of bile accumulation and biliary infarction after common bile duct ligation in rats. Eur Surg Res 2011;47:240‐247. [DOI] [PubMed] [Google Scholar]
- 6. Fickert P, Zollner G, Fuchsbichler A, Stumptner C, Weiglein AH, Lammert F, et al. Ursodeoxycholic acid aggravates bile infarcts in bile duct–ligated and Mdr2 knockout mice via disruption of cholangioles. Gastroenterology 2002;123:1238‐1251. [DOI] [PubMed] [Google Scholar]
- 7. Rolleston HD. Diseases of the Liver, Gall‐bladder and Bile‐Ducts. New York: WB Saunders; 1904. [Google Scholar]
- 8. Reif R, Ghallab A, Beattie L, Gunther G, Kuepfer L, Kaye PM, et al. In vivo imaging of systemic transport and elimination of xenobiotics and endogenous molecules in mice. Arch Toxicol 2017;91:1335‐1352. [DOI] [PMC free article] [PubMed] [Google Scholar]
- 9. Tag CG, Sauer‐Lehnen S, Weiskirchen S, Borkham‐Kamphorst E, Tolba RH, Tacke F, et al. Bile duct ligation in mice: induction of inflammatory liver injury and fibrosis by obstructive cholestasis. J Vis Exp 2015;96:52438. [DOI] [PMC free article] [PubMed] [Google Scholar]
- 10. Kitamura T, Jansen P, Hardenbrook C, Kamimoto Y, Gatmaitan Z, Arias IM. Defective ATP‐dependent bile canalicular transport of organic anions in mutant (TR–) rats with conjugated hyperbilirubinemia. Proc Natl Acad Sci USA 1990;87:3557‐3561. [DOI] [PMC free article] [PubMed] [Google Scholar]
- 11. Allen K, Jaeschke H, Copple BL. Bile acids induce inflammatory genes in hepatocytes: a novel mechanism of inflammation during obstructive cholestasis. Am J Pathol 2011;178:175‐186. [DOI] [PMC free article] [PubMed] [Google Scholar]
- 12. Chen W, Owsley E, Yang Y, Stroup D, Chiang JY. Nuclear receptor–mediated repression of human cholesterol 7alpha‐hydroxylase gene transcription by bile acids. J Lipid Res 2001;42:1402‐1412. [PubMed] [Google Scholar]
- 13. Schoemaker MH, Conde de la Rosa L, Buist‐Homan M, Vrenken TE, Havinga R, Poelstra K, et al. Tauroursodeoxycholic acid protects rat hepatocytes from bile acid‐induced apoptosis via activation of survival pathways. Hepatology 2004;39:1563‐1573. [DOI] [PubMed] [Google Scholar]
- 14. Ghallab A, Celliere G, Henkel SG, Driesch D, Hoehme S, Hofmann U, et al. Model‐guided identification of a therapeutic strategy to reduce hyperammonemia in liver diseases. J Hepatol 2016;64:860‐871. [DOI] [PubMed] [Google Scholar]
- 15. Fickert P, Krones E, Pollheimer MJ, Thueringer A, Moustafa T, Silbert D, et al. Bile acids trigger cholemic nephropathy in common bile‐duct‐ligated mice. Hepatology 2013;58:2056‐2069. [DOI] [PubMed] [Google Scholar]
- 16. Krones E, Eller K, Pollheimer MJ, Racedo S, Kirsch AH, Frauscher B, et al. Norursodeoxycholic acid ameliorates cholemic nephropathy in bile duct ligated mice. J Hepatol 2017;67:110‐119. [DOI] [PubMed] [Google Scholar]
- 17. Fickert P, Wagner M. Biliary bile acids in hepatobiliary injury—what is the link? J Hepatol 2017;67:619‐631. [DOI] [PubMed] [Google Scholar]
- 18. Geier A, Wagner M, Dietrich CG, Trauner M. Principles of hepatic organic anion transporter regulation during cholestasis, inflammation and liver regeneration. Biochim Biophys Acta 2007;1773:283‐308. [DOI] [PubMed] [Google Scholar]
- 19. Xia X, Francis H, Glaser S, Alpini G, LeSage G. Bile acid interactions with cholangiocytes. World J Gastroenterol 2006;12:3553‐3563. [DOI] [PMC free article] [PubMed] [Google Scholar]
- 20. Torok NJ, Larusso EM, McNiven MA. Alterations in vesicle transport and cell polarity in rat hepatocytes subjected to mechanical or chemical cholestasis. Gastroenterology 2001;121:1176‐1184. [DOI] [PubMed] [Google Scholar]
- 21. Watanabe N, Kojima S, Takashimizu S, Nishizaki Y, Kagawa T, Phillips MJ. Initial site of bile regurgitation following extrahepatic biliary obstruction in living rats. J Gastroenterol Hepatol 2007;22:1983‐1992. [DOI] [PubMed] [Google Scholar]
- 22. Hammad S, Hoehme S, Friebel A, von Recklinghausen I, Othman A, Begher‐Tibbe B, et al. Protocols for staining of bile canalicular and sinusoidal networks of human, mouse and pig livers, three‐dimensional reconstruction and quantification of tissue microarchitecture by image processing and analysis. Arch Toxicol 2014;88:1161‐1183. [DOI] [PMC free article] [PubMed] [Google Scholar]
- 23. Cai SY, Ouyang X, Chen Y, Soroka CJ, Wang J, Mennone A, et al. Bile acids initiate cholestatic liver injury by triggering a hepatocyte‐specific inflammatory response. JCI Insight 2017;2:e90780. [DOI] [PMC free article] [PubMed] [Google Scholar]
- 24. Marques PE, Oliveira AG, Pereira RV, David BA, Gomides LF, Saraiva AM, et al. Hepatic DNA deposition drives drug‐induced liver injury and inflammation in mice. Hepatology 2015;61:348‐360. [DOI] [PubMed] [Google Scholar]
- 25. Lammert F, Wang DQ, Hillebrandt S, Geier A, Fickert P, Trauner M, et al. Spontaneous cholecysto‐ and hepatolithiasis in Mdr2–/– mice: a model for low phospholipid‐associated cholelithiasis. Hepatology 2004;39:117‐128. [DOI] [PubMed] [Google Scholar]
- 26. de Waart DR, Hausler S, Vlaming ML, Kunne C, Hanggi E, Gruss HJ, et al. Hepatic transport mechanisms of cholyl‐L‐lysyl‐fluorescein. J Pharmacol Exp Ther 2010;334:78‐86. [DOI] [PubMed] [Google Scholar]
Associated Data
This section collects any data citations, data availability statements, or supplementary materials included in this article.
Supplementary Materials