

Abstract
Aim
To determine whether high triglycerides (TG) in the presence of statin‐controlled LDL‐C influence the risk of cardiovascular disease (CVD) among patients with diabetes in real‐world clinical practice.
Materials and methods
We identified adults with diabetes from the Southern California and Pacific Northwest regions of Kaiser Permanente. We included patients undergoing statin therapy with LDL‐C from 40‐100 mg/dL who were not undergoing other lipid‐lowering therapies and had a prior diagnosis of atherosclerotic CVD or at least one other CVD risk factor. We grouped patients into high TG (200‐499 mg/dL; n = 5542) or normal TG (<150 mg/dL, n = 22 411) from January 2010 through December 2016 to compare incidence rates and rate ratios of first non‐fatal myocardial infarction (MI), non‐fatal stroke, unstable angina and coronary revascularization. We adjusted multivariable analyses for age, sex, race/ethnicity, smoking status, blood pressure, HbA1c, serum creatinine, presence of ischaemic heart disease and study site.
Results
Adjusted rate ratios for the four outcomes were all statistically significantly different. The incidence rate for non‐fatal MI was 30% higher in the high TG group (rate ratio, 1.30; 95% CI, 1.08‐1.58; P = 0.006). The rate was 23% higher for non‐fatal stroke (1.23, 1.01‐1.49, P = 0.037), 21% higher for coronary revascularization (rate ratio, 1.21; 95% CI, 1.02‐1.43; P = 0.027) and was, non‐significantly, 33% higher for unstable angina (rate ratio, 1.33; 95% CI, 0.87‐2.03; P = 0.185).
Conclusions
Despite statin‐controlled LDL‐C levels, CV events were greater among patients with diabetes and high TG levels. Because we controlled for cardiometabolic risk factors, it is likely that the difference in TG levels contributed to the excess risk observed in patients with high TGs.
Keywords: cardiovascular risk, epidemiology, hypertriglyceridaemia
1. INTRODUCTION
Low‐density lipoprotein cholesterol (LDL‐C) is the primary lipid target for prevention of cardiovascular disease (CVD) in patients with diabetes.1 Nevertheless, elevated triglyceride (TG) levels are common in diabetes, occurring in approximately 50% of all patients,2 and in up to 60% of those with LDL‐C levels below 100 mg/dL.3 Current guidelines from the American Diabetes Association (ADA) recommend medical therapy when TG levels are ≥500 mg/dL for prevention of pancreatitis, but post‐hoc analyses of clinical trials concerning LDL‐C lowering suggest that TG levels are associated with CVD and mortality, independent of other lipid fractions.4, 5, 6, 7, 8 Genetic studies also suggest a causal role of TG in the development and progression of atherosclerotic CVD.9 Thus, further reduction in CVD risk with agents that lower TG levels may be achievable.10 Indeed, there is evidence that even moderate TG elevation (200‐499 mg/dL) is associated with CVD risk among patients who have achieved LDL‐C control.11, 12, 13 However, real‐world evidence of the relationship between elevated TG levels and CVD among statin‐treated patients with diabetes who have succeeded in attaining LDL‐C control is lacking. Therefore, we conducted an observational longitudinal cohort study based on electronic health records (EHR) of patients with diabetes in an integrated delivery system who were at high risk of CVD events and had statin‐controlled LDL‐C. Our objective was to determine whether high TG in the presence of statin‐controlled LDL‐C influences CVD risk in real‐world clinical practice.
2. MATERIALS AND METHODS
Kaiser Permanente (KP) is an integrated delivery system that provides medical care to individuals in eight semi‐autonomous regions, including the Pacific Northwest (KPNW) and Southern California (KPSC) regions that were used for this study. Both organizations use an EPIC‐based electronic health record (EHR) of both inpatient and outpatient contacts. These data are combined with enrollment, laboratory and pharmacy information systems to develop a comprehensive dataset of all types of health care utilization that is standardized into a common data model.14 The KPNW Institutional Review Board (IRB) approved the study with a waiver of informed consent, and the KPSC's IRB ceded review to KPNW.
To provide real‐world context for the potential benefit of treating high TG levels in high‐risk patients whose LDL is well controlled with statin therapy, the sample for the current study was selected to mimic the inclusion and exclusion criteria of patients participating in the Reduction of Cardiovascular Events with EPA ‐ Intervention Trial (REDUCE‐IT). We identified all KPNW and KPSC patients 45 years of age and older with atherosclerotic CVD (ASCVD) or diabetes, with at least one other risk factor, with a TG level less than 500 mg/dL in 2010 while undergoing statin therapy but no other anti‐hyperlipidaemic therapy, and with LDL‐C values between 40 and 100 mg/dL (n = 170 590). We then selected all patients who had a diagnosis of diabetes (ICD‐9‐CM 250.x) in 2010 and a diagnosis of ASCVD (myocardial infarction (MI) [410.x or 412], ischemic stroke [434.x], acute coronary syndrome [411.1], or peripheral arterial disease (PAD) [443.8x, 443.9x]), or diagnosis of diabetes and age ≥ 50 and receiving an anti‐hyperglycemic agent with at least one of the following additional risk factors: cigarette smoking, hypertension diagnosis (401.x‐405.x) or blood pressure ≥ 140/90 mm Hg, high density lipoprotein cholesterol (HDL‐C) > 40 mg/dL in men or > 50 mg/dL in women, high‐sensitivity C reactive protein (hs‐CRP) > 3.0, estimated glomerular filtration rate (eGFR) from 30‐59 mL/min/1.73 m2, urine albumin creatine ratio (UACR) ≥ 30 mg/g, or ≥ 55 years of age in men and ≥ 65 years of age in women, resulting in a sample size, before exclusions, of 65 496. We divided patients into a high TG group (200‐499 mg/dL; n = 11 797) and a normal TG group (<150 mg/dL; n = 42 320). Because a point estimate of TG has a wide range of inherent variability, we excluded 11 339 patients with levels of 150‐199 mg/dL from further analysis to ensure that we created two analysis groups with distinctly different TG levels. Other exclusion criteria, again following REDUCE‐IT guidelines, were: AIDS/HIV (ICD‐9‐CM 042.x, 043.x, 044.x), malignant cancer (140.xx‐239.xx), end‐stage renal disease (585.6), planned surgery (defined for this study as any surgery within 6 months of the date of TG testing), and liver disease (diagnoses of cirrhosis or hepatitis, alanine aminotransferase [ALT] or aspartate aminotransferase [AST] >3x upper limit of normal [ULN], bilirubin >2x ULN), kidney dysfunction (albumin level < 3.4 g/dL, blood urea nitrogen level > 20 mg/dL, or a serum creatinine >1.3 mg/dL in men or 1.1 mg/dL in women), or thyroid function abnormalities (thyroid stimulating hormone values <0.4 mU/L or > 4.2 mU/L with or without treatment). REDUCE‐IT guidelines excluded New York Heart Association (NYHA) Class IV heart failure only, but our data did not include a heart failure class; thus, we excluded all individuals with a diagnosis of heart failure (ICD‐9‐CM 428.x). These criteria resulted in the exclusion of 6255 patients from the high TG group and 19 909 from the normal TG group, giving final sample sizes of 5542 and 22 411 patients, respectively, in the high and normal TG groups. A consort diagram of sample selection is displayed in Supporting Information Figure S1.
2.1. Index date and follow‐up period
If multiple TG results were available in 2010, all must have been in the same TG group range, that is, <150 mg/dL for the normal TG group and 200‐499 mg/dL for the high TG group. We used the first available TG level in 2010 as the index value and defined the baseline period, for baseline data collection, as 6 months before and 6 months after the index TG level. We defined the index date for beginning follow‐up as the date of the index TG level plus 182 days, to avoid immortal time bias that would result from including the 6‐month post index TG level as follow‐up time. The follow‐up period for each patient extended from the index date through December 2016 (maximum follow‐up period of 6.5 years) with censoring on 31 December 2016 or when a patient died or left the health plan.
2.2. Study outcomes and covariates
Our CVD outcomes of interest were non‐fatal MI, non‐fatal stroke, coronary revascularization or unstable angina based on events recorded in the inpatient or emergency room setting. We compared baseline demographics (age, sex, race/ethnicity), clinical characteristics (haemoglobin A1c [A1C], smoking status, body mass index [BMI], systolic and diastolic blood pressure, lipid fractions) and comorbidities (including MI, stroke, unstable angina and chronic kidney disease [CKD]) between the high and normal TG groups, using t‐tests for continuous variables and χ2 tests for dichotomous and categorical variables. We also compared the crude prevalence (number and proportion of each group with each outcome) that occurred any time during follow‐up using χ2 tests.
2.3. Statistical analyses
We compared multivariable adjusted incidence rates and rate ratios of the outcomes between TG groups using generalized linear models with Poisson errors (log‐link), with follow‐up time as an offset variable to account for differential follow‐up. Based on univariate analyses of the association between covariates and outcomes, we adjusted the multivariable analyses for age, sex, race/ethnicity, low HDL‐C (<40 mg/dL in men, <50 mg/dL in women), smoking status, A1C, blood pressure, serum creatinine, presence of ischaemic heart disease and study site. We assessed the robustness of the reported rate ratios using the recently proposed E‐value, a measure of the minimum association that an unmeasured confounder must have with respect to both treatment and outcome to explain the significant associations.15 A large E‐value implies that a large amount of residual confounding would be needed to explain the effect estimate, and it is a sensitivity technique for observational data that has been used in recent studies.16, 17 All analyses were conducted using SAS version 9.4 (Cary, North Carolina).
3. RESULTS
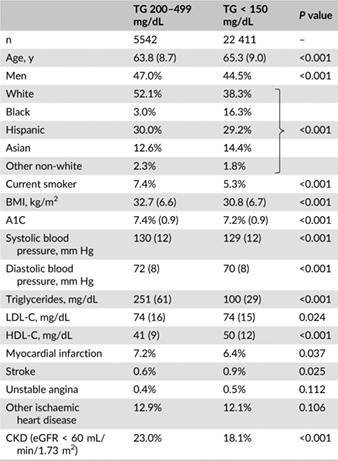
Compared with patients in the normal TG group, patients in the high TG group were 1.5 years younger (63.8 vs 65.3 years; P < 0.001), were more likely to be men (47.0% vs 44.5%; P < 0.001) and of a white race (52.1% vs 38.3%; P < 0.001) and were more likely to smoke (7.4% vs 5.3%; P < 0.001) (Table 1). Almost one third of the patients in both groups were of Hispanic ethnicity. Cardiometabolic risk factors including BMI, A1C and blood pressure were lower in the normal TG group, but the differences were of limited clinical significance. HDL‐C was significantly lower in the high TG group (41 vs 50 mg/dL; P < 0.001). Patients in the high TG group were more likely to have a history of MI (7.2% vs 6.4%; P = 0.037) and to have CKD (23.0% vs 18.1%; P < 0.001).
Table 1.
Baseline characteristics of patients with high vs normal triglycerides
|
Although statistically significantly different (5.28 years in the high TG group vs 5.37 years in the low TG group; P < 0.001), follow‐up time was nearly identical in the two groups (Table 2). The crude prevalence of non‐fatal MI was greater in the high TG group compared with the normal TG group (3.3% vs 2.5%; P < 0.001), as was the prevalence of coronary revascularization (4.1% vs 3.1%; P < 0.001). The crude prevalence of non‐fatal stroke (2.0% vs 2.7%; P = 0.468) and unstable angina (0.7% vs 0.5%; P = 0.124) was not statistically significantly different.
Table 2.
Crude prevalence of study outcomes during follow‐up
| TG 200–499 mg/dL | TG < 150 mg/dL | P value | ||
|---|---|---|---|---|
| Years of follow‐up | Mean | 5.28 | 5.37 | <0.001 |
| Std dev | 1.73 | 1.66 | ||
| Non‐fatal MI | n | 181 | 554 | <0.001 |
| % | 3.3% | 2.5% | ||
| Non‐fatal stroke | n | 162 | 615 | 0.468 |
| % | 2.9% | 2.7% | ||
| Unstable angina | n | 37 | 112 | 0.124 |
| % | 0.7% | 0.5% | ||
| Coronary revascularization | n | 225 | 691 | <0.001 |
| % | 4.1% | 3.1% |
As shown in Figure 1, the adjusted incidence rates per 1000 person‐years of all four outcomes were greater in the high vs normal TG groups, but the 95% confidence intervals for non‐fatal stroke and unstable angina slightly overlapped. The lower 95% confidence limit for non‐fatal MI in the high TG group was identical to the upper limit in the low TG group. However, the rate ratios for three of the four outcomes were statistically significantly different. The incidence rate was 30% higher in the high TG group for non‐fatal MI (rate ratio, 1.30; 95% CI, 1.08‐1.58; P = 0.006), was 23% higher for non‐fatal stroke (rate ratio, 1.23; 95% CI, 1.01‐1.49; P = 0.037) and was 21% higher for coronary revascularization (rate ratio, 1.21; 95% CI, 1.02‐1.43; P = 0.027). Although numerically greater, the rate ratio for unstable angina was not statistically significant (rate ratio, 1.33; 95% CI, 0.87‐2.03; P = 0.185). E‐values for the risk ratios were 1.92, 1.76 and 1.71 for non‐fatal MI, non‐fatal stroke and revascularization, respectively. Thus, the observed risk ratios could be explained by an unmeasured confounder that was associated with both TG group and outcome by the amount of the E‐value above and beyond the measured confounders, but weaker confounding could not do so.
Figure 1.
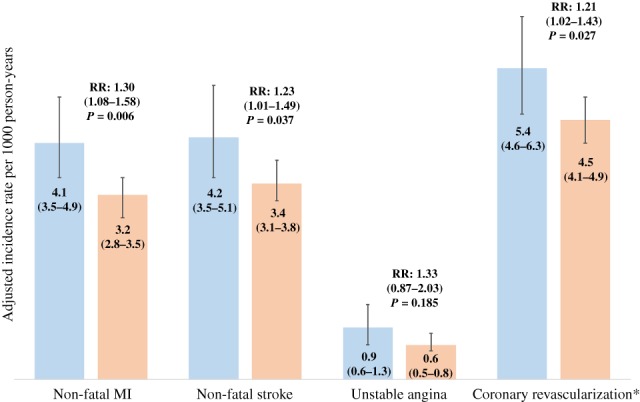
Adjusted incidence rates per 1000 person‐years (95% confidence limits) and incidence rate ratios comparing patients with high vs normal triglycerides. Models are adjusted for age, sex, smoking status, HbA1c, blood pressure, serum creatinine and history of ischaemic heart disease, RR: rare ratio. ( ) TG 200‐499 mg/dL, and (
 ) TG < 150 mg/dL
4. DISCUSSION
In this observational longitudinal cohort study of 27 953 patients with diabetes who were at high risk of CVD but with statin‐controlled LDL‐C, we found that TG levels in the 200‐499 mg/dL range were statistically significantly associated with CVD events over a mean follow‐up period of more than 5 years when compared with otherwise similar patients with TG levels <150 mg/dL. Both TG groups had LDL‐C levels ranging from 40 to100 mg/dL while undergoing statin therapy, and we statistically controlled for minor differences in other cardiometabolic risk factors. Thus, our results suggest that the differences in residual CVD risk may be explained, at least in part, by the difference in TG levels even after adjustment for differences in demographic and clinical characteristics including HDL‐C. Recent publications, including observational real‐world data, have also reported increased residual CVD risk in patients with elevated and high TG levels, even after adjustment for HDL‐C levels.13, 18
Although statins are recommended for primary CVD prevention in diabetes patients 40 years of age and older, and for secondary CVD prevention among all adults,1 they are prescribed in cardiology practices for only approximately 62% of patients aged 40‐75 years,19 among whom just over 50% maintain statin usage over an extended period of time.20 As a result, only 40%‐60% of diabetes patients attain LDL‐C levels <100 mg/dL.2, 20, 21, 22 To account for CVD risk that could be attributed to the absence of statin use or LDL‐C control, we focused our analyses on patients with a current statin prescription and LDL‐C levels from 40 to100 mg/dL. Among these patients, 35.4% had TG levels greater than 150 mg/dL, similar to the nearly 40% with levels ≥150 mg/dL despite statin use according to an analysis of National Health and Nutrition Examination Survey (NHANES) data and the 40% among diabetes patients with LDL‐C < 100 mg/dL with unspecified statin use, but somewhat lower than the 56% reported in another NHANES analysis.2, 3, 23 Despite the large proportion of diabetes patients with high TG levels, studies concerning the association between TGs and CVD in diabetes are scant. One Italian study of patients with diabetes undergoing lipid‐lowering therapy revealed that mean TG levels were significantly associated with all‐cause mortality, independent of other cardiometabolic risk factors.24 Another study involving 28 218 adults with diabetes with LDL‐C < 100 mg/dL, conducted in a setting similar to that of ours, revealed a strong independent association between high TG and coronary heart disease (CHD) events in men that was significant among women only if HDL‐C was low.3 Similarly, the Action to Control Cardiovascular Risk in Diabetes (ACCORD) trial did not find a significant CVD benefit of fibrate therapy overall, but did report a possible benefit among the subgroup of diabetes patients with both high TG levels and low HDL‐C.25 The Strong Heart Study recently reported an association between high TG levels and CHD events that was particularly significant among patients with diabetes.26 Two other observational studies involving high‐risk statin‐treated patients, with and without diabetes, revealed an elevated risk of CVD events, especially non‐fatal MI, among patients with high TGs after controlling for HDL‐C and other risk factors.12, 13 Unlike any of the above studies, ours focused on statin‐treated patients with diabetes who had attained good LDL‐C control. Thus, our finding of an association between high TG levels and a substantially increased risk of CVD fills an important knowledge gap.
Three meta‐analyses have demonstrated that TG levels are independently associated with CVD in general populations.27, 28, 29 However, the ADA does not currently recommend treating hypertriglyceridaemia for CVD risk reduction because clinical trials of agents that lower TG, specifically fenofibrates and niacin, have failed to demonstrate a reduction in CVD outcomes.25, 30, 31 The Fenofibrate Intervention and Event Lowering in Diabetes (FIELD) study did not find a significant reduction in the primary outcome of non‐fatal MI or death from CHD, but did show a reduction in total CVD events, mainly because of fewer non‐fatal MIs and revascularizations.32 Stronger evidence is needed. In addition to the REDUCE‐IT study, the Outcomes Study to Assess Statin Residual Risk Reduction With EpaNova in High CV Risk Patients With Hypertriglyceridemia (STRENGTH) and the Pemafibrate to Reduce Cardiovascular Outcomes by Reducing Triglycerides In Patients With Diabetes (PROMINENT) studies are ongoing large CV outcomes trials involving high‐risk CVD patients, including a large percentage of patients with diabetes, undergoing statin therapy, with the results from the REDUCE‐IT study (EPA vs placebo) to be presented first in 2018.33, 34, 35, 36
Our study has important limitations. We used observational laboratory data, from which we could not accurately determine fasting status, and which probably include a combnation of fasting and non‐fasting TG results. Fasting values may be better for diagnosing hypertriglyceridaemia,37 but non‐fasting values better predict CVD risk.38, 39, 40 Furthermore, because non‐fasting TG levels are higher than fasting TG levels,37, 41 any resulting misclassification would bias our results toward the null, suggesting that our estimates of excess CVD risk in the high TG group may be conservative. We assessed TG levels and other cardiometabolic risk factors at baseline and did not assess the impact of changes during follow‐up. Observational data cannot establish causality, but real‐world data provide important information concerning risk and associations as seen in clinical practice. Finally, although the E‐value is a relatively new tool for sensitivity analysis and may be unfamiliar to many readers, it is rapidly becoming a widely accepted method for assessing unmeasured confounding.
In conclusion, we found that, despite statin‐controlled LDL‐C levels and adjustment for HDL‐C, CV event rates were greater among diabetes patients with high compared to normal TG levels. Because we controlled for group differences, including other cardiometabolic risk factors, it is probable that the difference in TG level contributed to the excess risk observed in patients with high TG levels.
CONFLICTS OF INTEREST
G. A. N. has received funding unrelated to this study from Boehringer‐Ingelheim, Janssen Pharmaceuticals, Merck & Co. and Sanofi. S. P. and C. B. G. are employees of Amarin Pharma. K. R. has received funding unrelated to this study from Merck & Co., Amgen and Regeneron. S. F. has consulted for Amarin, Amgen, Kowa, Aegerion and Akcea.
Author contributions
G. A. N. contributed to the study conception and design and the interpretation of results, and developed the first draft of the manuscript. S. P., K. R., C. B. G. and S. F. contributed to the study conception and design and the interpretation of results, and reviewed/edited the manuscript. The final draft for submission was approved by all authors. G. A. N. is the guarantor of this work and, as such, had full access to all the data in the study and takes responsibility for the integrity of the data and accuracy of the data analysis.
Supporting information
Figure S1 Consort diagram of inclusion and exclusion criteria.
ACKNOWLEDGMENTS
This study was presented in poster form at the 78th Scientific Sessions of the American Diabetes Association, Orlando, Florida, 22‐26 June 2016.
Nichols GA, Philip S, Reynolds K, Granowitz CB, Fazio S. Increased residual cardiovascular risk in patients with diabetes and high versus normal triglycerides despite statin‐controlled LDL cholesterol. Diabetes Obes Metab. 2019;21:366–371. 10.1111/dom.13537
Funding information This study was funded by Amarin Pharma, Inc.
REFERENCES
- 1. American Diabetes Association . Standards of medical care in diabetes‐‐2018. Diabetes Care. 2018;41(suppl):S1‐S153. [DOI] [PubMed] [Google Scholar]
- 2. Ghandehari H, Kamal‐Bahl S, Wong ND. Prevalence and extent of dyslipidemia and recommended lipid levels in US adult with and without cardiovascular comorbidities: the National Health and nutrition examination survey 2003‐2004. Am Heart J. 2008;156:112‐119. [DOI] [PubMed] [Google Scholar]
- 3. Rana JS, Liu JY, Moffet HH, et al. Metabolic dyslipidemia and risk of coronary heart disease in 28,318 adults with diabetes mellitus and low‐density lipoprotein cholesterol <100 mg/dl. Am J Cardiol. 2015;116:1700‐1704. [DOI] [PubMed] [Google Scholar]
- 4. Kastelein JJP, van der Steeg WA, Holme I, et al. ftTaIS: lipids, apolipoproteins, and their ratios in relation to cardiovascular events with statin treatment. Circulation. 2008;117:3002‐3009. [DOI] [PubMed] [Google Scholar]
- 5. Miller M, Cannon CP, Murphy SA, Qin J, Ray KK, Braunwald E. ftPI‐T: impact of triglyceride levels beyond low‐density lipoprotein cholesterol after acute coronary syndrome in the PROVE IT‐TIMI 22 trial. J Am Coll Cardiol. 2008;51:724‐730. [DOI] [PubMed] [Google Scholar]
- 6. Faergeman O, Holme I, Fayyad R, et al. Plasma triglycerides and cardiovascular events in the treating to new targets and incremental decrease in end‐points through aggressive lipid lowering trials of statins in patients with coronary artery disease. Am J Cardiol. 2009;104:459‐463. [DOI] [PubMed] [Google Scholar]
- 7. Schwartz GG, Abt M, Bao W, et al. Fasting triglycerides predict recurrent ischemic events in patients with acute coronary syndrome treated with statins. J Am Coll Cardiol. 2015;65:2267‐2275. [DOI] [PubMed] [Google Scholar]
- 8. Sirimarco G, Labreuche J, Bruckert E, et al. Atherogenic dyslipidemia and residual cardiovascular risk in statin‐treated patients. Stroke. 2014;45:1429‐1436. [DOI] [PubMed] [Google Scholar]
- 9. Budoff M. Triglycerides and triglyceride‐rich lipoproteins in the causal pathway of cardiovascular disease. Am J Cardiol. 2016;118:138‐145. [DOI] [PubMed] [Google Scholar]
- 10. Jellinger PS, Handelsman Y, Rosenblit PD, et al. American Association of Clinical Endocrinologists and American College of Endocrinology guidelines for Management of Dyslipidemia and Prevention of cardiovascular disease. Endocr Pract. 2017;23:1‐87. [DOI] [PubMed] [Google Scholar]
- 11. Carey VJ, Bishop L, Laranjo N, Harshfield BJ, Kwiat C, Sacks FM. Contribution of high plasma triglycerides and low high‐density lipoprotein cholesterol to residual risk of coronary heart disease after establishment of low‐density lipoprotein cholesterol control. Am J Cardiol. 2010;106:757‐763. [DOI] [PMC free article] [PubMed] [Google Scholar]
- 12. Nichols GA, Philip S, Reynolds K, Granowitz CB, Fazio S. Increased cardiovascular risk in Hypertriglyceridemic patients with statin‐controlled LDL cholesterol. J Clin Endocrinol Metab. 2018;103:3019‐3027. [DOI] [PubMed] [Google Scholar]
- 13. Toth PP, Granowitz CB, Hull M, Liassou D, Anderson A, Philip S. High triglycerides are associated with increased cardiovascular events, medical costs, and resource use: a real‐world administrative claims analysis of statin‐treated patients with high residual cardiovascular risk. J Am Heart Assoc. 2018;7:e008740. [DOI] [PMC free article] [PubMed] [Google Scholar]
- 14. Ross TR, Ng D, Brown JS, Pardee R, Hornbrook MC. The HMO research network virtual data warehouse: a public data model to support collaboration. EGEMS. 2014;2:1049. [DOI] [PMC free article] [PubMed] [Google Scholar]
- 15. VanderWeele TJ, Ding P. Sensitivity analysis in observational research: introducing the E‐value. Ann Intern Med. 2017;167:268‐274. [DOI] [PubMed] [Google Scholar]
- 16. O'Brien R, Johnson E, Haneuse S, et al. Microvascular outcomes in patients with diabetes after bariatric surgery versus usual care: a matched cohort study. Ann Intern Med. 2018;169:300‐310. [DOI] [PMC free article] [PubMed] [Google Scholar]
- 17. Wicklow BA, Sellers EAC, Sharma AK, et al. Association of Gestational Diabetes and Type 2 diabetes exposure in utero with the development of type 2 diabetes in first nations and non‐first nations offspring. JAMA Pediatr. 2018;172:724‐731. [DOI] [PMC free article] [PubMed] [Google Scholar]
- 18. Tada H, Kawashiri MA, Nomura A. Serum triglycerides predict first cardiovascular events in diabetic patients with hypercholesterolemia and retinopathy. Eur J Prev Cardiol. 2018. 10.1177/2047487318796989 [Epub ahead of print]. [DOI] [PubMed] [Google Scholar]
- 19. Pokharel Y, Gosch K, Nambi V, et al. Practice‐level variation in statin use among patients with diabetes. Insights From the PINNACLE Registry. J Am Coll Cardiol. 2016;68:1368‐1369. [DOI] [PMC free article] [PubMed] [Google Scholar]
- 20. Nichols GA, Joshua‐Gotlib S, Parasuraman S. Independent contribution of A1C, systolic blood pressure, and LDL cholesterol to risk of cardiovascular disease hospitalizations in type 2 diabetes: an observational cohort study. J Gen Inter Med. 2013;28:691‐697. [DOI] [PMC free article] [PubMed] [Google Scholar]
- 21. Evenson KR, Rosamond WD, Cai J, et al. Physical activity and ischemic stroke risk. The atherosclerosis risk in communities study. Stroke. 1999;30:1333‐1339. [DOI] [PubMed] [Google Scholar]
- 22. Ali MK, Bullard KM, Saaddine JB, Cowie CC, Imperatore G, Gregg EW. Achievement of goals in U.S. diabetes care. 1999‐2010. N Engl J Med. 2013;368:1613‐1624. [DOI] [PubMed] [Google Scholar]
- 23. Fan W, Philip S, Granowitz CB, Toth PP, Wong ND. Prevalence and predictors of residual hypertriglyceridemia according to statin use in U.S. adults with diabetes. Diabetes. 2018;67 (Supplement 1):332‐OR. [Google Scholar]
- 24. Miselli M‐A, Dalla Nora E, Passaro A, Tomasi F, Zuliani G. Plasma triglycerides predict ten‐years all‐cause mortality in outpatients with type 2 diabetes mellitus: a longitudinal observational study. Cardiovasc Diabetol. 2014;13:135. [DOI] [PMC free article] [PubMed] [Google Scholar]
- 25. Ginsberg HN, Elam MB, Lovato LC, et al. Effects of combination lipid therapy in type 2 diabetes mellitus. N Engl J Med. 2010;362:1563‐1574. [DOI] [PMC free article] [PubMed] [Google Scholar]
- 26. Lee JS, Chang PY, Zhang Y, Kizer JR, Best LG, Howard BV. Triglyceride and HDL‐C dyslipidemia and risks of coronary heart disease and ischemic stroke by glycemic dysregulation status: the strong heart study. Diabetes Care. 2017;40:529‐537. [DOI] [PMC free article] [PubMed] [Google Scholar]
- 27. Hokanson JE, Austin MA. Plasma triglyceride level is a risk factor for cardiovascular disease independent of high‐density lipoprotein cholesterol: a meta‐analysis of population‐based prospective studies. J Cardiovasc Risk. 1996;3:213‐219. [PubMed] [Google Scholar]
- 28. Sarwar N, Danesh J, Eiriksdottir G, et al. Triglycerides and the risk of coronary heart disease: 10,158 incident cases among 262,525 participants in 29 Western prospective studies. Circulation. 2007;115:450‐458. [DOI] [PubMed] [Google Scholar]
- 29. Patel A, Barzi F, Jamrozik K, et al. Serum triglycerides as a risk factor for cardiovascular diseases in the Asia‐Pacific region. Circulation. 2004;110:2678‐2686. [DOI] [PubMed] [Google Scholar]
- 30. Boden WE, Probstfield JL, Anderson T, et al. Niacin in patients with low HDL cholesterol levels receiving intensive statin therapy. N Engl J Med. 2011;365:2255‐2267. [DOI] [PubMed] [Google Scholar]
- 31. Landray MJ, Haynes R, Hopewell JC, et al. Effects of extended‐release niacin with laropiprant in high‐risk patients. N Engl J Med. 2014;371:203‐212. [DOI] [PubMed] [Google Scholar]
- 32. Keech A, Simes RJ, Barter P, et al. Effects of long‐term fenofibrate therapy on cardiovascular events in 9795 people with type 2 diabetes mellitus (the FIELD study): randomised controlled trial. Lancet. 2005;366:1849‐1861. [DOI] [PubMed] [Google Scholar]
- 33. Bhatt DL, Steg PG, Brinton EA, et al. Rationale and design of REDUCE‐IT: reduction of cardiovascular events with Icosapent ethyl‐intervention trial. Clin Cardiol. 2017;40:138‐148. [DOI] [PMC free article] [PubMed] [Google Scholar]
- 34. ClinicalTrials.gov . Outcomes Study to Assess STatin Residual Risk Reduction With EpaNova in HiGh CV Riak PatienTs With Hypertriglyceridemia (STRENGTH). July 2018. ClinicalTrials.gov Identifier: NCT02104817.
- 35. ClinicalTrials.gov . Pemafibrate to Reduce Cardiovascular OutcoMes by Reducing Triglycerides IN patiENts With diabeTes (PROMINENT). September 2018. ClinicalTrials.gov Identifier: NCT03071692. [DOI] [PubMed]
- 36. Nicholls SJ, Lincoff AM, Bash D, et al. Assessment of Omega‐3 carboxylic acids in statin treated patients with high levels of triglycerides and low levels of high density lipoprotein cholesterol: rationale and design of the STRENGTH trial. Clin Cardiol. 2018;18:109‐115. [DOI] [PMC free article] [PubMed] [Google Scholar]
- 37. Driver SL, Martin SS, Gluckman TJ, Clary JM, Blumenthal RS, Stone NJ. Fasting or nonfasting lipid measurements: it depends on the question. J Am Coll Cardiol. 2016;67:1227‐1234. [DOI] [PubMed] [Google Scholar]
- 38. Bansal S, Buring JE, Rifai N, Mora S, Sacks FM, Ridker PM. Fasting compared with nonfasting triglycerides and risk of cardiovascular events in women. JAMA. 2007;298:309‐316. [DOI] [PubMed] [Google Scholar]
- 39. Mora S, Rifai N, Buring JE, Ridker PM. Fasting compared with nonfasting lipids and apolipoproteins for predicting incident cardiovascular events. Circulation. 2008;118:993‐1001. [DOI] [PMC free article] [PubMed] [Google Scholar]
- 40. Eberly LE, Stamler J, Neaton JD. Relation of triglyceride levels, fasting and nonfasting, to fatal and nonfatal coronary heart disease. Arch Intern Med. 2003;163:1077‐1083. [DOI] [PubMed] [Google Scholar]
- 41. Schaefer EJ, Audelin MC, McNamara JR, et al. Comparison of fasting and postprandial plasma lipoproteins in subjects with and without coronary heart disease. Am J Cardiol. 2001;88:1129‐1133. [DOI] [PubMed] [Google Scholar]
Associated Data
This section collects any data citations, data availability statements, or supplementary materials included in this article.
Supplementary Materials
Figure S1 Consort diagram of inclusion and exclusion criteria.