

Abstract
Background
Chemokines produced by adipose tissue (AT) are involved in the development of chronic low‐grade inflammation in obese humans and rodents. AT CCL19 expression in obesity and its association with metabolic inflammation and insulin resistance are poorly understood. This study aimed to investigate the effects of CCL19 gene expression on inflammatory markers in subcutaneous AT and insulin resistance.
Methods
Subcutaneous adipose samples were collected from 56 non‐diabetic (26—obese, 21—overweight, and 9—lean) individuals. Expression of CCL19 and inflammatory markers was determined using real‐time RT‐PCR. Plasma C‐reactive protein (CRP) and adiponectin were measured by ELISA. Insulin sensitivity was assessed using homeostasis model assessment index (HOMA).
Results
CCL19 expression was significantly higher in obese compared with lean individuals (P < 0.034). The elevated expression of CCL19 associated positively with body mass index (r = 0.253; P = 0.049). CCL19 expression correlated positively with IL‐8 (r = 0.39; P = 0.006), IL‐12 (r = 0.43; P = 0.003), IP‐10 (r = 0.25; P = 0.07), CCL5 (r = 0.37; P = 0.011), CCR2 (r = 0.44; P = 0.001), and CCR5 (r = 0.35; P = 0.009). Additionally, CCL19 was positively correlated with triglycerides (TG: r = 0.41; P = 0.001), fasting blood glucose (FBG: r = 0.49; P < 0.0001), glycated haemoglobin (HbA1c: r = 0.396; P = 0.001), and CRP (r = 0.387; P = 0.019) whereas it had negative association with HDL cholesterol (r = −0.282; P = 0.035) and adiponectin (−0.393; P = 0.019). Notably, HOMA‐IR correlated positively with CCL19 (r = 0.38; P = 0.01). In multiple regression analysis, CCL19 is an independent predictor of IL‐8 and IL‐12.
Conclusions
These data demonstrate that increased AT expression of CCL19 in obesity may represent a molecular link between metabolic inflammation and insulin resistance.
Keywords: adipose tissue, CCL19, insulin resistance, metabolic inflammation, obesity
1. INTRODUCTION
Obesity is a leading cause of metabolic syndrome, T2D development, and its various complications.1 Alongside its role as a storage depot, adipose tissue acts as an endocrine organ that releases a number of proteins known as adipocytokines or adipokines which are involved in the development of systemic inflammation.2 Obesity mediated chronic low‐grade inflammation is called metabolic inflammation that is manifested by increased plasma levels of systemic inflammatory C‐reactive protein (CRP), adipokines including interleukin 1‐beta (IL‐1β), tumour necrosis factor alpha (TNF‐α), interleukin 6 (IL‐6), interleukin 8 (IL‐8 or CXCL8), interleukin‐12 (IL‐12), and hormone leptin. TNF‐α, IL‐6, IL‐8, and IL‐12 are implicated in insulin resistance (a pathological condition in which cells fail to respond to the insulin) and T2D.3, 4, 5 In addition to cytokines/chemokines, increased levels of oxidative stress have been documented in the state of obesity and insulin resistance as indicated by the increased expression of free radicals, also called reactive oxygen species (ROS), and low antioxidant capacity.6 This imbalance of oxidative/antioxidative status in obesity together with metabolic inflammation may lead to increased risk of T2D development and associated complications.7, 8
The precise mechanisms related to metabolic inflammation and insulin resistance are still unclear. Increased production of chemoattractants by inflamed adipose tissue leads to recruitment of monocytes, neutrophils, and lymphocytes. These immune cells exacerbate adipose tissue inflammation by producing inflammatory factors including chemokines and cytokines. Chemokines, including CCL2, CCL5, and IL‐8, are involved in the migration of immune cells in the adipose tissue in obesity and aggravate metabolic inflammation and insulin resistance.9 Several chemokines (CCL2, CCL3, CCL5, CCL7, CCL8, CCL11) as well as chemokine receptors (CCR1, CCR2, CCR3, CCR5) were associated with obesity and metabolic inflammation.10 CCL19, macrophage inflammatory protein (MIP)‐3β, has been identified to play an important role in several inflammatory conditions including multiple sclerosis,11 atherosclerosis,12 and rheumatoid arthritis.13 It has been reported that mice lacking CCL19 show protection from diet induced obesity and insulin resistance.14 However, the human adipose tissue expression of CCL19 and its relationship with other inflammatory and metabolic markers in obesity remains unclear. Herein, we report elevated CCL19 gene expression in the adipose tissue samples from obese individuals and its association with inflammatory and insulin resistance markers.
2. MATERIAL AND METHODS
2.1. Study population and anthropometric measurements
A total of 56 non‐diabetic (26 obese, 21 overweight, and 9 lean) individuals were recruited in this study. The participants were classified as lean, overweight, and obese based on their body mass index (BMI). All participants gave written informed consent, and the study was approved by ethics committee of Dasman Diabetes Institute, Kuwait. Height and weight were measured using calibrated portable electronic weighing scales and portable inflexible height measuring bars; the waist circumference was measured using constant tension tape. The whole‐body composition including percent body fat, soft lean mass, and total body water was measured using IOI353 Body Composition Analyser (Jawon Medical, South Korea). BMI was calculated using standard formula: BMI = body weight (kg) / height (m2). The characteristics of the participants are summarized in Table 1.
Table 1.
Anthropometric, clinical, and biochemical characteristics of the study participants
| Physical and Biochemical Characteristics | Lean (n = 9) (Mean ± SD) | Overweight (n = 21) (Mean ± SD) | Obese (n = 26) (Mean ± SD) | |
|---|---|---|---|---|
| Age (years) | 41 ± 7 | 43 ± 11 | 44 ± 12 | |
| Weight (kg) | 60.5 ± 9.5 | 79.1 ± 9.5 | 93.1 ± 12.8 | |
| Height (cm) | 1.64 ± 0.09 | 1.67 ± 0.10 | 1.63 ± 0.10 | |
| BMI (kg/m 2 ) | 22.7 ± 2.4 | 28.3 ± 1.1 | 34.7 ± 2.7 | |
| Waist circumference (cm) | 79.3 ± 11.7 | 95.1 ± 8.8 | 107.2 ± 12.4 | |
| Body fat (%) | 29.1 ± 6.2 | 32.5 ± 4.8 | 39.4 ± 4.2 | |
| Fasting blood glucose (mmol/L) | 4.8 ± 0.4 | 5.5 ± 1.4 | 5.4 ± 0.8 | |
| Triglycerides (mmol/L) | 0.65 ± 0.24 | 1.17 ± 0.60 | 1.33 ± 0.80 | |
| Total cholesterol (mmol/L) | 5.2 ± 1.1 | 4.9 ± 0.7 | 5.2 ± 1.0 | |
| HDL cholesterol (mmol/L) | 1.7 ± 0.53 | 1.26 ± 0.28 | 1.17 ± 0.30 | |
| Insulin con. (mU/L) | 9.4 ± 7.7 | 13.00 ± 14.6 | 22.3 ± 23.9 | |
| HOMA‐IR | 1.8 ± 1.4 | 3.1 ± 3.4 | 5.7 ± 5.8 |
Abbreviations: BMI, body mass index; HDL, high‐density lipoprotein; HOMA, homeostatic model assessment; SD, standard deviation.
2.2. Collection of subcutaneous adipose tissue
Human adipose tissue samples (~0.5 g) were collected via abdominal subcutaneous fat pad biopsy lateral to the umbilicus using standard surgical method. Briefly, the periumbilical area was sterilized by alcohol swabbing and then locally anaesthetised using 2% lidocaine (2 mL). Through a small superficial skin incision (0.5 cm), fat tissue was collected.15 After removal, the biopsy tissue was further incised into smaller pieces, rinsed in cold phosphate buffered saline, fixed in 4% paraformaldehyde for 24 hours, and then embedded in paraffin for further use. At the same time, freshly collected adipose tissue samples (~50‐100 mg) were preserved in RNAlater and stored at −80°C until use.16
2.3. Measurement of metabolic inflammatory markers
Peripheral blood was collected from overnight‐fasted individuals and analysed for fasting blood glucose (FBG), lipid profile, glycated haemoglobin (HbA1c), fasting insulin, CRP, and adiponectin. Glucose and lipid profiles (plasma triglycerides, HDL, and cholesterol level) were measured using Siemens Dimension RXL chemistry analyser (diamond Diagnostics Holliston, MA). Glycated haemoglobin (HbA1c) was measured using Variant device (BioRad, Hercules, CA, USA). HOMA‐IR as a measure of insulin resistance was calculated from basal (fasting) glucose and insulin concentrations using the following formula:
HOMA‐IR = fasting insulin (μU/L) × fasting glucose (nmol/L) / 22.5.
Plasma high sensitivity CRP (CRP) levels were measured by ELISA (Biovendor, USA), and plasma adiponectin was measured using immunobead assays (Luminex, Austin, TX, USA). All assays were performed following instructions of the manufacturers.
2.4. Real‐time RT‐PCR
Total cellular RNA from adipose tissue (80 mg) was purified using RNeasy kit (Qiagen, Valencia, CA., USA) and following the manufacturer's instructions. RNA samples were reverse transcribed into cDNA as instructed (High Capacity cDNA Reverse Transcription kit; Applied Biosystems, CA, USA). To perform real‐time RT‐PCR, cDNA samples (50 ng each) were amplified (40 cycles) using TaqMan Gene Expression Master Mix (Applied Biosystems, CA, USA) and gene‐specific 20× TaqMan gene expression assays (final concentration of the reaction mixture is 1X) as follows: (CCL19) Hs00171149_m1; (IL‐1β) Hs01555410_m1; (IL‐5) Hs01548712_g1; (IL‐6) Hs00985639_m1; (IL‐8) Hs00174103_m1; (IL‐10) Hs00961622_m1; (IL‐12a) Hs01073447_m1; (IL‐18) Hs01038788_m1; (IL‐23A) Hs00900828_g1; (CCL2)Hs00234140_m1; (CCL5) Hs00982282_m1; (CCL7) Hs00171147_m1; (CCL8)Hs04187715_m1; (CCL11) Hs00237013_m1; (CXCL10/IP‐10) Hs01124251_g1; (CCL20) Hs01011368_m1; (CCR1) Hs00928897_s1; (CCR2) Hs00704702_s1; and (GAPDH) Hs03929097_g1 (Applied Biosystems, CA, USA) containing forward and reverse primers and target‐specific TaqMan MGB probe labelled with FAM dye at the 5′ end and NFQ‐MGB at the 3′ end of the probe using 7500 Fast Real‐Time PCR System (Applied Biosystems, CA, USA). Each cycle involved denaturation (15 seconds at 95°C), annealing/extension (1 minute at 60°C) after uracil DNA glycosylases (UDG) activation (2 minutes at 50°C) and AmpliTaq gold enzyme (10 minutes at 95°C) activation. The amplified GAPDH expression was used as internal control to normalize individual sample differences. Expression level of each gene target relative to control (lean adipose tissue) was calculated using 2−ΔΔCt method, and the relative mRNA expression was expressed as fold expression over the average control gene expression.17
2.5. Statistical analysis
Statistical analysis was performed using GraphPad Prism software (La Jolla, CA, USA) and SPSS for Windows version 19.01 (IBM SPSS Inc., USA). Data are shown as mean ± standard deviation values, unless otherwise indicated. Unpaired Student t‐test was used to compare means between groups. Correlation and stepwise multiple regression analysis were performed to determine association between different variables. For all analyses, P value <0.05 was considered significant.
3. RESULTS
3.1. Increased CCL19 gene expression in obesity
CCL19 gene expression is modulated in various inflammatory disorders. We asked whether obesity changes the expression of CCL19 in the adipose tissue. To this end, we found that CCL19 gene expression in the adipose tissue was significantly elevated in obese individuals as compared with lean subjects (Obese: 3.86 Fold; Lean: 1.75 Fold; P = 0.034) (Figure 1A and B). Furthermore, elevated CCL19 gene expression correlated positively with BMI (r = 0.253, P = 0.049) (Figure 1C).
Figure 1.
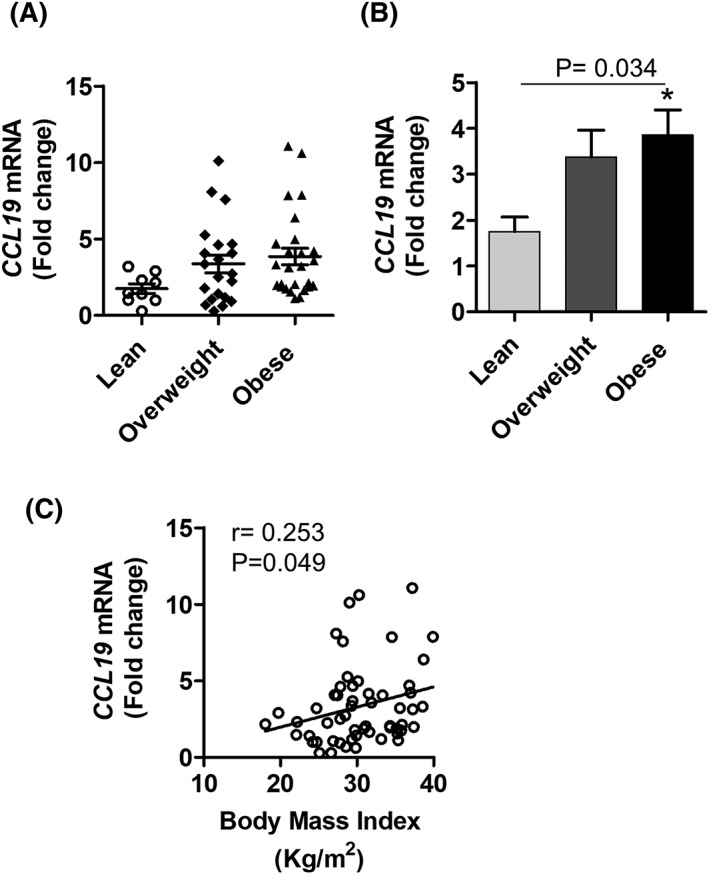
Increased adipose tissue CCL19 gene expression in obese individual. Adipose tissue samples were obtained from 56 individuals. Samples were divided into lean, overweight, and obese sub‐groups. Total cellular RNA was isolated from adipose tissue, and CCL19 gene expression was determined by real time RT‐PCR. Relative mRNA expression was presented as fold change. A, Each dot represents the individual value of CCL19, and the line represents mean value. B, CCL19 levels in each group were shown in bar graph. C, Correlation between CCL19 gene expression and BMI (kg/m2). Data are represented as mean ± SEM. Statistical analysis between groups was done using two‐tailed Student's t‐test. P < 0.05 was considered as statistically significant
3.2. Increased CCL19 gene expression in the adipose tissue relates to inflammatory signatures
The role of adipose tissue CCL19 expression in metabolic inflammation remains unclear. Next, we wanted to know whether the elevated CCL19 mRNA expression in obese adipose tissue was concordant with the inflammatory markers in this compartment. In this regard, as shown in Table 2, CCL‐19 associated positively with proinflammatory markers including IL‐8 (r = 0.39; P = 0.006), IL‐12 (r = 0.43; P = 0.003), IP‐10 (r = 0.25; P = 0.07), CCL5 (r = 0.37; P = 0.011), CCL20 (r = 0.298; P = 0.06), CCR2 (r = 0.44; P = 0.001), and CCR5 (r = 0.35; P = 0.009). However, CCL19 has no association with IL‐1b, IL‐6, TNF‐α, IL‐10, IL‐18, IL‐23, CCR1, CCL2, and CCL7.
Table 2.
Correlation of CCL19 with various cytokines/chemokines in non‐diabetic individuals
| Marker | Correlation Coefficient r | P‐Value |
|---|---|---|
| IL‐1β | 0.187 | 0.224 |
| IL‐5 | 0.020 | 0.599 |
| IL‐6 | 0.171 | 0.236 |
| IL‐8 | 0.390 | 0.006** |
| IL‐10 | 0.041 | 0.757 |
| IL‐12 | 0.436 | 0.003** |
| IL‐18 | 0.090 | 0.525 |
| IL‐23 | 0.183 | 0.179 |
| CCL2 | 0.062 | 0.659 |
| CCL5 | 0.370 | 0.011* |
| CCL7 | 0.273 | 0.044* |
| CCL8 | 0.064 | 0.600 |
| CCL11 | 0.320 | 0.820 |
| IP‐10 | 0.245 | 0.075 |
| CCL20 | 0.298 | 0.060 |
| CCR1 | 0.960 | 0.46 |
| CCR2 | 0.441 | 0.001** |
| CCR5 | 0.348 | 0.009** |
Abbreviations: CCL, CC chemokine ligand; CCR, CC chemokine receptor; CXCL, (C–X–C motif) ligand; IL, interleukin; TGF‐β, transforming growth factor beta; TNF‐α, tumour necrosis factor alpha; IP‐10, interferon‐gamma‐induced protein. Correlations between the biomarkers were examined using the Pearson correlation coefficient.
Significant (P < 0.05).
Highly significant (P < 0.01).
3.3. Association between adipose tissue CCL19 expression and clinical metabolic parameters
Next, we asked whether the changes in adipose tissue CCL19 gene expression associated with clinico‐metabolic signatures. To this end, we measured serum levels of triglycerides, total cholesterol, high density lipoprotein (HDL) cholesterol, low density lipoprotein (LDL) cholesterol, FBG, HbA1c, insulin, adiponectin, and CRP. As shown in Table 3, CCL19 expression was found to be associated positively with FBG (r = 0.492, P < 0.0001), HbA1c (r = 0.396, P = 0.001), and TGL (r = 0.406, P = 0.001). However, CCL19 correlated negatively with HDL (r = −0.282, P = 0.035) and adiponectin (r = −0.393, P = 0.019). Of note, CCL19 expression correlated directly with levels of systemic inflammatory marker CRP (r = 0.387, P = 0.019). Finally, insulin resistance (high homeostatic model assessment of insulin resistance [HOMA‐IR]) correlated with elevated CCL19 expression in adipose tissue from obese human subjects (r = 0.377; P = 0.019).
Table 3.
Association between CCL19 expression and clinical metabolic parameters
| Clinico‐Metabolic Marker | Correlation Coefficient r | P |
|---|---|---|
| HOMA‐IR | 0.377 | 0.019* |
| Body fasting glucose (mmol/L) | 0.492 | 0.0001 *** |
| HbA1C (%) | 0.396 | 0.001 ** |
| C‐reactive protein (mg/mL) | 0.387 | 0.019* |
| Adiponectin (ug/mL) | −0.393 | 0.019* |
| Triglycerides (mmol/L) | 0.406 | 0.001** |
| HDL cholesterol (mmol/L) | −0.282 | 0.035* |
| LDL cholesterol (mmol/L) | −0.058 | 0.665 |
| Total cholesterol (mmol/L) | −0.016 | 0.904 |
Abbreviations: HbA1c, glycosylated haemoglobin; HDL, high‐density lipoprotein; LDL, low‐density lipoprotein.
Correlations between the biomarkers were examined using the Pearson correlation coefficient.
Significant (P < 0.01).
Very significant (P < 0.001).
Highly significant (P < 0.0001).
In order to determine which inflammatory and clinical metabolic parameters independently correlated with CCL19, those parameters having significant association with CCL19 were included for further multiple stepwise regression analysis. Multiple regression analysis indicated that IL‐12 (β = 0.492; P = 0.009) and IL‐8 (β = 0.259; P < 0.001; F2, 18 = 16.240, P < 0.001) were independently associated with CCL19.
4. DISCUSSION
In obesity, pro‐inflammatory chemokines/cytokines are considered to trigger systemic and local inflammatory changes leading to insulin resistance, T2D, and related complications.18, 19, 20, 21, 22 The chemokine CCL19 has been associated with a number of inflammatory conditions including multiple sclerosis23, atherosclerosis,24 and rheumatoid arthritis .25 In the present study, we show that CCL19 gene expression was significantly elevated in the adipose tissues of obese non‐diabetic individuals as compared with lean individuals and the changes correlated with BMI. Few close cluster values of CCL19 were noted in both overweight and obese groups, which could be due the similar clinical characteristics among those populations. Moreover, individuals in both groups have CCL19 values closer to lean group which may be due the reason that these individuals are immunologically comparable to lean group. Correlation of CCL19 with BMI indicates that CCL19 expression is increased with the levels of adiposity. It suggests that advancement in obesity could be a predictor for the CCL19 gene expression in adipose tissue. The white adipose tissue is a site for excessive energy storage and is also an active endocrine organ that secretes adipokines.26 We sought to determine how the changes in the adipose tissue expression of CCL19 related with local expression of the inflammatory mediators. To this end, we found that the transcript levels of IL‐8, IL‐12, CCL5, CCR2, and CCR5 were significantly correlated positively with CCL19 in the adipose tissue. The data suggest that obesity may be the predictor of increased adipose tissue expression of CCL19. Levels of IL‐8 and IL‐12 in obese subjects were higher than in lean subjects. These two cytokines are produced and released by various cells including monocytes/macrophages accumulated into the human adipose tissue. IL‐8 and IL‐12 have been implicated in the pathogenesis of various inflammatory disorders including atherosclerosis, coronary heart disease, and diabetes because levels of both cytokines are elevated in these diseases. Plasma levels of IL‐8 and IL‐12 have been found to be significantly increased in patients with both type 1 and type 2 diabetes compared with healthy subjects.27 Circulating IL‐8 and IL‐12 correlates with measures of adiposity and insulin sensitivity, suggesting an involvement of IL‐8 and IL‐12 in metabolic inflammation. IL‐12 expression is most abundant in adipose tissue; this report further investigated the developmental role of obesity on IL‐12 family regulation in white adipose tissue WAT as well as the regulation of these cytokines and receptors in cultured adipocytes. IL‐12 acts as a potential mediator linking excess nutrient intake to metabolic diseases such as insulin resistance, diabetes, and heart disease. Our results indicate that CCL19 correlated with IL‐8 and IL‐12 in adipose tissue compartment in obesity setting in a similar way like other chemokines. CCL19 association with IL‐8 and IL‐12 could partially enhance the metabolic inflammation and insulin resistance. Our multivariate analysis shows that CCL19 is independently associated with IL‐12 which suggests that CCL19 plays a significant role in setting a condition which favours the production of IL‐12.
In regard with chemokine link with metabolic disease, increased adipose tissue expression of CCL2 and CCL3 was reported in insulin‐resistant compared with insulin‐sensitive individuals, suggesting that insulin levels regulated the expression of CCL2 and CCL3 in the adipose tissue. In our study, we showed that there is higher CCL19 expression in obese as compared with lean individuals. It is also clear from our results that obesity was a factor in upregulating CCL19 expression in the adipose tissues. In support of this argument, adipose tissue levels of several chemokines (CCL2, CCL3, CCL5, CCL7, CCL8, and CCL11) as well as chemokine receptors (CCR1, CCR2, CCR3, CCR5) were linked with obesity and associated metabolic inflammation. In our study as well, elevated CCL19 expression in obese individuals correlated positively with CCL5, CCR5, and CCR2 expression. Similar changes in CCL5 CCR5 and CCR2 expression in obesity/T2D were reported previously.10 Similar changes in these chemokine levels have been linked to increased macrophage accumulation in the adipose tissue. Obese humans with metabolic syndrome had higher mRNA levels of CCL5 and CCR5 in subcutaneous adipose tissue than lean humans.28 Our data showing association of CCL19 with CCL5/CCR5 regarding non‐diabetic obese individuals suggests that obesity may be a factor involved in this relationship. We further found that CCL19 gene expression in the adipose tissue samples from non‐diabetic individuals correlated positively with local gene expression of inflammatory cytokines including IL‐8 IL‐12. However, the CCL19 adipose tissue gene expression was not correlated with that of TNF‐α and IL‐6. This indicates that only CCL19 has a selected association with IL‐8 and IL‐12. Chemokines, released by activated leukocytes, may lead to the induction of various proinflammatory cytokines including IL‐1β, TNF‐α, and IL‐6.29, 30 In state of obesity, insulin resistance is generally caused by low‐grade systemic inflammation as well as adipose tissue inflammation which have been attributed, in part, to increased production of inflammatory mediators such as IL‐12, IL‐8, IL‐18, osteopontin, TNF‐α, IL‐1b, and IL‐6.26, 31, 32 Activated immune cells infiltrate adipose tissue in obesity and contribute to the pathogenesis of insulin resistance, and the chemokines are major driver of extravasation and adipose tissue colonization of these inflammatory actors. Besides, the inflamed adipose tissue per se becomes a potential source of inflammatory adipokines in obesity.
Our data show higher levels of CCL19 correlated with CRP obese individuals which suggests the CCL19 link with systemic inflammation. The expression of CCL19 may be cooperatively linked with CRP as a previous study stated that CRP induced cellular activation and production of chemokines.33 CRP is independently associated with HOMA‐IR.34 Adiponectin is secreted by adipose tissue and played an important role in glucose metabolism and fatty acid oxidation. It is well documented that the circulatory levels of adiponectin correlate inversely with body fat percentage.35 CCL19 gene expression that showed a positive relationship with BMI in our study, as expected, was found to correlate negatively with the plasma adiponectin levels in these individuals. On the contrary, CCL19 gene expression correlated positively with plasma triglycerides. In agreement, a significant correlation was found between obesity and plasma triglyceridemia.36 Increased triglyceride levels in obese humans and obese mice were stated as a risk factor for cardiovascular disease, independently of the high‐density lipoprotein cholesterol levels.37 Hypertriglyceridemia with low high‐density lipoprotein cholesterol is regarded as a key feature of metabolic syndrome in obese individuals. Interestingly, our data show a positive association of CCL19 expression with FBG and HbA1c levels in obese individuals which implies that increased CCL19 expression may also be linked with hyperglycemia and/or insulin resistance. HOMA‐IR is correlated positively with CCL19. More importantly, a significantly higher CCL19 and its association with CCL5, CCR5, IL‐8, and IL‐12 expression in obesity suggests that these factors may contribute cooperatively for the insulin resistance induction in obesity.
In conclusion, our data show that adipose tissue CCL19 gene expression is increased in obesity and positively correlated with the metabolic and local inflammatory signatures along with insulin resistance markers, suggesting that CCL19 may be an important marker for predicting metabolic inflammation and insulin resistance. The study has clinical significance as the approaches intending CCL19 suppression in adipose tissue may improve metabolic complications in obesity or T2D.
AUTHOR CONTRIBUTIONS
S.K. participated in performing experiments, collecting, and analysing data. F.A. participated in analysing and writing manuscript. M.A. participated in performing experiments. S.R. participated in performing some statistical analysis. J.T. reviewed and critically commented on manuscript, and R.A. conceived the idea, guided research study, provided material support, procured funds, wrote and edited, and approved the manuscript for submission.
CONFLICT OF INTERESTS
None declared.
ACKNOWLEDGEMENTS
This study was supported by Kuwait Foundation for Advancement of Sciences (KFAS) (Grant #: RA2010‐003 and RA AM 2016‐007). The authors also thank Dr Fahad Al‐Ghamlas for his help with patients' recruitment.
Kochumon S, Al‐Rashed F, Abu‐Farha M, Devarajan S, Tuomilehto J, Ahmad R. Adipose tissue expression of CCL19 chemokine is positively associated with insulin resistance. Diabetes Metab Res Rev. 2019;35:e3087 10.1002/dmrr.3087
REFERENCES
- 1. Civera M, Urios A, Garcia‐Torres ML, et al. Relationship between insulin resistance, inflammation and liver cell apoptosis in patients with severe obesity. Diabetes Metab Res Rev. 2010;26(3):187‐192. [DOI] [PubMed] [Google Scholar]
- 2. Tilg H, Moschen AR. Adipocytokines: mediators linking adipose tissue, inflammation and immunity. Nat Rev Immunol. 2006;6(10):772‐783. Epub 2006/09/26 [DOI] [PubMed] [Google Scholar]
- 3. Sjöholm A, Nyström T. Inflammation and the etiology of type 2 diabetes. Diabetes Metab Res Rev. 2006;22(1):4‐10. [DOI] [PubMed] [Google Scholar]
- 4. Akash MSH, Rehman K, Liaqat A. Tumor necrosis factor‐alpha: role in development of insulin resistance and pathogenesis of type 2 diabetes mellitus. J Cell Biochem. 2018;119(1):105‐110. Epub 2017/06/02 [DOI] [PubMed] [Google Scholar]
- 5. Rehman K, Akash MSH, Liaqat A, Kamal S, Qadir MI, Rasul A. Role of Interleukin‐6 in development of insulin resistance and type 2 diabetes mellitus. Crit Rev Eukaryot Gene Expr. 2017;27(3):229‐236. Epub 2017/12/05 [DOI] [PubMed] [Google Scholar]
- 6. Rehman K, Akash MS. Mechanisms of inflammatory responses and development of insulin resistance: how are they interlinked? J Biomed Sci. 2016;23(1):87. Epub 2016/12/04 [DOI] [PMC free article] [PubMed] [Google Scholar]
- 7. Akash MS, Rehman K, Chen S. Role of inflammatory mechanisms in pathogenesis of type 2 diabetes mellitus. J Cell Biochem. 2013;114(3):525‐531. Epub 2012/09/20 [DOI] [PubMed] [Google Scholar]
- 8. Rehman K, Akash MSH. Mechanism of generation of oxidative stress and pathophysiology of type 2 diabetes mellitus: how are they interlinked? J Cell Biochem. 2017;118(11):3577‐3585. Epub 2017/05/02 [DOI] [PubMed] [Google Scholar]
- 9. Stechova K, Bohmova K, Vrabelova Z, et al. High T‐helper‐1 cytokines but low T‐helper‐3 cytokines, inflammatory cytokines and chemokines in children with high risk of developing type 1 diabetes. Diabetes Metab Res Rev. 2007;23(6):462‐471. [DOI] [PubMed] [Google Scholar]
- 10. Huber J, Kiefer FW, Zeyda M, et al. CC chemokine and CC chemokine receptor profiles in visceral and subcutaneous adipose tissue are altered in human obesity. J Clin Endocrinol Metab. 2008;93(8):3215‐3221. Epub 2008/05/20 [DOI] [PubMed] [Google Scholar]
- 11. Sindern E. Role of chemokines and their receptors in the pathogenesis of multiple sclerosis. Frontiers in Bioscience: A Journal and Virtual Library. 2004;9(1‐3):457‐463. Epub 2004/02/10. [DOI] [PubMed] [Google Scholar]
- 12. Tatara Y, Ohishi M, Yamamoto K, et al. Macrophage inflammatory protein‐1beta induced cell adhesion with increased intracellular reactive oxygen species. J Mol Cell Cardiol. 2009;47(1):104‐111. Epub 2009/03/31 [DOI] [PubMed] [Google Scholar]
- 13. Koch AE. Chemokines and their receptors in rheumatoid arthritis: future targets? Arthritis Rheum. 2005;52(3):710‐721. Epub 2005/03/08 [DOI] [PubMed] [Google Scholar]
- 14. Sano T, Iwashita M, Nagayasu S, et al. Protection from diet‐induced obesity and insulin resistance in mice lacking CCL19‐CCR7 signaling. Obesity (Silver Spring). 2015;23(7):1460‐1471. Epub 2015/06/23 [DOI] [PubMed] [Google Scholar]
- 15. Sindhu S, Thomas R, Shihab P, Sriraman D, Behbehani K, Ahmad R. Obesity is a positive modulator of IL‐6R and IL‐6 expression in the subcutaneous adipose tissue: significance for metabolic inflammation. PLoS One. 2015;10(7):e0133494. Epub 2015/07/23 [DOI] [PMC free article] [PubMed] [Google Scholar]
- 16. Ahmad R, Shihab PK, Thomas R, et al. Increased expression of the interleukin‐1 receptor‐associated kinase (IRAK)‐1 is associated with adipose tissue inflammatory state in obesity. Diabetol Metab Syndr. 2015;7(1):71. [DOI] [PMC free article] [PubMed] [Google Scholar]
- 17. Ahmad R, Al‐Mass A, Al‐Ghawas D, et al. Interaction of osteopontin with IL‐18 in obese individuals: implications for insulin resistance. PLoS One. 2013;8(5):e63944. Epub 2013/05/13 [DOI] [PMC free article] [PubMed] [Google Scholar]
- 18. Ahmad R, Thomas R, Kochumon S, Sindhu S. Increased adipose tissue expression of IL‐18R and its ligand IL‐18 associates with inflammation and insulin resistance in obesity. Immun Inflamm Dis. 2017;5(3):318‐335. Epub 2017/05/15 [DOI] [PMC free article] [PubMed] [Google Scholar]
- 19. Shoelson SE, Lee J, Goldfine AB. Inflammation and insulin resistance. J Clin Invest. 2006;116(7):1793‐1801. [DOI] [PMC free article] [PubMed] [Google Scholar]
- 20. Makki K, Froguel P, Wolowczuk I. Adipose tissue in obesity‐related inflammation and insulin resistance: cells, cytokines, and chemokines. ISRN Inflamm. 2013;2013:139239. Epub 2013/12/22 [DOI] [PMC free article] [PubMed] [Google Scholar]
- 21. Sindhu S, Akhter N, Arefanian H, et al. Increased circulatory levels of fractalkine (CX3CL1) are associated with inflammatory chemokines and cytokines in individuals with type‐2 diabetes. J Diabetes Metab Disord. 2017;16(1):15. Epub 2017/04/04. [DOI] [PMC free article] [PubMed] [Google Scholar]
- 22. Ahmad R, Al‐Mass A, Atizado V, et al. Elevated expression of the toll like receptors 2 and 4 in obese individuals: its significance for obesity‐induced inflammation. J Inflamm (Lond). 2012;9(1):48. [DOI] [PMC free article] [PubMed] [Google Scholar]
- 23. Meinl E, Krumbholz M, Derfuss T, Junker A, Hohlfeld R. Compartmentalization of inflammation in the CNS: a major mechanism driving progressive multiple sclerosis. J Neurol Sci. 2008;274(1‐2):42‐44. Epub 2008/08/19 [DOI] [PubMed] [Google Scholar]
- 24. Burke‐Gaffney A, Brooks AV, Bogle RG. Regulation of chemokine expression in atherosclerosis. Vascul Pharmacol. 2002;38(5):283‐292. [DOI] [PubMed] [Google Scholar]
- 25. Scapini P, Laudanna C, Pinardi C, et al. Neutrophils produce biologically active macrophage inflammatory protein‐3alpha (MIP‐3alpha)/CCL20 and MIP‐3beta/CCL19. Eur J Immunol. 2001;31(7):1981‐1988. [DOI] [PubMed] [Google Scholar]
- 26. Wieser V, Moschen AR, Tilg H. Inflammation, cytokines and insulin resistance: a clinical perspective. Arch Immunol Ther Exp (Warsz). 2013;61(2):119‐125. Epub 2013/01/10 [DOI] [PubMed] [Google Scholar]
- 27. Bruun JM, Lihn AS, Madan AK, et al. Higher production of IL‐8 in visceral vs. subcutaneous adipose tissue. Implication of nonadipose cells in adipose tissue. Am J Physiol Endocrinol Metab. 2004;286(1):E8‐E13. Epub 2003/09/16 [DOI] [PubMed] [Google Scholar]
- 28. Weisberg SP, Hunter D, Huber R, et al. CCR2 modulates inflammatory and metabolic effects of high‐fat feeding. J Clin Invest. 2006;116(1):115‐124. Epub 2005/12/08 [DOI] [PMC free article] [PubMed] [Google Scholar]
- 29. De Groote D, Zangerle PF, Gevaert Y, et al. Direct stimulation of cytokines (IL‐1 beta, TNF‐alpha, IL‐6, IL‐2, IFN‐gamma and GM‐CSF) in whole blood. I. Comparison with isolated PBMC stimulation. Cytokine. 1992;4(3):239‐248. [DOI] [PubMed] [Google Scholar]
- 30. Bardina SV, Michlmayr D, Hoffman KW, et al. Differential roles of chemokines CCL2 and CCL7 in monocytosis and leukocyte migration during West Nile virus infection. J Immunol. 2015;195(9):4306‐4318. Epub 2015/09/23 [DOI] [PMC free article] [PubMed] [Google Scholar]
- 31. Esser N, Legrand‐Poels S, Piette J, Scheen AJ, Paquot N. Inflammation as a link between obesity, metabolic syndrome and type 2 diabetes. Diabetes Res Clin Pract. 2014;105(2):141‐150. Epub 2014/04/13 [DOI] [PubMed] [Google Scholar]
- 32. Daniele G, Guardado Mendoza R, Winnier D, et al. The inflammatory status score including IL‐6, TNF‐α, osteopontin, fractalkine, MCP‐1 and adiponectin underlies whole‐body insulin resistance and hyperglycemia in type 2 diabetes mellitus. Acta Diabetol. 2014;51(1):123‐131. Epub 2013/12/27 [DOI] [PubMed] [Google Scholar]
- 33. Singer K, Lumeng CN. The initiation of metabolic inflammation in childhood obesity. J Clin Invest. 2017;127(1):65‐73. Epub 2017/01/03 [DOI] [PMC free article] [PubMed] [Google Scholar]
- 34. Wang G, Liu Y, Wang A, Tong W, Zhang Y. Biomarkers of inflammation, endothelial dysfunction and insulin resistance in adults of Inner Mongolia, China. Diabetes Metab Res Rev. 2010;26(6):490‐495. [DOI] [PubMed] [Google Scholar]
- 35. Ukkola O, Santaniemi M. Adiponectin: a link between excess adiposity and associated comorbidities? J Mol Med (Berl). 2002;80(11):696‐702. Epub 2002/09/10 [DOI] [PubMed] [Google Scholar]
- 36. Després JP, Moorjani S, Tremblay A, et al. Relation of high plasma triglyceride levels associated with obesity and regional adipose tissue distribution to plasma lipoprotein‐lipid composition in premenopausal women. Clin Invest Med. 1989;12(6):374‐380. [PubMed] [Google Scholar]
- 37. Austin MA. Plasma triglyceride as a risk factor for cardiovascular disease. Can J Cardiol. 1998;14(Suppl B):14B‐17B. [PubMed] [Google Scholar]