Abstract
An increasing amount of evidence indicates that peptidylarginine deiminase isoform 4 (PADI4) plays an important role in tumorigenesis. However, the effects of PADI4 on tumor‐bearing mice are unknown, and no studies have investigated this tumorigenic pathway in an animal model. In the present study, ECA109 cells originating from esophageal squamous cell carcinoma (ESCC) were transfected with PADI4‐expressing lentivirus and were injected into BALB/c nude mice. Tumor size and weight were significantly increased in the mouse tumors established with PADI4‐overexpressing ECA109 cells. PCR array analysis revealed increased CA9 expression in ECA109 cells transfected with a PADI4‐expressing plasmid, while decreased CA9 expression levels were detected in cells transfected with anti‐PADI4 siRNA. Furthermore, up‐regulation of CA9 expression was detected in mouse tumors established with PADI4‐overexpressing cells. Immunohistochemistry detected the increased expression and co‐localization of PADI4 and CA9 in ESCC tissues compared with adjacent non‐tumor tissues and normal tissue controls. These results were verified using Western blotting. Cell proliferation significantly increased or decreased in ECA109 and EC9706 (another ESCC‐originating cell line) cells transfected with a PADI4‐expressing plasmid or anti‐PADI4 siRNA, respectively. The above findings suggest that increased PADI4 expression in ESCC stimulates tumor growth and up‐regulates CA9 expression, which is known to promote metastatic properties in tumor cells.
Keywords: carbonic anhydrase 9 (CA9), esophageal squamous cell carcinoma (ESCC), peptidylarginine deiminase isoform 4 (PADI4)
1. INTRODUCTION
Peptidyl arginine deiminase (PAD) catalyzes the conversion of arginine residues to citrulline residues in the presence of excess calcium. This enzymatic activity is referred as citrullination or, alternatively, as deamination.1, 2, 3, 4 An increasing amount of evidence suggests that peptidylarginine deiminase isoform 4 (PADI4), a PAD family member, is involved in tumor progression.5, 6, 7, 8, 9 We and others have demonstrated marked PADI4 overexpression in many human cancers, including cervical squamous cell carcinoma, gastric carcinoma, lung cancer, ovarian serous papillary adenocarcinoma, and papillary carcinoma of the thyroid.10, 11 Studies have shown that arginine residues R2, R8, R17, and R26 in the Histone 3 tail and the R3 residue in the Histone 4 tail can be deiminated by PADI4. This kind of histone post‐translational modification has the potential to antagonize histone methylation and coordinate with histone deacetylation to regulate gene transcription. Moreover, PADI4 can interact with tumor suppressor p53 to regulate its transcriptional activity.12 We found that PADI4 can stimulate the proliferation, invasion, and migration of ovarian cancer cell line A2480 via p53 signaling.13 We also found that PADI4 is a gastric carcinoma susceptibility gene and that it up‐regulates the expression levels of CXCR2, KRT14, and TNF‐α, which are well‐known activators of angiogenesis, cell proliferation, cell migration, and the immune microenvironment in tumors.14 An anti‐cancer PAD inhibitor is being considered as a potential drug to treat tumors.15 However, the above studies that investigated the tumorigenic role of PADI4 were completed in cultured tumor cell lines. No evidence that shows the effect of PADI4 on tumor development under in vivo conditions exists, and no studies have investigated the tumorigenic pathway of this enzyme in an animal model.
We previously detected significantly increased PADI4 transcription and translation in esophageal squamous cell carcinoma (ESCC) and esophageal adenocarcinoma (EAC) tissues. Furthermore, we found that the PADI4 level is positively correlated with the pathological classification of ESCC. The PADI4 gene has been validated as an esophageal cancer (EC) susceptibility gene.16 These results suggest that PADI4 expression is related to the tumorigenic process of EC. In the current study, we established tumor‐bearing mice with ECA109 cells, which originate from ESCC, that were transfected with a PADI4‐expressing lentivirus before injection. We aimed to determine the effect of PADI4 on tumor growth using the experimental animals. Our study also investigated the down‐stream pathway of PADI4 in ECA109 cells using PCR arrays and then verified the results in EC using the animal tumors established with PADI4‐overexpressing cells.
2. MATERIALS AND METHODS
2.1. Tissue collection
All solid tumor tissues and adjacent tissues used in this study were obtained from patient surgeries at Shandong Province Qianfoshan Hospital in Jinan, Shandong, P. R. China. Tumor diagnosis was carried via histological methods, and the pathological categorization was performed according to the World Health Organization (WHO) classification system.
2.2. Antibodies
The primary antibodies used in this study were against the following proteins: PADI4 (ab128086, Abcam, Cambridge, UK); GAPDH (ab181603, Abcam, Cambridge, UK); carbonic anhydrase 9 (CA9) (ab15086, Abcam); angiopoietin 1 (ANGPT1) (ab102015, Abcam); tyrosine‐protein kinase receptor TIE2 (TEK) (NBP1‐69753SS, NovusBiologicals, Littleton, CO); and His‐tag (12698S, CST, Danvers, MA). The secondary antibodies used in this study were as follows: goat anti‐rabbit antibody: (#s0001, Affinity Biosciences, Cincinnati, OH); goat anti‐mouse antibody: (#s0002, Affinity Biosciences, Cincinnati, OH); donkey anti‐goat antibody: (ab6881, Abcam); goat anti‐rabbit IgG (H + L) highly cross‐adsorbed secondary antibody, Alexa Fluor 488 (A‐11304, Thermo Fisher Scientific, Waltham, MA); and goat anti‐mouse IgG (H + L) highly Cross‐Adsorbed, Alexa Fluor 568 (A‐11301,Thermo Fisher Scientific).
2.3. Quantitative real‐time reverse transcription PCR (qRT‐PCR)
Total RNA from cultured cells or ESCC tissues was extracted using the TRIzol reagent (Life Science, Carlsbad, CA). The extract was reversely transcribed into first‐strand cDNA and used as the PCR template with the primers PADI4‐Q forward (PADI4‐QF) and PADI4‐Q reverse (PADI4‐QR) (Table S1). qRT‐PCR was performed in a 10‐µL mixture total volume, composed of 5 µL of SYBR Green Real‐time PCR Master Mix (Toyobo, Osaka,Japan), 1 µL of cDNA (1:10 diluted), 1 µL of 1 µmol/L forward primer, 1 µL of 1 µmol/L reverse primer and 2 µL of ddH2O. GAPDH (glyceraldehyde‐3‐phosphate dehydrogenase) was used for quantity and quality control. Data were analyzed using the following formula: R = 2−[ΔC sample − ΔCt control], where R is the relative expression level, ΔCt sample is the difference between the target gene Ct and the average GAPDH Ct in the sample, and ΔCt control is the difference between the target gene Ct and the average GAPDH Ct in the control sample.
The expression of ANGPT1, CA9, and TEK was also examined by qRT‐PCR in ECA109 cells with PADI4 overexpression or knockdown. The PCR primers designed for this study are shown in Supplementary Material Table S1.
2.4. Western blot analysis
ESCC tissues (n = 20) and their corresponding adjacent tissues (n = 20) were excised during surgery. Sample tissues (100 μg) were homogenized in RIPA cell lysis solution (Solarbio, Beijing, China) and centrifuged at 12 000g for 15 min at 4°C. The supernatants were collected after centrifugation, and their protein concentrations were determined using a BCA protein assay kit (Beyotime Biotechnology, Shanghai,China). The total protein extract was separated by sodium dodecyl sulfate‐polyacrylamide gel electrophoresis (SDS‐PAGE) and transferred onto a polyvinylidene fluoride (PVDF) membrane. Western blot analysis was conducted using the anti‐PADI4 antibody (1:2000). All primary and secondary antibodies were diluted in 5% nonfat dry skim milk in TBST (Tris buffered saline, pH 7.6) that contained 0.1% Tween 20. Immunoreactive signals were detected with horseradish peroxidase (HRP)‐conjugated secondary antibodies and visualized using Western blotting luminol reagent (Millipore, Bedford, MA). The blotting images were acquired with an Alpha FluorChem E (ProteinSimple, SantaClara, CA). A second PVDF membrane was prepared using the same protocol as that used with the primary blot, and this second membrane was hybridized with anti‐GAPDH antibody to normalize sample loading.
The expression of ANGPT1, CA9 and TEK in ECA109 cells was measured using a similar protocol.
2.5. Immunohistochemistry
Tissue arrays were obtained commercially from Alenabio (ES242, Alenabio, xi'an, China). The array slides contained 10 squamous cell carcinoma and 2 normal tissue samples. The manufacturer provided clinical data for each participant, including his/her age, sex, clinical pathological diagnosis, and origin. The tissue sections were de‐paraffinized and re‐hydrated by standard procedures. Before antibodies were applied, the tissue sections were heated at 95°C for 10 min in citrate buffer solution (Sigma, St. Louis, MO) for antigen recovery, followed by incubation with an endogenous peroxidase inhibitor (MaixinBio, Fuzhou, China) for 30 min at room temperature. After washing with PBS buffer, the sections were incubated with the anti‐PADI4, ANGPT1, CA9, or TEK antibody overnight at 4°C. The specificity and cross‐reactivity of these antibodies were verified by the manufacturer via Western blotting. The immunoreaction was processed using an UltraSensitive TM S‐P Kit (MaixinBio) according to the manufacturer's instructions.
The immunoreactive signals were visualized using immunofluorescent secondary antibodies, which stain the target protein red (Alexa 568 con‐jugated) or green (Alexa 488 conjugated). To determine antibody specificity and to optimize the antibody dilutions, tissue samples were incubated with the modification buffer without antibody. 4', 6‐diamidino‐2‐phenylindole (DAPI) was used to stain the cell nuclei.
2.6. Overexpression of PADI4 in ECA109 and EC9706 cells
The full PADI4 sequence used for overexpression was approximately 1992 bp, encoding 663 amino acid residues, and it was synthesized and sequenced by Genecreate (Wuhan, China). The full PADI4 sequence was then amplified via PCR using the following specific pair of primers: PADI4‐EcoRI‐Fex (forward) and PADI4‐AscI‐Rex (reverse). The PCR primers designed for this study are also shown in Supplementary Material Table S1. The PCR product was inserted into the pCDNA3.1‐RFP (red fluorescent protein) plasmid vector, which contains a His‐tag, and the recombinant pCDNA3.1‐PADI4‐RFP plasmid was transfected into ECA109 and EC9706 cells using the PolyJet™ DNA in vitro transfection reagent (SignaGen, Rockville,MD). The following details concern the transfection process in six‐well tissue culture plates (the coverage ratio reached 70 ∼ 80%). A total of 6 µL of PolyJet™ transfection reagent was diluted in 50 µL of Roswell Park Memorial Institute (RPMI) 1640 medium without antibiotics or serum and was gently mixed. In a separate preparation, 2 µg of recombinant plasmid were diluted in 50 µL of RPMI 1640 medium without antibiotics or serum and was then gently mixed and incubated at room temperature for 10 min. Two portions of each of the above solutions were gently mixed and incubated for 15 min at room temperature. Each DNA‐lipid mixture was subsequently added to a well with 900 µL of RPMI 1640 complete culture medium (including 10% fetal calf serum, 100 U/mL penicillin and 100 mg/mL streptomycin) and incubated with serum for 16 h. The medium was then replaced with RPMI 1640 complete culture medium (including 10% fetal calf serum, 100 U/mL penicillin and 100 mg/mL streptomycin) and cultured for 48 h at 37°C with 5% CO2. The transfected cells were then harvested for further experiments.
2.7. Inhibition of PADI4 expression with siRNA
A PADI4 siRNA oligonucleotide with the target sequence 5′‐CAGCGTAGTCTTGGGTCCCAA‐3′ was designed and synthesized by Qiagen (Hilden, Germany). The ECA109 and EC9706 esophageal cancer cell lines were cultured separately in six‐well tissue culture plates with 2 mL of RPMI 1640 (Gibco, Auckland, New Zealand) complete culture medium (10% fetal calf serum, 100 U/mL penicillin, and 100 mg/mL streptomycin) at 37°C with 5% CO2 until cell confluency reached 70‐80%. HiPerFect transfection reagent (Qiagen) was used for siRNA transfection at a concentration of 20 nM according to the manufacturer's protocol. Transfected cells were harvested for further experiments after 48 h of transfection.
2.8. Cell proliferation assay
The effect of PADI4 on ECA109 and EC9706 cell proliferation was evaluated using a Cell Counting Kit‐8 (CCK‐8, Dojindo, Kyushu, Japan). The recombinant overexpression plasmid pCDNA3.1‐PADI4‐RFP was transfected into ECA109 and EC9706 cells separately using the PolyJet™ DNA in vitro transfection reagent, and the cells were cultured for 24 h. PADI4‐overexpressing ECA109 and EC9706 cells were separately seeded into 96‐well culture plates (5000/well) for 24 h of culture at 37°C with 5% CO2. The blank pCDNA3.1‐RFP plasmid was used as a non‐specific control. After incubating for 24 h with the DNA‐lipid mixture in complete culture medium, the PADI4‐overexpressing ECA109 and EC9706 cell medium was replaced with complete RPMI 1640 (including 10% fetal calf serum, 100 U/mL penicillin, and 100 mg/mL streptomycin), and culturing was continued for an additional 36 h at 37°C with 5% CO2. Ten microliters of CCK‐8 solution was then added to the cell culture medium in each well, and culturing was continued for another 2 h at 37°C with 5% CO2. Finally, the absorbance was measured at 450 nm with a spectrophotometer (Spectramax 190; Molecular Devices). Growth graphs were generated from the average values of five wells from each group.
2.9. PCR array analysis
ECA109 cells were transfected with a PADI4‐expressing plasmid as described above. Cells transfected with an RFP‐expressing plasmid were used as controls. Total RNA was isolated from PADI4‐overexpressing ECA109 cells with the TRIzol reagent (Invitrogen, Carlsbad, CA). The Cancer PathwayFinder PCR Array (Qiagen) was used to identify the down‐stream pathway of PADI4 in the transfected cells. PCR array analysis was conducted using a ViiA7 DX system (Life Science). This procedure begins with the conversion of experimental RNA samples to single‐stranded cDNA using an RT2 First Strand kit. Next, the cDNA is mixed with an appropriate amount of RT2 SYBR Green master mix. This mixture is then distributed into the wells of the RT2 Profiler PCR array. The raw array data were processed and analyzed using the PCR array data analysis system (http://sabiosciences.com/pcrarraydataanalysis.php). Fold changes were calculated and expressed as log‐normalized ratios of gene expression in pCDNA3.1‐PADI4‐RFP‐transfected cells/expression in pCDNA3.1‐RFP‐transfected cells.
2.10. Establishment of a tumor‐bearing mouse model
The full PADI4 coding sequence was inserted into the pHBLV‐CMV‐MCS‐EF1‐puro lentiviral vector, which includes a CMV promoter and puromycin screening marker (Hanbio Biotechnology, Wuhan, China). A PADI4‐overexpressing cell line was obtained by screening with puromycin. The recombinant PADI3‐overexpressing plasmid with lentiviral packaging was transfected into ECA109 cells. The RFP coding sequence was inserted into the pHBLV‐CMV lentiviral vector, and the RFP‐overexpressing ECA109 cell line was used as a non‐specific control. Fifteen 6‐week‐old BALB/c nude mice (Vitalriver, Beijing, China) were used to establish a tumor‐bearing mouse model. PADI4‐overexpressing ECA109 cells (200 μL at 1 × 10⁷ cells/mL in PBS) transfected with PADI4‐expressing lentivirus were injected into the right dorsal flank of BALB/c nude mice. Meanwhile, as a control, 200 μL of RFP‐overexpressing ECA109 cells (1 × 10⁷ cells/mL in PBS) transfected by lentivirus with RFP expression alone were injected into the left dorsal flank of BALB/c nude mice. Tumor size and weight were measured at 28 days after injection.
2.11. Statistics
Data were analyzed by two‐tailed Student's t‐tests. Differences were considered statistically significant at P < 0.05. To verify the results, each experiment was performed with three samples in triplicate.
3. RESULTS
3.1. Determining PADI4 expression in EC tissues
To explore the expression profile of PADI4 in ESCC tissues, qRT‐PCR, and Western blot analyses were used to detect PADI4 expression in 20 ESCC tissue samples, and their expression levels were compared to those in adjacent tissues. qRT‐PCR revealed a significant increase in the PADI4 mRNA level in ESCC tissues compared with that in adjacent normal tissues (P = 0.0038) (Figure 1A). Western blot analysis also revealed a significant increase in the PADI4 protein level at a molecular weight of 74 kDa in ESCC tissues compared with that in adjacent tissues (P = 0.0094) (Figure 1B).
Figure 1.
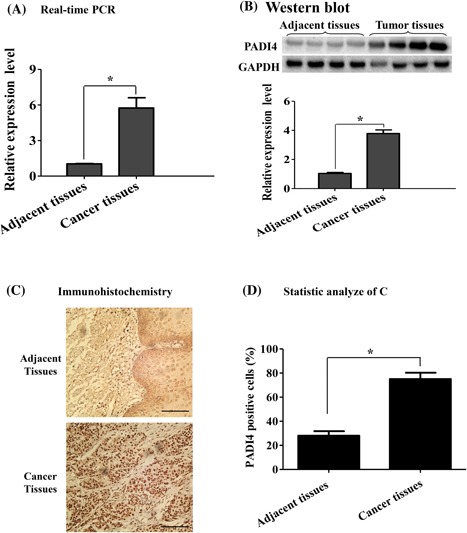
PADI4 expression in esophageal squamous cell carcinoma (ESCC). A, qRT‐PCR was used to detect the PADI4 mRNA expression level in ESCC tissues and adjacent tissues (n = 20). GAPDH was used to normalize PADI4 mRNA expression. B, Western blot analysis was used to detect PADI4 protein expression in ESCC tissues and adjacent tissues (n = 20). The PADI4 expression level was normalized to GAPDH expression. C, Immunohistochemical location of PADI4, Bar, 50 µm. D, The immunostaining of PADI4 was semi‐quantified. * P < 0.05
Immunohistochemistry was used to localize PADI4 expression in the tissue samples. Extensive PADI4 expression with high immunostaining density was mainly limited to tumor cells, and little expression was observed in surrounding normal tissue; however, PADI4 expression was also observed in blood endothelial cells and a few fibroblast‐like cells in non‐tumor regions (Figure 1C). Semi‐quantitative analysis indicated that PADI4 expression was substantially increased in tumor cells compared with that in non‐tumor cells in adjacent non‐tumor regions (P = 0.0084) (Figure 1D).
3.2. Determining the effect of PADI4 expression on tumor growth
To determine the effect of PADI4 on tumor growth under in vivo conditions, tumor‐bearing mice were established by injecting ECA109 cells transfected with PADI4‐expressing lentivirus. PADI4 overexpression in the transfected cells was verified using qRT‐PCR and Western blot analyses. ECA109 cells with overexpressing PADI4 were injected into the right dorsal flanks of mice (n = 15), and cells transfected with RFP alone were injected into the left dorsal flanks. The tumors were dissected, and the tumor weights were measured at 28 days after injection. Tumor weight was significantly increased in the tumors injected with PADI4‐overexpressing ECA109 cells compared with that in the tumors that were established with RFP‐expressing ECA109 cells (P = 0.0124) (Figure 2).
Figure 2.
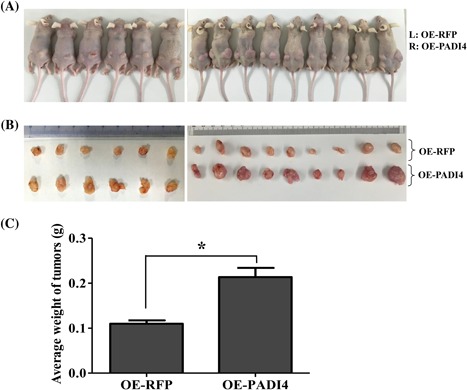
Effect of PADI4 expression on tumor growth in mice (n = 15). A, ECA109 cells transfected with PADI4‐expressing (OE‐PADI4) lentivirus were injected into the right (R) dorsal flanks of BALB/c nude mice. Meanwhile, cultured tumor cells transfected with RFP‐expressing (OE‐RFP) lentivirus were injected into the left dorsal flanks (L) of the same mice as a control. B, Tumors were dissected at 28 days after cell injection. C, Tumor weights were processed and statistically analyzed. * P < 0.05
3.3. Determining the effect of PADI4 expression on EC cell proliferation
To further study the role of PADI4 in ESCC cells, cell proliferation assays were performed using CCK8 assays in ECA109 and EC9706 cells by transfecting the recombinant pCDNA3.1‐RFP‐PADI4 plasmid or pCDNA3.1‐RFP plasmid. Western blotting detected PADI4‐RFP recombinant protein at a molecular weight of 105 kDa (PADI4: 74 kDa, RFP: 25 kDa, His‐tag: 6 kDa) in the cultured cells after transfection with the PADI4‐expressing plasmid. PADI4‐only expression at molecular weight of 74 kDa was detected in the two cell lines after transfection with either pCDNA3.1‐RFP‐PADI4 or pCDNA3.1‐RFP. Compared with cells transfected with an RFP‐only plasmid, both ECA109 and EC9706 cells transfected with a PADI4‐expressing plasmid presented with significantly increased cell proliferation after 24 h (P = 0.0317 for ECA109, P = 0.0291 for EC9706) and 48 h (P = 0.0195 for ECA109, P = 0.0078 for EC9706) of incubation (Figure 3A). ECA109 and EC9706 cells were also transfected with anti‐PADI4 siRNA, and PADI4 expression at molecular weight of 74 kDa was subsequently down‐regulated in these two cell lines. The cell proliferation of ECA109 (P = 0.0144) and EC9706 (P = 0.0276) cells transfected with anti‐PADI4 siRNA was significantly decreased compared with that of cells transfected with Allstars siRNA for 48 h (Figure 3B).
Figure 3.
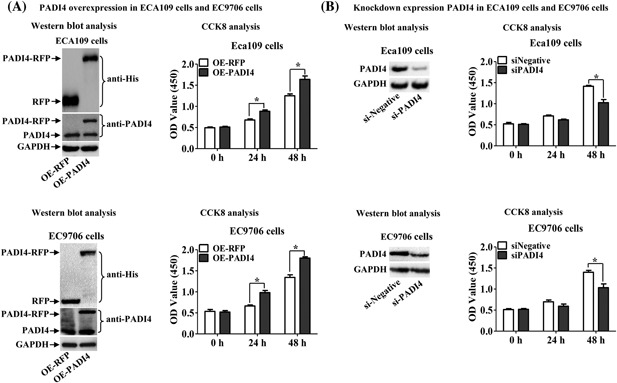
Effect of PADI4 expression on ECA109 and EC9706 cell proliferation using CCK8 analysis. A, Cell proliferation was assessed in the two cell lines with PADI4 overexpression. Western blot analysis detected PADI4‐RFP and PADI4 expression in ECA109 and EC9706 cells transfected with a PADI4‐expressing plasmid (OE‐PADI4) or an RFP alone‐expressing plasmid (OE‐RFP). GAPDH expression was used to normalize PADI4 expression. B, Cell proliferation was assessed in the cells with inhibited PADI4 expression. Western blot analysis detected PADI4 expression in ECA109 and EC9706 cells transfected with anti‐PADI4 siRNA (siPADI4) or Allstars siRNA (siNegative). GAPDH expression was used to normalize PADI4 expression. * P < 0.05
3.4. Determining the tumorigenic mechanism of PADI4
To determine the down‐stream pathway of PADI4 in tumorigenesis, the Human Cancer PathwayFinder PCR array was used to examine changes in tumor‐related gene expression in PADI4‐overexpressing ECA109 cells. According to the manufacturer's instructions and our experience, genes that exhibited at least a three‐fold change in expression level were considered biologically significant. The PCR array analysis showed that ANGPT1, CA9, and TEK levels were significantly increased in PADI4‐overexpressing ECA109 cells compared with those in cells transfected with a plasmid expressing RFP alone (Figure 4).
Figure 4.
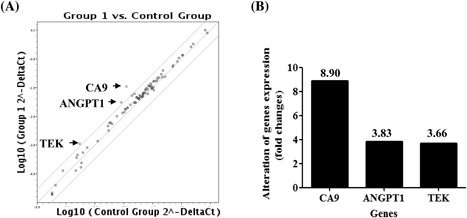
PCR array analysis of cancer‐related gene expression levels in ECA109 cells with PADI4 overexpression. A, The Human Cancer PathwayFinder PCR array revealed at least a three‐fold change in the expression level of tumor‐related genes. B, Genes with a more than a three‐fold change in expression level are depicted in one map. The expression levels of ANGPT1, CA9, and TEK were upregulated in PADI4‐overexpressing ECA109 cells compared with those in cells transfected with an RFP‐alone expressing plasmid (OE‐RFP)
To verify the above PCR array results, the expression of ANGPT1, CA9, and TEK was examined in ECA109 cells with PADI4 overexpression or knocked down expression. qRT‐PCR detected significantly increased levels of ANGPT1 (P = 0.0325), CA9 (P = 0.0219), and TEK (P = 0.0191) in ECA109 cells after transfection with a PADI4‐expressing plasmid, and PADI4 was overexpressed at the transcriptional level compared with its expression in the control (Figure 5A); decreased levels of ANGPT1 (P = 0.0397), CA9 (P = 0.0144), and TEK (P = 0.0293) were detected in the cells transfected with anti‐PADI4 siRNA, and PADI4 transcription was also knocked down (P = 0.0371) compared with that in the controls (Figure 5B). These observations were consistent with the PCR array analysis results. Western blotting was also used to determine the protein expression levels of these three target genes in ECA109 cells transfected with a PADI4‐expressing lentivirus. This analysis revealed significantly increased CA9 expression in PADI4‐overexpressing ECA109 cells (P = 0.0019), whereas the ANGPT1 and TEK protein levels were not significantly changed (Figures 5C and 5D). Both qRT‐PCR and Western blot analysis verified that CA9 expression was significantly increased at the transcriptional and translational level in ECA109 cells with PADI4 overexpression.
Figure 5.
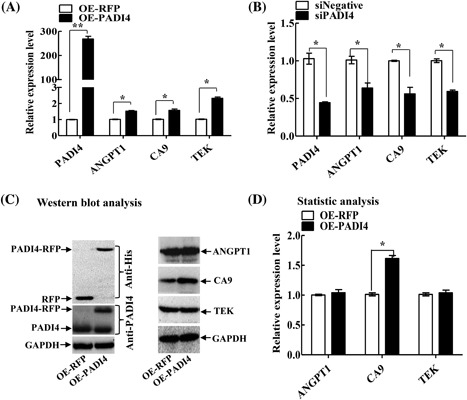
Verification of the PCR array result using qRT‐PCR and Western blot analyses. A, qRT‐PCR revealed the ANGPT1, CA9, and TEK mRNA levels in ECA109 cells with PADI4 overexpression (OE‐PADI4). Cells transfected with RFP alone‐expressing lentivirus (OE‐RFP) were used as controls. B, qRT‐PCR revealed the ANGPT1, CA9, and TEK mRNA levels in ECA109 cells transfected with anti‐PADI4 siRNA (siPADI4). Cells transfected with Allstars siRNA (siNegative) were used as controls. C, Western blot analysis revealed the ANGPT1, CA9, and TEK expression levels in ECA109 cells with PADI4 overexpression or RFP overexpression. D, Statistical analysis of C. * P < 0.05
The expression levels of CA9, ANGPT1, and TEK were also measured in the tissues of tumor‐bearing mice. qRT‐PCR detected up‐regulated ANGPT1 (P = 0.0394), CA9 (P = 0.0097), and TEK (P = 0.0226) expression in the animal tumors established with a PADI4‐expressing pHBLV‐CMV lentivirus compared with that in the tumors established an RFP‐expressing lentivirus (P < 0.0001). However, Western blot analysis detected only up‐regulated CA9 expression in the animal tumor tissues and did not detect significant changes in ANGPT1 and TEK protein expression in the tumor tissues between the two group animals (Figure 6), similar to the results obtained with cultured ECA109 cells.
Figure 6.
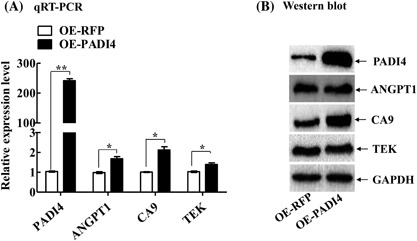
Expression levels of ANGPT1, CA9, and TEK in tumor‐bearing mice. A, qRT‐PCR was used to detect the mRNA levels of the 3 target genes in the animal tumor tissues established with injections of ECA109 cells transfected with PADI4‐expressing lentivirus (OE‐PADI4) or RFP alone‐expressing lentivirus (OE‐RFP). B, Western blotting was used to detect the protein levels of these target genes in the animal tumor tissues. * P < 0.05
Immunohistochemistry was used to verify the effects of PADI4 on the expression of CA9, ANGPT1, and TEK in ESCC tissues. Immunofluorescent staining detected extensive PADI4 expression in tumor regions but not in tumor‐adjacent regions. The assays detected extensive CA9 immunofluorescent staining in the tumor regions but not in tumor‐adjacent regions, and this expression was co‐located with PADI4 staining. Some or low immunofluorescent staining was detected in ESCC tumor tissues and tumor‐adjacent regions of ANGPT1 and TEK, and there were no significant differences between the tumor tissues and the normal tissues (Figure 7).
Figure 7.
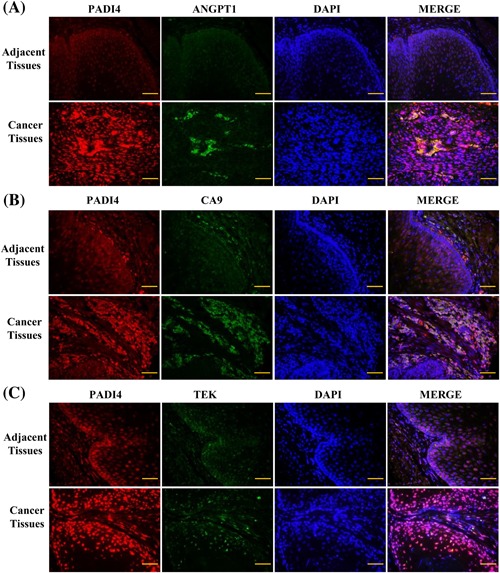
Immunohistochemistry was used to detect the expression of PADI4 (red signals stained with goat anti‐mouse Alexa 568 secondary antibody) and ANGPT1, CA9, and TEK (green signals stained with goat anti‐rabbit Alexa 488 secondary antibody) in esophagus squamous cell carcinoma tissues and adjacent tissues. DAPI was used to stain the cell nuclei. A, The ANGPT1 expression level in cancer tissues and adjacent tissues. B, The CA9 expression level in cancer tissues and adjacent tissues. C, The TEK expression level in cancer tissues and adjacent tissues. Bar, 50 µm
4. DISCUSSION
In the present study, we established a tumor‐bearing mouse model by injecting mice with ECA109 cells transfected with PADI4‐expressing lentivirus. PADI4 overexpression in the transfected cells was identified using qRT‐PCR and Western blot analyses. Tumors were dissected, and their weights were measured at 28 days after the cells were injected. Tumor size and weight were significantly increased in the tumors from PADI4‐overexpressing ECA109 cell injections compared with those of tumors established with cells transfected with blank lentivirus. This observation demonstrates that PADI4 expression stimulates tumor growth in a mouse model under in vivo conditions. We also conducted proliferation assays using CCK8 assays in both ECA109 and EC9706 cells. PADI4 was overexpressed in the two cell lines after transfection with the recombinant pCDNA3.1‐PADI4‐RFP plasmid. After 24 and 48 h of incubation, cell proliferation was significantly increased in both ECA109 and EC9706 cells compared with that in cells transfected with a plasmid expressing RFP alone. ECA109 and EC9706 cells were also transfected with anti‐PADI4 siRNA, and PADI4 expression was down‐regulated in the two cell lines following transfection; cell proliferation was markedly decreased in these ECA109 and EC9706 cells compared with that in cells transfected with Allstars siRNA for 24 h and 48 h. We also detected significantly increased PADI4 expression in ESCC tissues. These observations indicate that PADI4 stimulates cell proliferation. The above results suggest that increased PADI4 expression in ESCC stimulates tumor growth by activating cell proliferation.
The Human Cancer PathwayFinder PCR array was used to identify novel key molecules that regulate the tumorigenic process mediated by PADI4 expression in ECA109 cells. This PCR array profiles the expression of 84 genes that represent the six biological pathways involved in transformation and tumorigenesis. PADI4‐expressing plasmids were transfected into ECA109 cells, and PADI4 was overexpressed following the transfection. The PCR array analysis detected significantly increased CA9 expression, which was verified using qRT‐PCR and Western blot analyses in PADI4‐overexpressing ECA109 cells. Meanwhile, qRT‐PCR and Western blot analyses revealed a marked decrease in CA9 expression in cells transfected with anti‐PADI4 siRNA, as well as the up‐regulation of CA9 in mouse tumors that were established with PADI4‐expressing lentivirus. Furthermore, increased CA9 expression was detected in ESCC tissues, and it co‐located with PADI4 expression. The above results suggest that increased PADI4 expression in ESCC stimulates CA9 expression. Although the ANGPT1 and TEK mRNA levels were constantly increased in the PCR array results, the protein levels of these two genes were not significantly different in the transfected ECA109 cells and animal tumors.
CA9 catalyzes the reversible metabolism of carbon dioxide to carbonic acid, and its protein expression is up‐regulated following exposure to hypoxic conditions. CA9 is a powerful marker used to diagnose various types of metastatic cancers, including cervical, renal, breast and head, and neck tumors. Preclinical studies in cultured cells have clearly demonstrated that CA9 stimulates the metastatic properties of cancer cells.17, 18, 19 CA9 expression is increased in EC tissues and is correlated with poor prognosis and a malignant phenotype in patients with ESCC.19 The current study detected increased CA9 expression in PADI4‐overexpressing ECA109 cells and in PADI4‐overexpressing mouse tumor tissues. McIntyre et al20 reported that CA9 promotes tumor growth in a colon cancer (HT29) and a glioblastoma (U87) cell line; Parks et al21 reported that CA9 knock down dramatically reduced growth in hypoxic conditions. The above findings suggest that increased PADI4 expression in ESCC stimulates malignant transformation by increasing CA9 expression.
In summary, we identified the stimulatory effects of PADI4 on tumor development in an animal model. We found that increased PADI4 expression in ESCC up‐regulates CA9 expression, which is known to promote tumorigenesis and metastatic properties. These important roles of PADI4 that were identified provide a new understanding of the ESCC tumorigenic process.
Supporting information
Additional supporting information may be found online in the Supporting Information section at the end of the article.
Supporting Table S1.
ACKNOWLEDGMENTS
This study was supported by the National Natural Science Foundation of China Basic Research Program of China (No. 81802422, 81702440), the Shandong Provincial Key R & D programs (No. GG201703080038, 2014GSF118135, 2015GGH3180819, and 2017GSF218102), the Natural Science Foundation of Shandong Province (ZR2015HL059), and the Projects of Medical and Health Technology Development Program in Shandong Province (2014WS0360).
Liu C, Tang J, Li C, Pu G, Yang D, Chang X. PADI4 stimulates esophageal squamous cell carcinoma tumor growth and up‐regulates CA9 expression. Molecular Carcinogenesis. 2019;58:66–75. 10.1002/mc.22907
REFERENCES
- 1. Arita K, Hashimoto H, Shimizu T, Nakashima K, Yamada M, Sato M. Structural basis for Ca(2 +)‐induced activation of human PAD4. Nat Struct Mol Biol 2004; 11:777–783. [DOI] [PubMed] [Google Scholar]
- 2. Chavanas S, Méchin MC, Nachat R, et al. Peptidylarginine deiminases and deimination in biology and pathology: relevance to skin homeostasis. J Dermatol Sci. 2006; 44:63–72. [DOI] [PubMed] [Google Scholar]
- 3. Pritzker LB, Nguyen TA, Moscarello MA. The developmental expression and activity of peptidyl arginine deiminase in the mouse. Neurosci Lett. 1999; 266:161–164. [DOI] [PubMed] [Google Scholar]
- 4. Méchin MC, Coudane F, Adoue V, et al. Deimination is regulated at multiple levels including auto‐deimination of peptidyl arginine deiminases. Cell Mol Life Sci. 2010; 67:1491–1503. [DOI] [PMC free article] [PubMed] [Google Scholar]
- 5. Mohanan S, Cherrington BD, Horibata S, McElwee JL, Thompson PR, Coonrod SA. Potential role of peptidyl arginine deiminase enzymes and protein citrullination in cancer pathogenesis. Biochem Res Int. 2012; 2012:895343. [DOI] [PMC free article] [PubMed] [Google Scholar]
- 6. Chang X, Fang K. PADI4 and Tumorigenesis. Cancer Cell International 2010; 10: 7. [DOI] [PMC free article] [PubMed]
- 7. Slack JL, Causey CP, Thompson PR. Protein arginine deiminase 4: a target for an epigenetic cancer therapy. Cell Mol Life Sci. 2011; 68:709–720. [DOI] [PMC free article] [PubMed] [Google Scholar]
- 8. Kolodziej S, Kuvardina ON, Oellerich T, et al. PADI4 acts as a coactivator of Tal1 by counteracting repressive histone arginine methylation. Nat Commun. 2014; 5:3995. [DOI] [PMC free article] [PubMed] [Google Scholar]
- 9. Tanikawa C, Espinosa M, Suzuki A, et al. Regulation of histone modification and chromatin structure by the p53‐PADI4 pathway. Nat Commun. 2012; 3:676. [DOI] [PubMed] [Google Scholar]
- 10. Chang X, Han J. The expression of PAD4 in various tumors. Mol Carcinog. 2006; 45:183–196. [DOI] [PubMed] [Google Scholar]
- 11. Chang X, Han J, Pang L, Zhao Y, Yang Y, Shen Z. PADI4 has increased expression in blood and tissues of malignant tumors. BMC cancer. 2009; 9:40. [DOI] [PMC free article] [PubMed] [Google Scholar]
- 12. Zhai Q, Wang L, Zhao P, Li T. Role of citrullination modification catalyzed by peptidylarginine deiminase 4 in gene transcriptional regulation. Acta Biochim Biophys Sin (Shanghai). 2017; 49:567–572. [DOI] [PubMed] [Google Scholar]
- 13. Cui Y, Yan L, Zhou J, et al. The role of peptidylarginine deiminase 4 in ovarian cancer cell tumorigenesis and invasion.Tumour Biol. Tumour Biol. 2016; 37:5375–5383. [DOI] [PubMed] [Google Scholar]
- 14. Zheng Y, Zhao G, Xu B, et al. PADI4 has genetic susceptibility to gastric carcinoma and upregulates CXCR2, KRT14 and TNF‐α expression levels. Oncotarget. 2016; 7:62159–62176. [DOI] [PMC free article] [PubMed] [Google Scholar]
- 15. Wang Y, Li P, Wang S, et al. Anticancer peptidylarginine deiminase (PAD) inhibitors regulate the autophagy flux and the mammalian target of rapamycin complex 1 activity. J Biol Chem. 2012; 287:25941–25953. [DOI] [PMC free article] [PubMed] [Google Scholar]
- 16. Chang X, Hou X, Pan J, Fang K, Wang L, Han J. Investigating the pathogenic role of PADI4 in oesophageal cancer. Int J Biol Sci. 2011; 7:769–781. [DOI] [PMC free article] [PubMed] [Google Scholar]
- 17. Supuran CT, Winum JY. Carbonic anhydrase IX inhibitors in cancer therapy: an update. Future Med Chem. 2015; 7:1407–1414. [DOI] [PubMed] [Google Scholar]
- 18. McDonald PC, Dedhar S. Carbonic anhydrase IX (CAIX) as a mediator of hypoxia‐induced stress response in cancer cells. Subcell Biochem. 2014; 75:255–269. [DOI] [PubMed] [Google Scholar]
- 19. Jomrich G, Jesch B, Birner P, et al. Stromal expression of carbonic anhydrase IX in esophageal cancer. Clin Transl Oncol. 2014; 16:966–972. [DOI] [PubMed] [Google Scholar]
- 20. McIntyre A, Patiar S, Wigfield S, et al. Carbonic anhydrase IX promotes tumor growth and necrosis in vivo and inhibition enhances anti‐VEGF therapy. Clin Cancer Res. 2012; 18:3100–3111. [DOI] [PMC free article] [PubMed] [Google Scholar]
- 21. Parks SK, Cormerais Y, Durivault J, Pouyssegur J. Genetic disruption of the pHi‐regulating proteins Na+/H+ exchanger 1 (SLC9A1) and carbonic anhydrase 9 severely reduces growth of colon cancer cells. Oncotarget. 2017; 8:10225–10237. [DOI] [PMC free article] [PubMed] [Google Scholar]
Associated Data
This section collects any data citations, data availability statements, or supplementary materials included in this article.
Supplementary Materials
Additional supporting information may be found online in the Supporting Information section at the end of the article.
Supporting Table S1.


