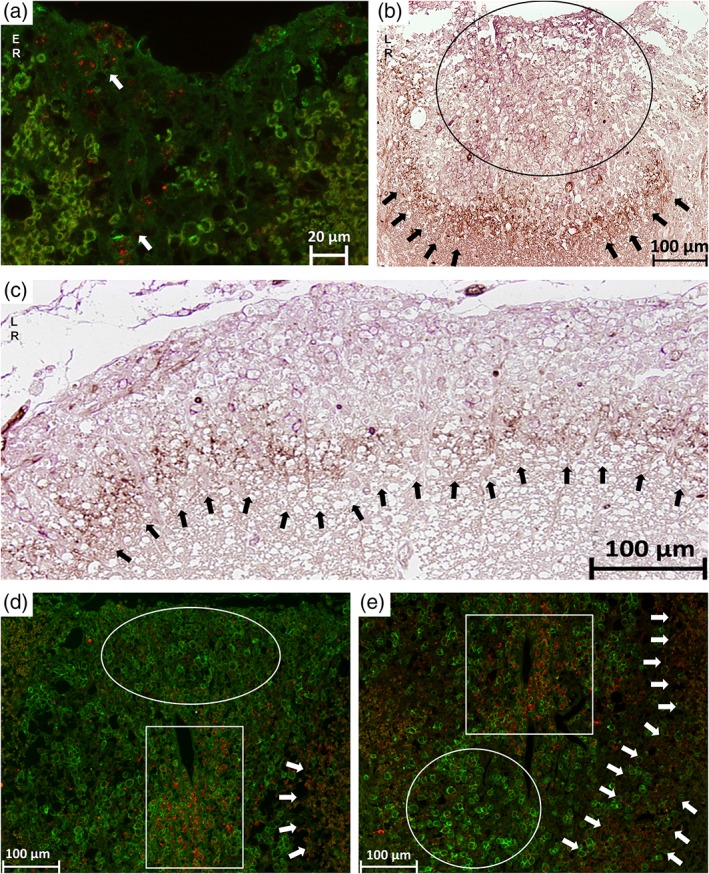
Figure 6.

The switch of astrocytic phenotypes A1 and A2 during lesion evolution. In all IF stainings, the A1 phenotype (C3d) appears in red and the A2 phenotype (S100A10) in green. In all IHC stainings, the A1 phenotype appears in brown and the A2 phenotype in purple. In (a) a early remyelinating lesion is shown on a IF stained slide where the A2 phenotype is mainly present and the A1 phenotype is spread over the lesion in a granular‐like pattern indicated by the arrows. In (b) a IHC of a late remyelinating lesion is marked by the circle where the A2 phenotype (purple) is mainly present. The arrows point at the lesion border where the A1 phenotype (brown) accumulates. This remarkable border is also shown in another late remyelination lesion in (c) indicated by the arrows. In (d) and (e), IF stainings are shown with different lesion types side‐by‐side. The circles show SPs where the A2 phenotype (green) is mainly present. In the rectangles early remyelinating areas are marked with the A1 phenotype (red) spread over in a granular‐like pattern. The arrows show the border of A1 phenotype, which was detectable during later remyelination steps in our sample [Color figure can be viewed at wileyonlinelibrary.com]
