

2D-IR spectroscopy reveals the molecular structures behind important types of oil paint degradation.
Abstract
The molecular structure around metal ions in polymer materials has puzzled researchers for decades. This question has acquired new relevance with the discovery that aged oil paint binders can adopt an ionomer structure when metal ions leached from pigments bind to carboxylate groups on the polymerized oil network. The characteristics of the metal-polymer structure are expected to have important consequences for the rate of oil paint degradation reactions such as metal soap formation and oil hydrolysis. Here, we use two-dimensional infrared (2D-IR) spectroscopy to demonstrate that zinc carboxylates formed in paint films containing zinc white pigment adopt either a coordination chain– or an oxo-type cluster structure. Moreover, it was found that the presence of water governs the relative concentration of these two types of zinc carboxylate coordination. The results pave the way for a molecular approach to paintings conservation and the application of 2D-IR spectroscopy to the study of polymer structure.
INTRODUCTION
Zinc oxide (ZnO) was the white pigment of choice for painters and paint manufacturers from the late 19th century to the middle of the 20th century. However, ZnO is associated with various types of oil paint degradation, sometimes with severe consequences for visual appearance or structural integrity of the paintings. As the triglyceride oil binder polymerizes during paint drying, ZnO tends to release zinc ions, which subsequently bind to pendant carboxylate groups in the heavily cross-linked polymer network (1). This transition of the oil paint binding medium into an ionomer state is usually identified by infrared (IR) spectroscopy; the observation of a broad band centered around 1590 cm−1 assigned to the asymmetric stretch vibration of the carboxylate groups marks the formation of a zinc ionomer. This spectral feature has been observed in numerous artworks, for instance, in paintings by Jackson Pollock (2), Vincent van Gogh (3), and Salvador Dalì (4). Thus, the phenomenon of ionomer formation is of great importance for paintings conservation. It was shown previously that ionomeric zinc carboxylate complexes can represent an intermediate stage in zinc white paint aging that ultimately leads to the appearance of crystalline zinc soaps (5). These complexes of zinc ions and long-chain fatty acids have been linked to cases of brittleness, loss of opacity, the formation of protrusions, and delamination of paint layers (6). Moreover, it was found that the exchange reaction between ionomeric zinc carboxylates and fatty acids that yields zinc soaps is strongly influenced by the amount of water present in the system (5). This result has led to the speculation that water could change the coordination environment around zinc ions in the polymerized oil network to make these ions more reactive toward fatty acids. Despite being directly related to the rate of oil paint degradation, the structure of ionomeric zinc carboxylates in oil paint and its sensitivity to water has so far remained elusive.
There are interesting parallels between these questions regarding molecular structure in aged oil paint and research into other metal-containing polymers. Traditionally, the local structure in ionomers has often been described simply in terms of “cluster” and “multiplet” regions with high ion concentration (7, 8). It has been noted that variations in water content give rise to substantial changes in the carboxylate region of IR spectra recorded on various ionomers (9). Some researchers have used x-ray absorption spectroscopy in an attempt to resolve this water-dependent metal ion coordination environment in commercial zinc-neutralized poly(ethylene-co-methacrylic acid) ionomers (also known as Surlyn, manufactured by DuPont) (10–12) and in isoprene rubber blended with ZnO and stearic acid (13). However, these efforts did not yield a clear assignment of molecular structures because the Zn─O bond lengths and the zinc coordination numbers did not change in tandem with the observed vibrational features of the carboxylate group. Hence, the structure of ionomeric zinc carboxylates is still a highly relevant question for a broad range of polymer systems.
In the present paper, we introduce nonlinear two-dimensional IR (2D-IR) spectroscopy to art restoration research by using it to investigate the molecular structure of aging zinc white oil paint. With this powerful technique, it is possible to probe the dynamic environment of molecules by measuring the vibrational coupling between chemical bonds on a picosecond time scale (14–17). For ionomer systems, 2D-IR spectroscopy can give a far more detailed fingerprint of the spectral region associated with carboxylate vibrations (18) and, using polarized IR light, yield information about the spatial orientation of vibrational modes (19–21). In combination with attenuated total reflection Fourier transform IR (ATR-FTIR) spectroscopy, 2D-IR spectroscopy has allowed us to resolve the zinc carboxylate structures found in zinc white oil paint and commercial ionomer systems. For these studies, we use a model system that is a copolymer of linseed oil (LO) and zinc sorbate (the zinc salt of 2,4-hexadienoic acid) (1). This model system is known to be representative of the binding medium in a typical zinc white oil paint used in many 19th and 20th century paintings (1, 3). Our results give crucial insight into the mechanisms behind the effect of water on oil paint degradation and provide a foundation for fundamental research on potential strategies to tailor environmental conditions and restoration practice to optimize the conservation of paintings.
RESULTS
The effect of water on ATR-FTIR spectra of paint binding media
IR spectra collected on a small sample from a white area of the painting De houthakkers (“The Woodcutters”) by Bart van der Leck (Fig. 1A) show a broad asymmetric carboxylate stretch vibration band typical for a zinc white paint (Fig. 1B). We have shown previously that this broad band is caused by Zn2+-coordinated carboxylate groups of the oil polymer network and that, similar to ionomers, these zinc carboxylates tend to form ionic clusters in the polymer (1). While the asymmetry in the broad carboxylate band indicates that it is composed of several overlapping bands (Fig. 1B), it is not straightforward to isolate its components using conventional spectroscopy. The carboxylate band has a maximum around 1560 cm−1 in this paint sample. However, maxima at frequencies closer to 1600 cm−1 are also commonly reported, for instance, in samples from commercial zinc white paints (22) and a painting by Salvador Dalì (4). These different carboxylate band positions and shapes suggest that there is substantial variation in zinc carboxylate coordination in zinc white paint binding media.
Fig. 1. ATR-FTIR spectra of LO ionomer and liquid ZnPa.
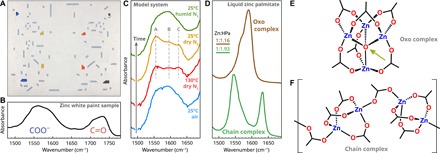
(A) De houthakkers (The Woodcutters) by Bart van der Leck [1928, oil paint on canvas, Gemeentemuseum Den Haag (Wibbina-Stichting)]. (B) The carboxylate and carbonyl regions of an IR spectrum collected on a cross-sectional sample from the painting. (C) The carboxylate region in IR spectra of a zinc white binding medium model ionomer. The broad band under ambient conditions shows three maxima upon drying at 130°C in a dry N2 atmosphere, which persisted as the polymer was cooled back down to room temperature. Only when moisture was reintroduced, the broad band returned to its original band shape. The sample was equilibrated under each environmental condition for 30 min, after which no spectral changes were observed. (D) Asymmetric carboxylate stretch vibration bands of liquid ZnPa. Pure dry ZnPa forms a chain complex upon melting, while an oxo complex is formed in the presence of water or oxygen-containing impurities (see text). (E) Schematic molecular structure of zinc carboxylates of the oxo type (central O2− ion is indicated with an arrow) and (F) the linear coordination chain type. Side chains behind the carboxylate group have been omitted for clarity.
We observed a notable change in the carboxylate region upon reducing the water content in the polymer binding medium. When a LO/zinc sorbate polymer sample (LO/Zn) was heated above 110°C, the components of the broad band envelope changed in relative intensity, revealing at least three separate maxima at 1555, 1595, and 1625 cm−1 (labeled A, B, and C). To confirm that this entirely reversible change was caused by evaporation of water rather than a transition in polymer structure induced by temperature, we measured IR spectra on a LO/Zn sample that was cycled through a heating and humidity program. Figure 1C shows sequential spectra recorded after equilibration under ambient conditions, followed by 130°C under a flow of dry N2, 25°C in dry N2, and, lastly, 25°C under a flow of N2 saturated with water. As long as the atmosphere above the polymer remains dry, the carboxylate band envelope maintains its shape with three distinct maxima. These “dry” spectra could also be reproduced by conditioning LO/Zn in vacuum (~1 mbar) for 3 weeks at room temperature. For paint films composed of ZnO and LO, the IR spectrum showed only minor differences upon drying (fig. S1).
Similar changes in the carboxylate region of IR spectra upon water absorption were observed in zinc-neutralized poly(ethylene-co-methacrylic acid) (pEMAA-Zn) ionomers (10–12). In these reports, the spectra showed only band B at ambient humidity and a combination of bands A and C under completely dry conditions, suggesting that two types of zinc carboxylate structure exist in ionomers. With this hypothesis in mind, we fitted a combination of three Gaussian band shapes to the carboxylate band envelope of dry LO/Zn and investigated whether a simple change in relative concentration of species could explain the spectral change upon water reabsorption (fig. S2). We found that an approximately 50% conversion of bands A and C to band B in combination with a 30% increase in band width could explain the observed spectra.
The positions of the components of the carboxylate band envelope of LO/Zn are notably similar to the band positions of two types of zinc carboxylate coordination structure (Fig. 1D). In a series of insightful studies by Andor, Dreveni, Berkesi et al. (23–25), it was demonstrated that a tetranuclear zinc complex with a central O2− ion (hereafter referred to as “oxo complex,” shown schematically in Fig. 1E) can form in the presence of water when the side chains of the carboxylate ligands are either bulky or disordered. Examples include the crystal structure of zinc 2,2-dimethylpropanoate (26) or the structure of zinc butanoate dissolved in water-containing CCl4 (27). However, under water-free conditions, these zinc salts exist in a linear coordination polymer structure (referred to as “chain complex,” shown in Fig. 1F) (23). We were able to reproduce the spectral features of the chain and oxo complex in liquid zinc palmitate (ZnPa; zinc hexadecanoate). Figure 1D shows the carboxylate region of the IR spectra of pure liquid ZnPa (chain complex) and of ZnPa that contained Zn5(OH)8(Pa)2 as an impurity (oxo complex). The oxo complex features could also be obtained by adding other oxygen-containing impurities such as ZnO or H2O to liquid ZnPa.
Since the carboxylate groups in pEMAA-Zn and LO/Zn ionomers are attached to the polymer chains/network, the polymer backbone to which the carboxylate group is attached will be in a disordered state. Therefore, the conclusions of Andor and colleagues (23) suggest that zinc carboxylates might adopt an oxo or chain structure in aging ZnO oil paint ionomers. To test this hypothesis and elucidate the structure of zinc carboxylates in LO/Zn, we start by studying liquid ZnPa with 2D-IR spectroscopy to obtain a detailed “fingerprint” of zinc carboxylates in the chain structure.
2D-IR spectroscopy of liquid ZnPa
We recorded 2D-IR spectra on dry pure ZnPa in the liquid state by heating a small amount of powdered sample compressed between two CaF2 windows to approximately 150°C. In 2D-IR spectroscopy, the difference in absorption (Δα) between the IR spectra recorded before and after irradiation with a pump pulse is shown as a function of both pump and probe frequencies (20). The negative absorption changes (shown in blue) along the diagonal of the spectrum are caused by bleaching of the vibrational ground state plus the ν = 1 → 0 stimulated emission of each of the pumped vibrational modes. The positive absorption changes (shown in red) are due to ν = 1 → 2 induced absorption, which, due to the anharmonicity of molecular vibrations, occur at a lower frequency. In the 2D-IR spectrum of liquid ZnPa (Fig. 2B), we observe two sets of diagonal peaks that correspond to the two bands in the linear IR spectrum (Fig. 2A). The 2D-IR spectrum also shows two cross peaks with maxima at (1625, 1550) cm−1 and (1550, 1620) cm−1, indicating that the two main carboxylate bands are coupled. The 2D-IR cross peaks are positive-negative doublets, because when two vibrational modes are coupled, exciting one mode effectively changes the frequency of the other (by an amount referred to the cross anharmonicity). In case this frequency change is smaller than the linewidth, the resulting absorption difference spectrum has a line shape similar to the derivative of the absorption band (20). The added value of 2D-IR compared to conventional spectroscopy is that the cross peaks indicate directly that two modes are in very close spatial proximity and so belong to the same molecular species. The magnitude and polarization dependence can even reveal the relative distance and orientation of the coupled vibrating bonds. Specifically, the cross peaks in Fig. 2B demonstrate that the carboxylate groups giving rise to the two bands in the spectrum of Fig. 2A are part of the same coordination environment, supporting the interpretation that liquid ZnPa forms a coordination polymer structure as in Fig. 1D.
Fig. 2. 2D-IR spectroscopy on liquid ZnPa under dry conditions.
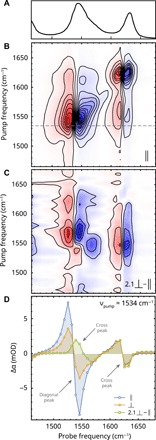
(A) Linear IR spectrum in the carboxylate region of liquid ZnPa in the chain structure. (B) Corresponding 2D-IR spectrum with parallel polarization of pump and probe pulses (delay, 1 ps). Blue and red colors indicate negative and positive values of Δα, respectively, and contour intervals are at 1 mOD. (C) Polarization difference spectrum generated by subtracting the parallel spectrum from the perpendicular after scaling to the maximum of the diagonal signal. (D) Cross section of the 2D spectrum taken at a pump frequency of 1534 cm−1 [dashed line in (B)], showing the diagonal peak at 1545 cm−1 and cross peaks at 1565 and 1630 cm−1.
When we study the 2D-IR spectrum in more detail, it becomes clear that the diagonal peak at ~1545 cm−1 contains two contributions. Figure 2C shows a difference spectrum obtained by subtracting the spectrum recorded with parallel polarization between the pump and probe pulses from the perpendicular spectrum, after scaling the perpendicular spectrum to match the intensities of a spectrally isolated peak. Because cross peaks generally have a different polarization dependence than diagonal peaks, this procedure largely eliminates the diagonal contributions to the spectrum (19, 28). Figure 2D illustrates this effect in a cross section of the 2D spectrum at a pump frequency of 1534 cm−1. The difference spectrum reveals a clear second set of cross peaks at (1565, 1550) cm−1 and (1550, 1565) cm−1, indicating that the low-frequency carboxylate band in liquid ZnPa is composed of two coupled vibrational modes separated by ~20 cm−1. The high intensity of the remaining cross-peak signal upon subtracting the parallel and perpendicular polarized 2D-IR spectra indicates that the angle between the transition dipole moments of the two coupled modes must be significantly different from zero.
We carried out density functional theory (DFT) calculations to support the assignment of IR bands to vibrational modes (Fig. 3). There was excellent agreement between the band shapes of the calculated and experimental IR spectra of the chain complex. In the structure of the chain complex (Fig. 1F), we can distinguish three syn-syn bridging carboxylate groups that form a dinuclear Zn cluster and one syn-anti bridging carboxylate group that links the Zn2(RCOO)3 clusters together. The high-frequency peak at 1625 cm−1 is caused by the in-phase asymmetric stretch vibrations of the Zn2 cluster carboxylate groups. The low-frequency peaks are composed of the out-of-phase modes of the cluster carboxylates and the vibrations of the linking carboxylate group. The theoretical separation between the two sets of bands (~82 cm−1) is of a similar magnitude as the experimental value (85 cm−1). The coupling between the low- and high-frequency peaks can be investigated further by considering the polarization dependence of the cross-peak intensity. In the special case of two coupled modes with a well-defined angle θ between their transition dipole moments, the anisotropy r is related to θ by (20)
| (1) |
Fig. 3. Calculated IR spectra for the oxo complex and chain complex.
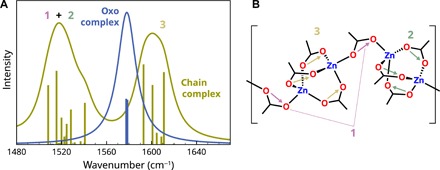
(A) The calculated IR spectrum of the oxo complex shows a single asymmetric COO stretch vibration band around 1580 cm−1, in line with the experimental spectrum shown in Fig. 1D. Calculations showed that the shoulder in the experimental spectrum could be caused by loosely associated water molecule residing between two carboxylate groups. The calculated spectrum of the chain complex shows two sets of asymmetric COO stretch bands. The nondegeneracy of the three high-frequency modes [identified as in-phase Zn2(RCOO)3 cluster modes] is due to the fact that the calculations were necessarily performed on a terminated nonpolymeric model complex rather than a full coordination polymer structure. (B) Schematic structure of the chain complex with numbers and arrows indicating the vibrations corresponding to the bands in the calculated IR spectrum.
Using this relation, we obtain an angle between the transition dipole moments giving rise to the cross peak at (1625, 1550) cm−1 of approximately 60°. In the DFT-optimized structure of the chain complex (Fig. 3), the transition dipole moments of the in-phase and out-of-phase vibrations of the cluster carboxylate groups are parallel to each other, while the linking carboxylate groups are either nearly parallel or perpendicular with adjacent cluster carboxylate groups. Since the low-frequency peak is due to more than one mode (the out-of-phase mode of the cluster carboxylates and the vibrations of the linking carboxylate groups), it is not straightforward to relate the observed anisotropy to a specific angle in the structure. Rather, the experimental value of θ will be a weighted average of several angles. However, the fact that θ is nonzero does imply that the cross peak between the high- and low-frequency peaks is due to a large extent to coupling of the in-phase modes of the Zn2(RCOO)3 clusters and the perpendicular linking COO groups, as the in-phase and out-of-phase modes of the cluster have parallel transition dipole moments. More extensive calculations using periodic DFT that could give a more precise interpretation of the cross peaks are beyond the scope of this paper. With the acquired insight between IR spectral features and the structure of the chain complex, we can proceed to study the structure of zinc carboxylates in LO ionomers.
2D-IR spectroscopy of LO ionomer
The linear IR spectrum of LO/Zn under ambient humidity conditions (~50 % relative humidity) in shown in Fig. 4A. The 2D-IR spectrum of LO/Zn under these conditions is dominated by a very broad diagonal feature, as shown in Fig. 4B. With perpendicularly polarized pump and probe pulses, a cross peak is visible between the parts of the broad band at ~1540 and 1600 cm−1. This broad cross peak becomes more visible in the polarization difference spectrum, shown in Fig. 4C. We found a similar 2D-IR spectrum for a pigmented paint film consisting of a mixture of LO and ZnO pigment particles cured overnight at 60°C. Because of extensive band broadening and overlap, resolving the zinc carboxylate structure under these ambient conditions remains challenging.
Fig. 4. 2D-IR spectroscopy on LO/Zn under wet and dry conditions.
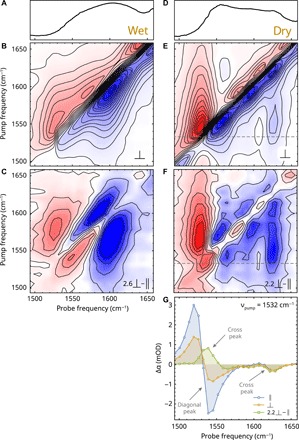
(A) Linear IR spectrum of LO/Zn ionomer soaked in water. (B) 2D-IR spectrum of wet LO/Zn with perpendicular polarization of pump and probe pulses (delay, 1 ps; contour intervals are at 0.17 mOD). (C) Polarization difference spectrum of wet LO/Zn showing broad cross peaks. (D) Linear IR spectrum of LO/Zn dried by heating to 150°C for 30 min. (E) Perpendicular 2D-IR spectrum of dry LO/Zn (delay, 1.5 ps; contour intervals are at 0.16 mOD). (F) Polarization difference spectrum of dry LO/Zn. (G) Cross section of the 2D spectrum shown in (E) and (F) at a pump frequency of 1532 cm−1, showing a coupling pattern that is highly similar to Fig. 2D.
Unexpectedly, upon drying LO/Zn (by heating a sample at 150°C for 30 min before sealing into a cell between CaF2 windows), its 2D-IR spectrum changes markedly (Fig. 4E). Along the diagonal, three maxima can be distinguished at positions that match bands A, B, and C in the linear 2D spectrum (Fig. 4D). With the decreased intensity and width of band B, cross peaks become visible between the outermost diagonal peaks.
By looking at the polarization difference spectrum and a cross section of the spectrum at 1532 cm−1 (Fig. 4, F and G), a detailed comparison can be made between dry LO/Zn and molten ZnPa. Just as in liquid ZnPa, the low-frequency band A is composed of two modes that are strongly coupled, giving rise to an additional cross peak at νprobe = 1565 cm−1. Moreover, the intensity of the cross peak at νprobe = 1625 cm−1 shows a similar polarization dependence as the cross peak on the same position in Fig. 2B. The diagonal peaks A and C in LO/Zn show more inhomogeneous line broadening (i.e., broadening along the diagonal) than in ZnPa (Fig. 4E). This observation indicates that there is more heterogeneity in the environment of the carboxylate groups in the LO polymer than in liquid ZnPa. Nevertheless, judged by the anisotropy of the cross peaks, the angles between the Zn2(RCOO)3 clusters and the linking COO groups seem to be very similar in liquid ZnPa and in the polymer, despite the differences in temperature and surrounding matrix.
The combination of the correspondence of the position of three peaks, their cross peaks, and their polarization dependence allows us to conclude with confidence that a large fraction of the ionomeric zinc carboxylates in dry LO/Zn have the structure of a chain complex (Fig. 1F). The central peak at 1595 cm−1 showed no significant coupling with either of the other carboxylate vibrational modes. Therefore, it can be concluded that the zinc carboxylate species corresponding to band B is separate from the chain complex. However, 2D-IR spectroscopy does not yet allow us to assign band B. To do so, we carried out a more detailed analysis of the ATR-FTIR spectra of LO/Zn.
The identification of the oxo complex in LO ionomer
To study the nature of band B in IR spectra of LO/Zn, we consider first the central oxygen ion in the oxo complex. Isotope studies have shown that the O2− ion can be easily derived from water molecules (29), making it plausible that water exposure can induce a (partial) structural transition from chain to oxo complex in ionomers. The tetrahedrally coordinated oxygen has a specific asymmetric Zn4O vibration at ~530 cm−1. The IR spectra of pEMAA-Zn under wet conditions reported by Ishioka et al. (10) also contain this Zn4O band, although a band assignment was not made. A linear correlation was found between the intensities of the band at 530 cm−1 and the carboxylate vibration at 1585 cm−1. In addition, the conversion from carboxylate band B to bands A and C was only observed in partially neutralized ionomers, i.e., ionomers that still contained protonated COOH groups. This important observation is in complete agreement with a decrease in the Zn/COO ratio (from 2:3 to 1:2) during the reversible transition from an oxo to a chain complex, according to the reaction shown in (2)
| (2) |
Therefore, it can be concluded that ionomeric zinc carboxylates have an oxo structure in pEMAA-Zn in the presence of water.
We found that liquid ZnPa exists in the oxo form when an oxygen source was present in the liquid (e.g., water or ZnO impurities; Fig. 1D). The IR spectrum of ZnPa under these conditions also showed the Zn4O band at 530 cm−1, although it was broader and weaker than reported for oxo complexes of short-chain zinc carboxylates, both pure and in solution (23, 27).
Unexpectedly, in polymerized LO/Zn films under either wet or dry conditions, the Zn4O band could not be detected, despite the presence of a strong carboxylate band B. However, when we followed the entire curing process of LO/Zn with ATR-FTIR spectroscopy by heating a layer of ~5 μm thickness on the ATR crystal, it was found that a weak band at 530 cm−1 does exist in the early stages of curing (fig. S3). While the band increased in parallel with band B at 1590 cm−1 on short time scales (Fig. 5, A and B), after approximately 150 to 200 min, the Zn4O band became obscured by background noise. This reduction in band intensity correlated with the disappearance of the C═CH stretch vibration at 3009 cm−1 that is a measure for the degree of oxidation and polymerization in the system (Fig. 5A). In contrast, band B at 1590 cm−1 remained approximately constant after 200 min. A similar broadening and weakening of the Zn4O band in cast films of oxo complexes observed by Berkesi and co-workers (25) was attributed to a gradual lowering of the symmetry of the tetrahedral Zn4O core of the oxo complex. This interpretation is in agreement with the disorder indicated by the inhomogeneous line broadening in the 2D-IR spectrum of LO/Zn in Fig. 3E.
Fig. 5. ATR-FTIR spectra supporting the assignment of band B to an oxo structure.
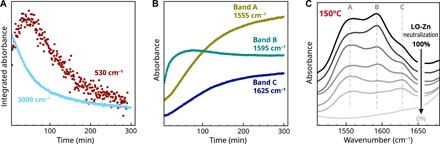
(A) Time profiles of integrated IR bands during curing of LO/Zn at 190°C on the ATR crystal. The disappearance of the C═CH stretch vibration band at 3009 cm−1 is a measure for the extent of polymerization, while the reduction of the band at 530 cm−1 is attributed to a loss of symmetry in the central Zn4O unit (see also fig. S3). (B) Time profiles of absorbance at the frequencies corresponding to the components A, B, and C of the broad carboxylate band envelope during curing. (C) IR spectra under dry conditions (150°C) of LO/Zn with decreasing neutralization, demonstrating the correlation between the concentration of COOH groups and the relative concentration of chain and oxo complex.
We used x-ray absorption near-edge structure (XANES) spectroscopy in an attempt to characterize the coordination environment around Zn2+ in LO/Zn films equilibrated in liquid water or under vacuum (fig. S4). While the differences between the wet and dry XANES spectra were minor, comparison with calculated spectra showed that the changes were consistent with a partial transition from an oxo complex to a chain structure upon drying.
Last, we observed a significant stoichiometric effect of the COOH concentration on the degree of conversion between the two zinc carboxylate species in LO/Zn (Fig. 5C). A series of samples with decreasing COOH neutralization (prepared by partially replacing zinc sorbate by sorbic acid before polymerization) showed an increasing conversion of band B to bands A and C upon drying. This effect demonstrates that the zinc carboxylate species corresponding to band B must have a higher Zn/COO ratio than the chain complex that is responsible for band A + C. Note that even LO/Zn with no added sorbic acid contains non-neutralized COOH groups because carboxylic acid groups are formed during the autoxidative curing of LO (30).In addition, because of the very high degree of cross-linking in LO polymer networks, it is likely that not all COOH groups are accessible for reaction during changes in water concentration in the polymer, causing an incomplete conversion between species.
On the basis of this variety of spectroscopic evidence, we conclude that LO-based ionomers such as LO/Zn contain a significant fraction of zinc carboxylates with the structure of an oxo complex. The rigid polymer network backbone is prone to induce some disorder, which causes the characteristic Zn4O band to be either weak or absent.
DISCUSSION
The great similarities in material composition and IR spectral features between our LO/Zn model system and ZnO-containing paint support the conclusion that the polymerized binding medium in historical zinc white oil paint also contains both chain- and oxo-type ionomeric zinc carboxylates. In aged LO films pigmented with ZnO, the wet-dry transition in the carboxylate region of IR spectra is more subtle than in LO/Zn. This effect arises because there tends to be a much lower concentration of unbound COOH groups to facilitate the transition from oxo to chain complex due to the presence of an excess of Zn2+ ions in pigmented films. With respect to the study of structure and reactivity in complex systems such as oil paint, our findings highlight the necessity of using model systems in which concentrations of functional groups and paint components can be controlled while retaining a representative molecular structure. Our results also demonstrate how 2D-IR spectroscopy can be used to unravel the complicated IR spectra of art historical samples. In particular, 2D-IR cross peaks can make it much easier to attribute bands to specific molecular species, and they can provide additional structural information. In the future, we hope to combine nonlinear IR spectroscopy with microscopic imaging for art research (31), as has already been performed successfully in the visible wavelength region (32).
Our investigations should have important implications for the conservation of oil paintings. We now know the exact coordination environment around zinc ions in oil paint binding media. The relative concentration of chain and oxo structures will depend on the local concentration of carboxylic acid groups, as well as the humidity in the environment of a painting. The differences in the shape of the broad zinc carboxylate band envelope in IR spectra of samples from paintings directly reflect the differences in the relative concentrations of the oxo and chain structures. An initial survey of IR spectra of various zinc ionomers and zinc white paint films indicated that there is significant variation in the relative intensity of the bands A and C that correspond to chain-type zinc carboxylates. In the sample from De houthakkers by Bart van der Leck, for instance, band A dominates the broad carboxylate band envelope, while band C is very weak (Fig. 1B). DFT calculations showed that this effect may be caused by distortions of the ideal chain complex structure (fig. S5). Increasing the angle between consecutive Zn2(COO)3 clusters leads to an extension of the coordination chain. As a result, the degree of coupling between the vibrational modes of the linking carboxylate groups and the Zn2(COO)3 clusters is greatly enhanced. In the extended chain complex, the IR spectrum is largely dominated by a band near the position of band A that can be attributed to the in-phase vibration of all carboxylate groups. On the basis of these calculations, we hypothesize that the polymer backbones of the zinc carboxylate complexes present in oil paint binding media can induce distortion of the ideal chain complex structure, leading to a (partial) extension of the chain complex, which in turn causes a higher intensity of band A with respect to band C. Hence, the exact shape of the broad zinc carboxylate band envelope in IR spectra of zinc white oil paint could be correlated to polymer properties such as the cross-link density or polymer chain flexibility.
With the newly acquired structural knowledge and the capability to prepare both the chain and oxo complexes in isolation, it has become possible to investigate the differences in reactivity of the two zinc carboxylate complexes toward the formation of zinc soaps (5). In addition, ionomers are known to be electrically conductive through an ion hopping mechanism (33), a process which is probably responsible for the migration of metal ions from pigment particles into the polymerized oil network. To forecast changes in the mechanical properties of oil paint films or the rate of zinc soap formation, it will be interesting to link the structure of ionomeric zinc carboxylates to metal ion diffusion. Last, because tetranuclear zinc acetate oxo complexes have been reported to catalyze transesterification and the conversion of a wide range of carboxylic acids and esters into oxazolines (34), it should be investigated whether the zinc carboxylate complexes in ionomers play a catalytic role in the degradation of the polymerized binding medium itself.
To conclude, our experiments demonstrate that 2D-IR spectroscopy can be a valuable new tool in investigating paint degradation at the molecular level. With our results, the structure of zinc carboxylates can be easily elucidated in a wide variety of ionomer systems. In the field of oil paintings conservation, this research brings us to a point where we can start to draw direct molecular links between the composition and environment of a painting and the rate of paint degradation.
MATERIALS AND METHODS
Materials
The zinc white binding medium model system LO/Zn was prepared by grinding 250 mg zinc sorbate (ZnSo) together with cold-pressed untreated 1750 mg of LO (Kremer Pigmente) with mortar and pestle. ZnSo was synthesized as described previously (5). A portion of the resulting paste was spread onto glass slides with a drawdown bar to a wet thickness of 90 μm (or 15 μm for transmission measurements) and cured overnight in an air-circulated oven at 150°C. A series of LO/Zn ionomers with decreasing neutralization were prepared in a similar fashion using mixtures of zinc sorbate and sorbic acid in LO to achieve neutralization levels of 0, 17, 33, 50, 67, 83, and 100% (excluding the COOH groups formed as a result of LO oxidation), while the total sorbate/sorbic acid concentration was kept constant.
ZnPa was synthesized by adding a solution of either 180 or 300 mg Zn(NO3)2·6H2O in 2 ml of demineralized water to a solution of 300 mg of palmitic acid (HPa) and 0.25 ml of triethylamine in 10 ml of demineralized water at 85°C, corresponding to a Zn/HPa ratio in the mixture of 1:1.93 and 1:1.16, respectively. After stirring for 10 min, the precipitated white product was washed with a sequence of demineralized water, ethanol, and acetone on a Büchner funnel. While no impurities were detected with ATR-FTIR spectroscopy and powder x-ray diffraction in ZnPa prepared with 180 mg zinc nitrate, the excess of Zn2+ ions in the alkaline reaction mixture with 300 mg zinc nitrate resulted in the coprecipitation of an additional crystalline phase identified as Zn5(OH)8(Pa)2 with powder x-ray diffraction (fig. S6) (35).
2D-IR spectroscopy
2D-IR spectra were measured with a pump-probe femtosecond laser setup described in detail elsewhere (36). Briefly, an optical parametric amplifier was pumped by ~50 fs pulses (800 nm, 3 mJ, 1 kHz) to obtain an approximately Gaussian spectrum centered at ~1595 cm−1 [16 μJ, <100 fs, 150 cm−1 full width at half maximum (FWHM)]. This beam was split into pump, probe, and reference beams by a wedged CaF2 window. The central frequency of the narrow-band pump beam was adjusted with Fabry-Pérot interferometer (FPI; pulse width, ~22 cm−1 FWHM; pulse duration, ~1.2 ps FWHM). The sample was pumped with the resulting ~1 μJ of energy. A λ/2 plate was used to rotate the pump beam 45° with respect to the probe beam. The focal diameter at the pump and probe overlap on the sample was approximately 200 μm. IR signals were detected with an Oriel MS260i spectrograph onto a 32-pixel HgCdTe array at 8 cm−1 spectral resolution, using a 90° rotation of a polarizer placed directly after the sample to collect parallel and perpendicular polarization signals. By comparing the transmitted probe spectrum in the presence and absence of the pump pulse, the pump-induced transient absorption change (Δα) was measured. By scanning the pump frequency with the FPI and measuring transient absorption spectra for each pump frequency, 2D vibrational spectra could be constructed. To determine the zero delay between the pump and probe beams, a cross correlation was measured using the two-photon absorption of InAs. Spectra were downshifted 15 cm−1 to correct for the offset of the spectrograph. The estimated temperature increase in the focal volume as a result of pump energy absorption is of the order of ~1.1 K.
ATR-FTIR spectroscopy
ATR-FTIR spectra were measured on a PerkinElmer Frontier FTIR spectrometer fitted with a PIKE diamond GladiATR module equipped with a top-plate heatable to 200°C. Spectra of polymer samples under different environmental conditions were collected by placing a metal cylinder around the sample between the top plate and the pressure clamp of the ATR module [this setup is described in more detail elsewhere (5)]. The resulting compartment could be flushed with either dry N2 or with water-saturated gas by bubbling N2 through a water reservoir. The curing process of LO/Zn was followed by spreading a very thin layer (<5 μm) of a paste of LO and ZnSo with a drawdown bar on the ATR diamond and collecting spectra every 1 min while heating at 190°C in air. These spectra were baseline-corrected and normalized to the CH2 band at 2925 cm−1. The bands at 530 and 3009 cm−1 were sufficiently isolated to be integrated by summation over the width of the bands. Because of extensive band overlap, the time profiles of bands A, B, and C contributing to the broad asymmetric COO stretch vibration band envelope were approximated by taking the absorbance values at 1555, 1595, and 1625 cm−1, respectively.
Calculation of IR spectra
The geometries of molecular complexes were optimized using the QUILD optimization routines (37) in the ADF 2017 software suite (38) at a BP86/TZP level of theory. To converge the geometry, a strict self-consistent field convergence of 10−8 was used in combination with a good numerical quality and the use of the exact density for the exchange-correlation potential (instead of using the default fitted density). As convergence criterium, a gradient convergence of 3 × 10⁻⁴ was used. Subsequently, the IR frequencies and intensities were computed using the same level of theory. For calculations on large chain complexes (10 zinc ions), the option “frozen core” was used. The IR bands were plotted using a Lorentzian function with a FWHM of 20 cm−1.
For the oxo complex, the atomic coordinates were used from the crystal structure of basic zinc pivalate (2,2-dimethylpropanoate) (26), after which the tert-butyl groups were replaced by CH2CH2CH3 to create butanoate ligands. As the chain complex is polymeric, it was necessary to create a finite chain structure as input for calculations. We took the atomic coordinates of the crystal structure of zinc crotonate (but-2-enoate) as a basis (39), added hydrogens to create butanoate ligands, and limited the structure to 10 zinc ions by capping one end with a methoxy group (CH3O−) and the other with an ammonia molecule to obtain a noncharged complex. Hence, the final structure can be written as CH3O((Zn2(Bu)3)Bu)4(Zn2(Bu)3)NH3, where Bu is butanoate.
Supplementary Material
Acknowledgments
We express gratitude to B. Strudwick for help with the 2D-IR spectroscopy setup, D. Martin for performing XANES calculations, S. Hageraats and S. Reguer for assistance with the XANES measurements, and R. Hoppe for making the sample of the painting by Bart van der Leck available to us. Funding: This research was supported by the Bennink Foundation/Rijksmuseum Fonds, the NANORESTART project funded by the European Union’s Horizon 2020 research and innovation program under agreement no. 646063, and the Netherlands Organization for Scientific Research (NWO) under project number 016.Veni.192.052. Author contributions: J.J.H., L.B., and S.W. designed experiments and interpreted data. J.J.H. and L.B. prepared samples. J.J.H. carried out ATR-FTIR and 2D-IR measurements. M.K. carried out DFT calculations. J.J.H. wrote the manuscript. L.B., K.K., P.D.I., and S.W. edited the manuscript. K.K., P.D.I., and S.W. supervised the project. Competing interests: The authors declare that they have no competing interests. Data and materials availability: All data needed to evaluate the conclusions in the paper are present in the paper and/or the Supplementary Materials. Additional data related to this paper may be requested from the authors.
SUPPLEMENTARY MATERIALS
Supplementary material for this article is available at http://advances.sciencemag.org/cgi/content/full/5/6/eaaw3592/DC1
Supplementary Materials and Methods
Fig. S1. The change in the carboxylate band envelope in a ZnO-LO mixture.
Fig. S2. Quantification of the change in the carboxylate band envelope upon drying.
Fig. S3. The evolution of the Zn4O band at 530 cm−1 during curing of LO/Zn.
Fig. S4. Calculated and experimental XANES spectra of LO/Zn.
Fig. S5. Calculated IR spectra of a distorted chain complex.
Fig. S6. Powder XRD traces of two types of ZnPa samples.
Reference (40)
REFERENCES AND NOTES
- 1.Hermans J. J., Keune K., van Loon A., Corkery R. W., Iedema P. D., Ionomer-like structure in mature oil paint binding media. RSC Adv. 6, 93363–93369 (2016). [Google Scholar]
- 2.Gabrieli F., Rosi F., Vichi A., Cartechini L., Pensabene Buemi L., Kazarian S. G., Miliani C., Revealing the nature and distribution of metal carboxylates in Jackson Pollock’s Alchemy (1947) by micro-attenuated total reflection FT-IR spectroscopic imaging. Anal. Chem. 89, 1283–1289 (2017). [DOI] [PubMed] [Google Scholar]
- 3.Hermans J. J., Keune K., van Loon A., Iedema P. D., An infrared spectroscopic study of the nature of zinc carboxylates in oil paintings. J. Anal. At. Spectrom. 30, 1600–1608 (2015). [Google Scholar]
- 4.K. Keune, G. Boevé-Jones, It’s surreal: Zinc-oxide degradation and misperceptions in Salvador Dalí’s couple with clouds in their heads, 1936, in Issues in Contemporary Oil Paint, K. J. van den Berg, Ed. (Springer International Publishing, 2014), pp. 283–294.
- 5.Baij L., Hermans J. J., Keune K., Iedema P., Time-dependent ATR-FTIR spectroscopic studies on fatty acid diffusion and the formation of metal soaps in oil paint model systems. Angew. Chem., Int. Ed. 57, 7351–7354 (2018). [DOI] [PMC free article] [PubMed] [Google Scholar]
- 6.F. Casadio, K. Keune, P. Noble, A. van Loon, E. Hendriks, S. Centeno, G. Osmond, Metal Soaps in Art: Conservation and Research (Springer International Publishing, 2018).
- 7.Eisenberg A., Hird B., Moore R. B., A new multiplet-cluster model for the morphology of random ionomers. Macromolecules 23, 4098–4107 (1990). [Google Scholar]
- 8.Wouters M. E. L., Litvinov V. M., Binsbergen F. L., Goossens J. G. P., van Duin M., Dikland H. G., Morphology of ethylene-propylene copolymer based ionomers as studied by solid state NMR and small angle x-ray scattering in relation to some mechanical properties. Macromolecules 36, 1147–1156 (2003). [Google Scholar]
- 9.Brozoski B. A., Painter P. C., Coleman M. M., Concerning the origin of broad bands observed in the FT-IR spectra of ionomers. Cluster formation or water adsorption? Macromolecules 17, 1591–1594 (1984). [Google Scholar]
- 10.Ishioka T., Shimizu M., Watanabe I., Kawauchi S., Harada M., Infrared and XAFS study on internal structural change of ion aggregate in a zinc salt of poly(ethylene-co-methacrylic acid) ionomer on water absorption. Macromolecules 33, 2722–2727 (2000). [Google Scholar]
- 11.Welty A., Ooi S., Grady B. P., Effect of water on internal aggregate structure in zinc-neutralized ionomers. Macromolecules 32, 2989–2995 (1999). [Google Scholar]
- 12.Hashimoto H., Kutsumizu S., Tsunashima K., Yano S., X-ray absorption spectroscopic studies on pressure-induced coordination-structural change of a zinc-neutralized ethylene-methacrylic acid ionomer. Macromolecules 34, 1515–1517 (2001). [Google Scholar]
- 13.Ikeda Y., Yasuda Y., Ohashi T., Yokohama H., Minoda S., Kobayashi H., Honma T., Dinuclear bridging bidentate zinc/stearate complex in sulfur cross-linking of rubber. Macromolecules 48, 462–475 (2015). [Google Scholar]
- 14.Jonas D. M., Optical analogs of 2D NMR. Science 300, 1515–1517 (2003). [DOI] [PubMed] [Google Scholar]
- 15.Khalil M., Demirdöven N., Tokmakoff A., Coherent 2D IR spectroscopy: Molecular structure and dynamics in solution. J. Phys. Chem. A 107, 5258–5279 (2003). [Google Scholar]
- 16.Cho M., Coherent two-dimensional optical spectroscopy. Chem. Rev. 108, 1331–1418 (2008). [DOI] [PubMed] [Google Scholar]
- 17.van Wilderen L. J. G. W., Bredenbeck J., From ultrafast structure determination to steering reactions: Mixed IR/non-IR multidimensional vibrational spectroscopies. Angew. Chem., Int. Ed. 54, 11624–11640 (2015). [DOI] [PubMed] [Google Scholar]
- 18.Huerta-Viga A., Amirjalayer S., Domingos S. R., Meuzelaar H., Rupenyan A., Woutersen S., The structure of salt bridges between Arg+ and Glu− in peptides investigated with 2D-IR spectroscopy: Evidence for two distinct hydrogen-bond geometries. J. Chem. Phys. 142, 212444 (2015). [DOI] [PubMed] [Google Scholar]
- 19.Woutersen S., Hamm P., Structure determination of trialanine in water using polarization sensitive two-dimensional vibrational spectroscopy. J. Phys. Chem. B 104, 11316–11320 (2000). [Google Scholar]
- 20.P. Hamm, M. Zanni, Concepts and Methods of 2D Infrared Spectroscopy (Cambridge Univ. Press, 2011).
- 21.Krummel A. T., Mukherjee P., Zanni M. T., Inter and intrastrand vibrational coupling in DNA studied with heterodyned 2D-IR spectroscopy. J. Phys. Chem. B 107, 9165–9169 (2003). [Google Scholar]
- 22.Osmond G., Boon J. J., Puskar L., Drennan J., Metal stearate disributions in modern artists’ oil paints: Surface and cross-sectional investigation of reference paint films using conventional and synchrotron infrared microspectroscopy. Appl. Spectrosc. 66, 1136–1144 (2012). [DOI] [PubMed] [Google Scholar]
- 23.Andor J. A., Berkesi O., Dreveni I., Varga E., Physical and chemical modification of zinc carboxylate-containing lubricants by molecular structure changes. Lubr. Sci. 11, 115–134 (1999). [Google Scholar]
- 24.Dreveni I., Berkesi O., Andor J. A., Mink J., Influence of the spatial structure of the alkyl chain on the composition of the product of the direct neutralization reaction between aliphatic carboxylic acids and zinc hydroxide. Inorg. Chim. Acta 249, 17–23 (1996). [Google Scholar]
- 25.Berkesi O., Berenji P., Dreveni I., Körtvélyesi T., Andor J. A., Mink J., Goggin P. L., Influence of the alkyl-chain on the symmetry and structural changes of Zn4O(RCO2)6 complexes in film phase—An FT-IR study. Vib. Spectrosc. 43, 227–236 (2007). [Google Scholar]
- 26.Clegg W., Harbron D. R., Homan C. D., Hunt P. A., Little I. R., Straughan B. P., Crystal structures of three basic zinc carboxylates together with infrared and FAB mass spectrometry studies in solution. Inorg. Chim. Acta 186, 51–60 (1991). [Google Scholar]
- 27.Berkesi O., Dreveni I., Andor J. A., Goggin P. L., Formation and mid-FT-IR investigation of short (C2–C5) straight chain tetrazinc μ4-oxo-hexa-μ-carboxylates. Inorg. Chim. Acta 181, 285–289 (1991). [Google Scholar]
- 28.Zanni M. T., Ge N.-H., Kim Y. S., Hochstrasser R. M., Two-dimensional IR spectroscopy can be designed to eliminate the diagonal peaks and expose only the crosspeaks needed for structure determination. Proc. Natl. Acad. Sci. U.S.A. 98, 11265–11270 (2001). [DOI] [PMC free article] [PubMed] [Google Scholar]
- 29.Berkesi O., Andor J. A., Jayasooriya U. A., Cannon R. D., Vibrations of central oxygen in a high-symmetry tetranuclear metal cluster: A definitive assignment using isotopic substitution in a basic zinc carboxylate complex. Spectrochim. Acta, Part A 48, 147–149 (1992). [Google Scholar]
- 30.Mallégol J., Gardette J.-L., Lemaire J., Long-term behavior of oil-based varnishes and paints I. Spectroscopic analysis of curing drying oils. J. Am. Oil Chem. Soc. 76, 967–976 (1999). [Google Scholar]
- 31.Baiz C. R., Schach D., Tokmakoff A., Ultrafast 2D IR microscopy. Opt. Express 22, 18724–18735 (2014). [DOI] [PMC free article] [PubMed] [Google Scholar]
- 32.Villafana T. E., Brown W. P., Delaney J. K., Palmer M., Warren W. S., Fischer M. C., Femtosecond pump-probe microscopy generates virtual cross-sections in historic artwork. Proc. Natl. Acad. Sci. U.S.A. 111, 1708–1713 (2014). [DOI] [PMC free article] [PubMed] [Google Scholar]
- 33.Tudryn G. J., O’Reilly M. V., Dou S., King D. R., Winey K. I., Runt J., Colby R. H., Molecular mobility and cation conduction in polyether–ester–sulfonate copolymer ionomers. Macromolecules 45, 3962–3973 (2012). [Google Scholar]
- 34.Ohshima T., Development of tetranuclear zinc cluster-catalyzed environmentally friendly reactions and mechanistic studies. Chem. Pharm. Bull. 64, 523–539 (2016). [DOI] [PubMed] [Google Scholar]
- 35.Morioka H., Tagaya H., Karasu M., Kadokawa J.-i., Chiba K., Preparation of hydroxy double salts exchanged by organic compounds. J. Mater. Res. 13, 848–851 (1998). [Google Scholar]
- 36.Huerta-Viga A., Shaw D. J., Woutersen S., pH dependence of the conformation of small peptides investigated with two-dimensional vibrational spectroscopy. J. Phys. Chem. B 114, 15212–15220 (2010). [DOI] [PubMed] [Google Scholar]
- 37.Swart M., Bickelhaupt F. M., QUILD: Quantum-regions interconnected by local descriptions. J. Comput. Chem. 29, 724–734 (2008). [DOI] [PubMed] [Google Scholar]
- 38.te Velde G., Bickelhaupt F. M., Baerends E. J., Fonseca Guerra C., van Gisbergen S. J. A., Snijders J. G., Ziegler T., Chemistry with ADF. J. Comput. Chem. 22, 931–967 (2001). [Google Scholar]
- 39.Clegg W., Little I. R., Straughan B. P., The chain polymeric structure of zinc(II) crotonate. Acta Crystallogr., Sect. C: Struct. Chem. 42, 919–920 (1986). [Google Scholar]
- 40.Rehr J. J., Kas J. J., Vila F. D., Prange M. P., Jorissen K., Parameter-free calculations of x-ray spectra with FEFF9. Phys. Chem. Chem. Phys. 12, 5503–5513 (2010). [DOI] [PubMed] [Google Scholar]
Associated Data
This section collects any data citations, data availability statements, or supplementary materials included in this article.
Supplementary Materials
Supplementary material for this article is available at http://advances.sciencemag.org/cgi/content/full/5/6/eaaw3592/DC1
Supplementary Materials and Methods
Fig. S1. The change in the carboxylate band envelope in a ZnO-LO mixture.
Fig. S2. Quantification of the change in the carboxylate band envelope upon drying.
Fig. S3. The evolution of the Zn4O band at 530 cm−1 during curing of LO/Zn.
Fig. S4. Calculated and experimental XANES spectra of LO/Zn.
Fig. S5. Calculated IR spectra of a distorted chain complex.
Fig. S6. Powder XRD traces of two types of ZnPa samples.
Reference (40)