

Abstract
Apoptosis is triggered in the developing mammalian brain by sedative, anesthetic or antiepileptic drugs during late gestation and early life. Whether human children are vulnerable to this toxicity mechanism remains unknown, as there are no imaging techniques to capture it. Apoptosis is characterized by distinct structural features, which affect the way damaged tissue scatters ultrasound compared to healthy tissue. We evaluated whether apoptosis, triggered by the anesthetic sevoflurane in the brains of neonatal rhesus macaques, can be detected using quantitative ultrasound (QUS).
Neonatal (n=15) rhesus macaques underwent 5hr of sevoflurane anesthesia. QUS images were obtained through the sagittal suture at 0.5 and 6hr. Brains were collected at 8hr and examined immunohistochemically to analyze apoptotic neuronal and oligodendroglial death.
Significant apoptosis was detected in white and gray matter throughout the brain, including the thalamus. We measured a change in the effective scatterer size (ESS), a QUS biomarker derived from ultrasound echo signals obtained with clinical scanners, after sevoflurane-anesthesia in the thalamus. Although initial inclusion of all measurements did not reveal a significant correlation, when outliers were excluded, the change in the ESS between the pre- and post-anesthesia measurements correlated strongly and proportionally with the severity of apoptotic death.
We report for the first time in vivo changes in QUS parameters, which may reflect severity of apoptosis in the brains of infant nonhuman primates. These findings suggest that QUS may enable in vivo studies of apoptosis in the brains of human infants following exposure to anesthetics, antiepileptics and other brain injury mechanisms.
Keywords: Apoptosis, Sevoflurane, Quantitative Ultrasound, Thalamus, brain injury, neonatal, development, imaging, primate
Almost two decades ago, it was reported that antagonists of the N-methyl-D-aspartate (NMDA) subtype of glutamate receptors and agonists of the γ-aminobutyric acid A (GABAA) receptor cause cell death in the rat brain during a period of rapid brain growth.1–4 Sedative, anesthetic and antiepileptic drugs, which inhibit glutamatergic and/or enhance GABAergic neurotransmission, have the potential to trigger apoptosis of neurons and oligodendrocytes in the brain during late gestation and early postnatal life.1–5,6–15 As of today, it remains unknown whether human infants are vulnerable to this toxicity mechanism, as there are no imaging techniques to enable capturing and quantifying apoptosis in vivo in their brains.
Apoptosis is characterized by distinct structural changes consisting of compaction and segregation of nuclear material, fragmentation of the nucleus and budding of membrane-bound apoptotic bodies.5,16 These changes in tissue microstructure alter the way damaged tissue scatters ultrasound compared to healthy tissue.16,17
Quantitative ultrasound (QUS) has been used successfully to study the unique scattering properties of apoptotic cells in cancer.16,17 It can be used to characterize tissue microstructure based on echo signal intensity, effective scatterer size, scatterer organization, anisotropy, and scatterer concentration.18–19 These techniques have been shown to distinguish damaged cells from healthy cells in cancers.16–22 QUS has been used successfully to provide rapid therapy response assessment in human cancers,21,22 evaluate early treatment responses to radiation and/or chemotherapy and provide guidance for suitable future direction of treatment.17,13–25 This has been demonstrated recently in vivo using conventional diagnostic frequencies (7–10 MHz) where apoptotic cell death was successfully distinguished during radiation therapy, chemotherapy and photodynamic therapy.17 QUS has never before been used to study the in vivo infant macaque brain, which is highly inhomogeneous.
QUS methods use the raw radiofrequency (RF) echo signal data (recorded before any signal processing occurs) to estimate parameters that are descriptive of the underlying tissue microstructure.26–31 Several studies have confirmed that normalized RF power spectra from ultrasound can be quantitatively analyzed to characterize a wide variety of tissues and their microstructure.16,17;20,21;26–33 Two QUS parameters with demonstrated potential in the liver, kidney, breast and thyroid are the effective scatterer size and the acoustic concentration.28–32 These are obtained from the frequency-dependent backscatter coefficient, which is related to echogenicity or brightness in conventional B-mode images and quantifies the fraction of the incident energy that is scattered back to the transducer (per unit volume).18
Recent studies document that exposure of fetal or infant rhesus macaques to the anesthetic agents isoflurane, propofol and ketamine triggers apoptotic injury6–15 of neurons and oligodendrocytes (oligos). Sevoflurane (SEVO) is the most frequently used inhalation anesthetic in pediatric anesthesia. It has been shown to cause apoptosis in infant rodents,15 but no studies delineating neuropathological toxicity in nonhuman primates have been described.
Our first aim was to investigate whether SEVO induces apoptosis in the neonatal rhesus monkey (Macaca mulatta) brain and if so, to characterize the neuropathological pattern of this toxicity.
Our second aim was to determine whether QUS can detect and quantify changes in the effective size and concentrations of ultrasound scatterers consistent with apoptotic cell death in brain tissue of SEVO exposed monkeys in vivo.
Methods
Animals
All animal procedures were performed at the Wisconsin National Primate Research Center, approved by the Institutional Animal Care and Use Committee of the College of Letters and Sciences and Vice Chancellor for Research and Graduate Education Center of the University of Wisconsin-Madison, and were conducted in full accordance with the Public Health Service Policy on Humane Care and Use of Laboratory Animals.
Sevoflurane anesthesia was administered to the infant rhesus macaque monkeys. Postnatal day 2–7 (P2-P7) rhesus macaques were used for these experiments. All animals were examined by a veterinarian at birth and prior to the experiment. They were all healthy infants born at term via vaginal delivery without any complications. Infants were separated from their mothers and exposed to either room air (n = 6) or were exposed for 5hr to sevoflurane (n=15) maintained at a concentration that provided a moderate plane of surgical anesthesia as defined by no movement and not more than 10% increase in heart rate or blood pressure in response to a mosquito clamp pinch at hand and foot. At 8hr after induction of anesthesia, animals were injected with an overdose of ketamine and euthanized by transcardial perfusion fixation using phosphate buffered saline followed by 4% paraformaldehyde in phosphate buffer. The brains were subsequently subjected to histopathological analysis.
Histopathology Studies
Using a vibratome, the brains were sectioned serially in 70uM coronal sections across the entire rostrocaudal extent of the forebrain, midbrain, brainstem and cerebellum. Sections were selected at 2mm intervals (30 sections/brain) and stained by activated caspase 3 (AC3) immunohistochemistry. The nonfluorescent AC3 staining method permits comprehensive quantification of apoptotic profiles in sevoflurane-exposed versus control brains. It provides a permanent record of the cell death pattern throughout the brain, and also robustly stains both cell bodies and processes. This allows one to distinguish early from late stages of degeneration. As previously demonstrated,6,7,10,13 both neurons and oligodendrocytes are sensitive to the proapoptotic effect of anesthetic agents. We used both localization within the brain (grey vs white matter), morphology of the cells and cell specific immunohistochemical markers to determine whether neurons and oligodendrocytes were injured by sevoflurane.
Analysis of neuronal and oligodendroglial Cell Death
To clarify what cell type was undergoing apoptosis, AC3 was immunofluorescently co-labeled with markers for either neurons (NeuN; 1:100; Chemicon, Pittsburg, PA), oligodendrocytes (myelin basic protein, 1:100; Millipore, Burlington, MA or O4, 1:50; Sigma Aldrich, St. Louis, MO), or astrocytes (GFAP; 1:400; Sigma Aldrich, St. Louis, MO). After overnight incubation at 4°C, primary antibodies were then labeled with fluorescently tagged secondary antibodies (goat anti-rabbit Alexa 555 and goat anti-mouse Alexa 488; 1:200; Invitrogen, Waltham, Massachusetts) and counterstained with DAPI nuclear stain.
The method we used for cell type identification was first described in 20127. The investigators went into great lengths to show that isoflurane produces apoptosis in oligodendrocytes undergoing myelinogenesis and that AC3 labeling of these cells results in a central soma surrounded by a halo of apoptotic debris. Isoflurane-induced apoptosis in neurons could be identified by their soma and processes becoming fully engulfed with AC3. It was also shown that several other GABA agonists (such as alcohol8 and propofol9) produce oligoapoptosis presenting with the same cellular morphology. Since then, this method has been used to differentiate neuronal from oligodendroglial apoptosis based on distinct morphological characteristics.10–14 This conclusion is bolstered by the fact that myelin basic protein co-labels with AC3 and the oligoapoptotic cells are highly localized within white matter.
Quantification of Apoptosis
AC3-positive neuronal profiles, visualized by immunoperoxidase staining, were counted by an investigator who was blinded to the treatment condition. Each entire stained section was analyzed by light microscopy using a ×10 objective lens and a computer-assisted Stereo Investigator system (Microbrightfield, Williston, VT) with an electronically driven motorized stage. In each section, the identity and location of each AC3 stained profile was plotted. The rater used color coding and, on the basis of location and morphological appearance, plotted each stained profile as either a red dot (neuron) or green dot (oligodendroglia). The total area scanned and the total number of stained neurons or oligodendroglia per section and per brain were computer recorded. White matter boundaries were also defined to calculate the density of AC3 profiles in the white matter. From the recorded information, the density of apoptotic profiles per cubic millimeter was estimated for the entire brain or for any given region within the brain, and the total number of apoptotic profiles in the entire brain was also estimated. In addition, a computer plot showing the regional distribution of stained profiles was generated, and the plots for each region of each brain for each treatment condition were compared.
AC3-labeled cells that contained a nucleus with features of typical apoptotic degeneration (condensed or fragmented nucleus) were defined as degenerating cells. A minimum of 10 fields were counted in each tissue section. Cells with atypical appearing nuclei (e.g., fusiform or sickleshaped nuclei) were also counted and categorized separately. No significant differences in the density of these atypical nuclei were found for the control and experimental groups, and these counts were not included in the analysis.
Statistical Analysis
Data are presented as mean ± standard error of the mean (SEM). Student t test with Welch correction, where appropriate, was used. A 2-sided p value <0.05 was judged significant, and the 95% confidence interval for the mean difference provided a measure of precision. Statistical analysis was performed with Prism (GraphPad Software, La Jolla, CA).
Quantitative Ultrasound
Ultrasound data from 15 2-7 d/o macaques were obtained with a 10V4 neonatal cranial phased array transducer on a Siemens Acuson S3000 scanner (Siemens Healthcare, Ultrasound Business Unit, Mountain View, CA, USA). Raw radiofrequency (RF) echo signals were obtained through the system’s Axius Direct User Research Interface.34 The sonographer imaged the thalamus coronally through the sagittal suture as described in the main text and obtained 15 frames of RF signals. Data were processed offline using MATLAB (Mathworks, Natick, MA, USA) custom code on a desktop workstation. RF data frames were converted to B-mode images that were shown to the neurologist to pick ROIs on the left and right thalami for QUS analysis. Typically, the echo signal power spectra from the selected ROI exhibited a peak value at 5.5 MHz. An analysis frequency range from 3.0 MHz to 9.2 MHz was chosen and applied to all data sets. To proceed with further processing, each RF data frame was subjected to the following acceptance criteria to avoid processing noise: (1) suitable data for QUS analysis existed in both sides of the thalamus (lack of visible reverberations or specular reflectors in B-mode images); and (2) a peak signal-to-noise ratio of at least 15dB is present in order to reduce estimation variance. 35 Data from 4 subjects did not pass these acceptance criteria. Within each ROI of frames that passed the criteria, echo signal power spectra were computed from RF signals using a multitaper approach.36,37 System effects were removed from spectra by normalizing with respect to reference spectra obtained from a tissue-mimicking, agarose-based gel phantom containing micron-sized glass bead scatterers, scanned with the same technique as the thalamus.38 Attenuation effects caused by cortical white matter between the transducer and the ROI were compensated for by using attenuation values reported by Kremkrau et al.39 on an exponential decay model. This resulted in the backscatter coefficient for each ROI position. The effective scatterer size, ESS, and the acoustic concentration, AC, were computed by minimizing the square difference between the estimated backscatter coefficient and a theoretical Gaussian form factor model29 over a frequency bandwidth with backscatter energy at least 10dB above the noise floor.
Acceptance criteria and statistical analysis for QUS
Statistical analysis was done using MATLAB. ESS and AC values were subjected to a third acceptance criterion, defined as observing the same polarity (increase/decrease) of changes in each QUS parameter in both sides of the thalamus. To define the agreement, a Wilcoxon rank sum test was done between values at 6hr and 0.5hr for each side of the thalamus of each subject. This resulted in 6 categories of agreement: (1) Discrepancy: at least one side showing significant change, but the other side having a change with the opposite polarity, either significant or not; (2) Decrease: significant reductions in both sides; (3) Partial decrease: significant reduction in one side, reduction (not significant) in the other side; (4) No change: no significant change in either side of the thalamus; (5) Partial increase: significant increase in one side, increase (not significant) in the other side; and (6) Increase: significant increase in both sides. Discrepancy was found in two subjects (different ones) for each parameter. For the remaining 9 subjects, and after demonstrating no significant difference of ESS and AC between left and right sides of the thalamus (Wilcoxon rank sum p(ESS)=0.81, p(AC)=0.91), inter-frame median values of ESS and AC for each side were averaged, leading to a single ESS and AC value for each subject. Inter-frame standard deviations were propagated to obtain the uncertainty of the combination of both sides for each subject. Finally, the percent change of ESS and AC between 6.0hr and 0.5hr relative to 0.5hr was computed. Outliers were identified based on a 1.5×Interquartile Range criterion. The level of correlation between percent changes of ESS and AC not considering outliers with immunohistologically-assessed apoptotic score was quantified with a Pearson correlation coefficient, with the 95% confidence interval as a statement of precision.
Results
Sevoflurane causes apoptosis in the infant rhesus macaque brain
Rhesus monkeys aged 2-7 days (n=15) were exposed for 5hr to 2.5-3.5% SEVO delivered via an endotracheal tube. The concentration of SEVO was maintained at a level that provided a moderate plane of surgical anesthesia, defined by no movement in response to a mosquito clamp pinch at hand or foot. After 5hr of anesthesia followed by 3hr of observation, animals were euthanized and transcardially perfusion-fixed to prepare the brain for neuropathological analysis, including immunohistochemistry for activated caspase 3 (AC3), which labels cells destined to undergo apoptosis; neuronal nuclear antigen (NeuN), which labels neurons; myelin basic protein (MBP), which labels oligodendrocytes; and glial fibrillary acidic protein (GFAP), which labels astrocytes. Six age-matched control animals were separated from their mothers for 8hr. They were then euthanized by perfusion fixation, and their brains were subjected to histopathological analysis to establish baseline values for apoptosis in the rhesus monkey brain at this age.
Animals tolerated SEVO anesthesia well; they all survived SEVO induction and maintenance. Continuous infusion of dextrose containing fluids and active temperature control were administered throughout anesthesia and until euthanasia. Vital signs, blood gases, electrolytes and blood glucose remained within normal limits (Table 1). Infants recovered after cessation of SEVO delivery and were extubated to room air within 5-10 min. All infants tolerated formula milk for 2hr prior to euthanasia, which was performed at 8hr after SEVO induction.
Table 1:
Physiologic variables in infant rhesus monkeys which underwent sevoflurane anesthesia for 5hr and euthanized at 8hr. Measurements were taken at 0.5, 2, 4 and 6hr after initiation of sevoflurane anesthesia. HR: heart rate; pCO2: partial CO2 pressure; SaO2: oxygen saturation measured by pulse oximetry; EtCO2: endtidal CO2. Hb: hemoglobin.
| T (°C) (mean ± SEM) N=15 |
Weight (kg) (mean ± SEM) N=15 |
Age (days) (mean ± SEM) N=15 |
Sex distribution N=15 |
0.5hr (mean ± SEM) N=15 |
2hr (mean ± SEM) N=15 |
4hr (mean ± SEM) N=15 |
6hr (mean ± SEM) N=15 |
|
|---|---|---|---|---|---|---|---|---|
| 37.31 ± 0.10 | 0.54 ± 0.01 | 4.03 ± 0.32 | 6F, 9M | |||||
| pH (venous) | 7.361 ± 0.010 | 7.371 ± 0.014 | 7.404 ± 0.013 | 7.369 ± 0.016 | ||||
| HR (beats/min) | 166.41 ± 6.63 | 158.24 ± 6.049 | 155.94 ± 7.64 | 166.71 ± 6.51 | ||||
| pCO2 mmHg | 43.54 ± 1.25 | 47.31 ± 1.54 | 43.87 ± 1.18 | 41.08 ± 2.12 | ||||
| SaO2 % | 96.18 ± 0.71 | 96.65 ± 1.40 | 98.59 ± 0.30 | 97.59 ± 0.59 | ||||
| EtCO2 % | 27.47 ± 1.26 | 28.24 ± 1.38 | 28.65 ± 0.96 | |||||
| Lactate mM | 1.88 ± 0.20 | 1.49 ± 0.20 | 1.54 ± 0.13 | 3.65 ± 0.36 | ||||
| Hb mg/dl | 12.35 ± 10.91 | 12.62 ± 0.87 | 12.94 ± 0.78 | 12.79 ± 0.94 | ||||
| Glucose mM | 98.06 ± 12.63 | 108.89 ± 17.90 | 68.88 ± 6.01 | 85.31 ± 9.59 |
SEVO induced a distinctive pattern of apoptotic cell death (Fig. 1 A–C, 2 A) that prominently affected neurons in specific layers of the parietal (somatosensory), temporal (auditory), occipital (visual), cingulate/retrosplenial cortex, the caudate nucleus, nucleus accumbens, putamen and thalamus. Oligodendrocytes in the subcortical white matter, corpus callosum and all major white matter tracts in the entire rostrocaudal extent of the forebrain were affected (Fig. 1, 2). Oligodendroglial degeneration was also observed in the diencephalon (e.g., the optic tract), the midbrain (e.g., the cerebral peduncles), and hindbrain (e.g., cerebellar peduncles and medial lemniscus).
Fig. 1: Histological features of SEVO-induced apoptotic cell death in the neonatal rhesus monkey brain.
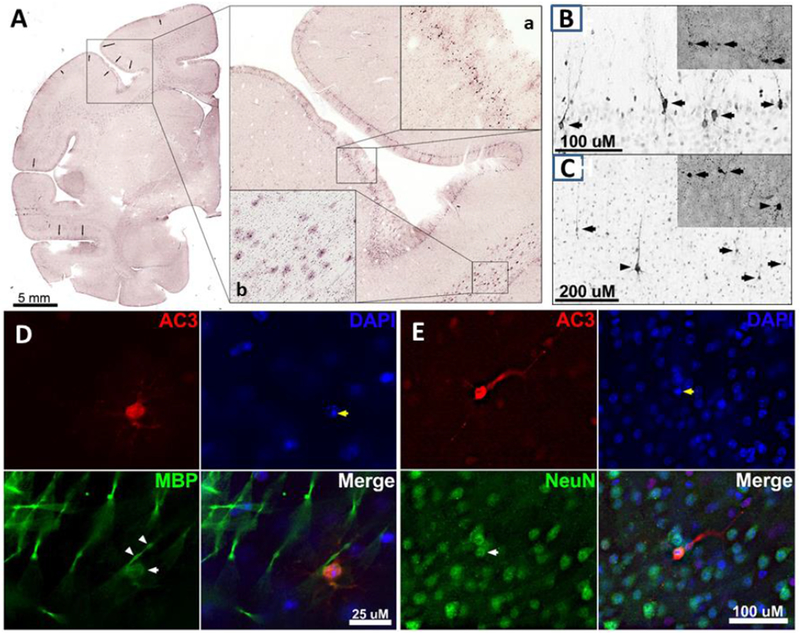
A. Photocomposite depicting a coronal section through the rostral forebrain of a P5 rhesus monkey exposed to SEVO anesthesia for 5hr. The framed area shows part of the motor cortex (Area 6) stained immunohistochemically for activated caspase 3 (AC3). Further magnification demonstrates dense neurodegeneration within layer II (magnified box a). Oligodendrocytes immunopositive for AC3 are shown in magnified box b in the corpus callosum. Photocomposites of neurodegeneration in layers II (B) and V (C) of the visual cortex following sevoflurane exposure. Neurotoxicity was measured through AC3 immunolabeling and confirmed with silver staining (insets). (B) In cortical layer II, apoptotic neurons (arrows) are fully engulfed with AC3 and are thought to be GABAergic interneurons. (C) In cortical layer V, a large apoptotic pyramidal cell (arrow heads) can be seen surrounded by several multipolar cells thought to be Martinotti cells (arrows). D: Triple fluorescent image of the cortex immunolabeled with AC3 (apoptotic marker), DAPI (a nuclear stain), and MBP (a selective oligodendrocyte marker). MBP (green) reveals labeling of the oligodendroglial soma (white arrow) and myelin sheath (white arrow heads) that co-labels with AC3. DAPI staining exhibits the formation of nuclear apoptotic balls within the AC3 positive cell (yellow arrows). E: Triple fluorescent image of the cortex immunolabeled with AC3 (apoptotic marker), DAPI (a nuclear stain), and NeuN (a selective neuronal marker). NeuN (green) labels numerous neurons with one (white arrow) co-labeling with AC3 (red). DAPI (blue) staining exhibits the formation of apoptotic balls within the AC3 positive nucleus (yellow arrows).
Fig. 2: Distribution pattern and quantification of SEVO-induced apoptosis in the neonatal rhesus monkey brain.
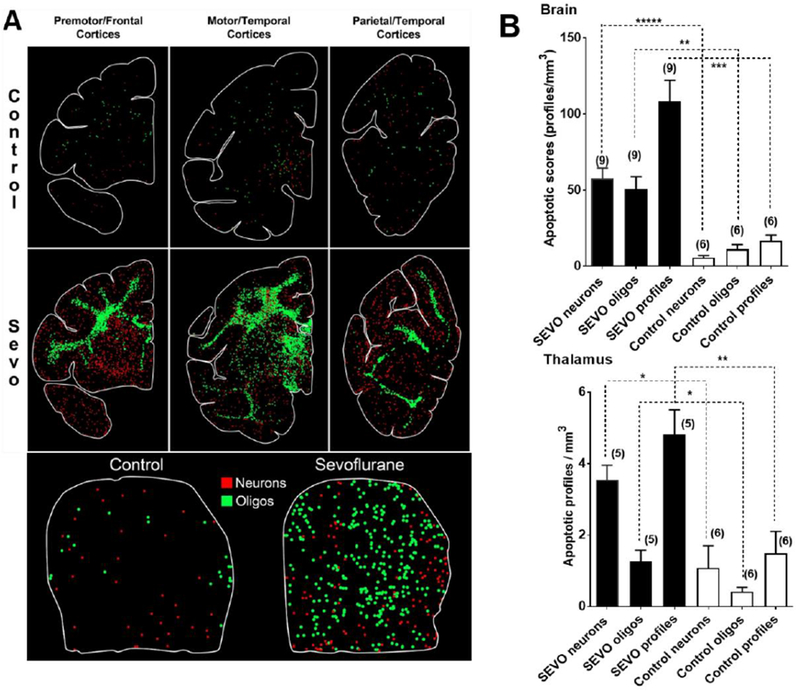
A depicts computer generated plots showing the distribution of apoptotic neurons (red dots) and apoptotic oligodendroglia (green dots) in sections cut at an anterior, mid-rostrocaudal and caudal level of the telencephalon and the thalamus (lower panel). The control brain has sparse numbers of apoptotic profiles, and there is no pattern of concentration in any particular region. Oligodendroglial profiles are concentrated in white matter and the neuronal profiles in gray matter. Apoptotic profiles in the SEVO-exposed brain are much more abundant, with oligodenderoglia being heavily concentrated in white matter zones, and neurons showing dense packing in specific gray matter areas. B Densities of AC3 immuno-positive apoptotic neurons, oligodendroglia, and profiles (neurons + oligodendroglia) in the entire brain (upper graph) and in the thalamus (lower graph) of neonatal rhesus monkeys exposed to SEVO. Depicted are means ± SEM. There were a total of 9 SEVO exposed monkeys and 6 non-exposed controls. The 9 SEVO exposed monkeys are the ones whose QUS scans met quality criteria and were selected for analysis. All apoptotic score values for the SEVO-exposed brains were significantly higher than those in the control brains at the significance levels indicated (*P<0.05; **P<0.01; ***P<0.001; ****P<0.0001; two-sided Student’s t-test).
For quantification purposes, activated caspase 3 (AC3)-positive profiles, which represent cells undergoing apoptosis (Fig. 1), were counted by an investigator who was blinded to the treatment condition. Each entire stained section was analyzed by light microscopy and a computer-assisted Stereo Investigator system (Microbrightfield, Williston, VT). In each section, the identity and location of each AC3 stained profile was plotted (Fig. 2A). The density of apoptotic profiles per cubic millimeter (apoptotic score) was estimated for the entire brain or for any given region within the brain, and the total number of apoptotic profiles in the entire brain was estimated. As Fig. 2B demonstrates, exposure to SEVO resulted in a significant apoptosis response compared to control age-matched rhesus monkeys. Within the thalamus, a significant apoptotic response to SEVO was measured compared to the control group (Fig. 2A, B). Morphological analyses of individual cells revealed that the apoptotic response was not confined to a specific cell type, as large multipolar neurons (layers V and VI), large and small pyramidal neurons (layers IV and V) and interneurons of various divisions of the cerebral cortex were affected.
Quantitative ultrasound and apoptosis in the infant rhesus macaque brain following sevoflurane anesthesia
Our second aim was to determine whether QUS can detect and quantify changes in the effective size and concentrations of ultrasound scatterers consistent with apoptotic cell death in brain tissue of SEVO exposed monkeys in vivo.
To explore this question, raw (unprocessed) ultrasound RF echo signals needed for QUS were obtained within 30min (0.5hr) and at 6.0hr after induction of anesthesia with SEVO. QUS analysis was done on the thalamus due to its demonstrated sensitivity to SEVO and because it is easy to locate in conventional B-mode images. Coronal views of the thalamus were obtained through the sagittal suture at mid distance between bregma and lambda. A typical B-mode image is shown in Fig. 3. The imaging window in the rhesus macaque neonate is very small because the anterior and posterior fontanels are already closed, thus, imaging the neocortex was virtually impossible. However, by using a dedicated neonatal phased array transducer, we were able to obtain high quality images from the basal ganglia and in particular the thalamus (Fig. 3) which is the area chosen for quantitative analysis.
Fig. 3: Conventional B mode image of a coronal view of the thalamus.
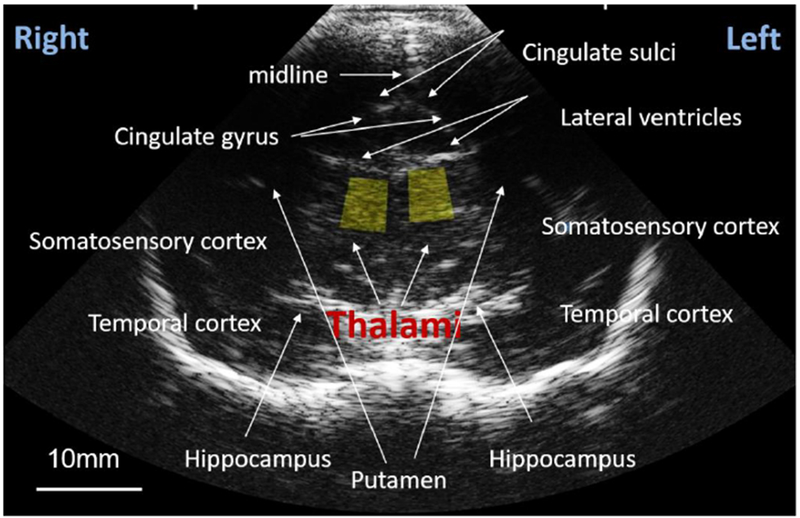
Yellow boxes indicate 25mm2 regions of interest from which values of the effective scatterer size ESS and acoustic concentration AC were obtained.
Typical echo signal processing in all commercial ultrasound imaging systems discards the RF echo signal phase information to create B-mode, echo amplitude images.
RF backscattered echo signals were acquired through the Axius Direct Ultrasound Research Interface29 enabled in the ultrasound scanner. Each scan produced “frames” of RF echo signal data. Fifteen RF frames were obtained by slightly tilting and translating the transducer without losing sight of the thalamus. Subsequently, 20-25 frames of RF data were obtained from a reference phantom (manufactured and calibrated in our lab), whose attenuation and backscatter coefficients vs frequency, were known.40–42 This procedure was performed at 30min (0.5hr) and repeated at 6.0hr after initiating SEVO. To improve repeatability of the measurements at 0.5hr and 6.0hr, the 0.5hr images were viewed by the sonographer acquiring the images during experiments at 6.0hr. All data processing was performed offline after data acquisition. Two 25 mm2 regions of interest (ROIs) were located by the neurologist (C.I.) in the left and right thalami (yellow boxes in Fig. 3), and echo-signal power spectra were computed for the echo signals within the ROIs.37 To obtain backscatter properties, system effects were removed by normalizing the thalamus spectra by the reference phantom spectra, acquired from ROIs at the same depth.32 Attenuation effects caused by white matter between the transducer and the thalamus were removed by considering an exponential energy decay with values of the attenuation coefficient of white matter in the infant brain reported by Kremkrau et al.39
The frequency dependence and magnitude of the backscatter coefficient were used to quantify the effective scatterer size (ESS) and the acoustic concentration (AC; product of the number of scatterers and the mean-squared impedance difference between the scatterer and the surrounding medium), respectively.18 The estimation of ESS and AC was performed at each ROI location, thus resulting in 15 estimates (from each frame) of each parameter at each side of the thalamus and each subject at 0.5hr and at 6.0hr. Because of the finite size of the ROIs, each ESS and AC represents the average parameter value within the ROI area.
Only scans which met quality criteria were selected for analysis. The first criterion ensures that QUS parameters represent tissue scattering properties and not noise. The second criterion is based on the expected same effect of SEVO in both sides of the thalamus. Data from 9 subjects fulfilled these criteria. No significant differences were found in ESS values between the left and right sides of the thalamus, thus allowing combination estimates from both sides. Table 2 shows ESS and AC values at 0.5hr and 6.0hr of the subjects that passed the acceptance criteria, as well as values of the apoptotic score. Figures 4A and 4B show the median (and standard deviation as error bars) of the percent change of ESS and AC between 30min (0.5hr) and 6.0hr of the 9 subjects that passed the criteria of reliability. Ignoring outliers based on a 1.5×Interquatile Range criterion, significant reductions were observed in ESS values at 6.0hr compared to 30min (0.5hr) in 5/6 subjects, while AC significantly decreased in 5/9 subjects.
Table 2.
Apoptotic score and QUS parameter values at 0.5hrs and 6hrs for subjects that passed the acceptance criteria. ESS: effective scatterer size, AC: acoustic concentration. NP: not passed.
| Subject No. | Apop. score (cells / mm3) | ESS (0.5hrs) (μm) | ESS (6hrs) (μm) | ΔESS (%) | Subject No. | Apop. score (cells / mm3) | AC (0.5hrs) (dB) | AC (6hrs) (dB) | ΔAC (%) |
|---|---|---|---|---|---|---|---|---|---|
| 1 | 107.92 | 164±2 | 153±3 | −6±2 | 1 | 107.92 | −38.2±0.9 | −43.7±0.7 | −14±3 |
| 4 | 116.6 | 164±3 | 178±3 | 9±2 | 2 | 327.84 | −33.1±0.7 | −38.0±0.6 | −15±3 |
| 5 | 125.86 | 161±6 | 149±3 | −7±4 | 3 | 35.66 | −36.3±05 | −35.9±0.7 | 1±3 |
| 6 | 94.97 | 174±2 | 166±4 | −4±2 | 5 | 125.86 | −40.4±1.5 | −34.7±2.2 | 14±7 |
| 7 | 42.18 | 158±1 | 154±2 | −2±2 | 6 | 94.97 | −41.3±0.6 | −40.1±1.0 | 3±3 |
| 8 | 57.51 | 171±2 | 186±2 | 9±1 | 7 | 42.18 | −36.1±0.6 | −37.4±0.4 | −4±2 |
| 9 | 91.97 | 144±1 | 114±3 | −21±2 | 8 | 57.51 | −29.3±0.4 | −29.5±0.4 | 0±2 |
| 10 | 57.86 | 175±4 | 172±4 | −2±3 | 10 | 57.86 | −36.0±1.4 | −38.6±1.4 | −7±6 |
| 11 | 99.76 | 164±2 | 154±3 | −6±2 | 11 | 99.76 | −28.5±0.8 | −30.8±0.6 | −8±3 |
Fig. 4: Changes in QUS parameters after 6.0hr of initiating SEVO exposure for each subject expressed as a percentage of the value measured at 0.5hr.
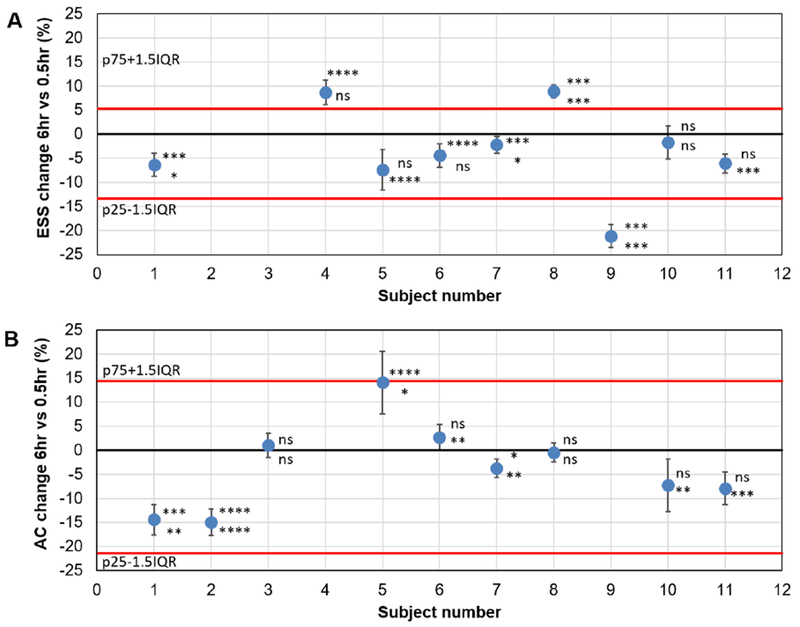
A depicts changes in the effective scatterer size (ESS). B depicts changes in the Acoustic concentration. AC. Each data point is accompanied by asterisk indicating statistical significance of changes in left (top) and right (bottom) sides: ns for P>0.05; * for P<0.05, ** for P<0.01, *** for P<0.001, **** for P<0.0001. Error bars show the propagated standard deviation from averaging the medians of left and right thalamus. Black solid line indicates 0% change. Red lines indicate bounds for outliers based on a 1.5×IQR criterion, where p75 and p25 are the 75 and 25 percentiles, respectively, and IQR is the interquartile range. A shows three outliers while B shows none. Ignoring outliers and considering a reduction in QUS parameters as a positive test, the ESS would give a sensitivity of 5/6 or 83% (5 reductions, 1 no significant change), while ESS would give a sensitivity of 5/9 or 55% (5 reductions, 2 no significant changes, 2 increases).
Median values of the percent change for both ESS and AC at 6hr vs 0.5hr were grouped for all subjects for statistical analysis of the difference in the ESS and AC before and after the administration of SEVO. Figures 5A and 5B show the 6.0hr vs 0.5hr percent change in ESS as a function of the apoptotic score (density of apoptotic profiles/mm3). In the case of ESS, data from three subjects were identified as outliers because they were beyond the range spanned by 1.5 times the interquartile range. Considering only inliers, we found a strong negative correlation (Pearson correlation coefficient r= −0.95, 95% CI=−1.00 to −0.64) between change in ESS and apoptotic score. This indicates a larger reduction of ESS as apoptotic score increases. In contrast, the correlation between the AC and the apoptotic score (Fig. 5B) was poor (r= −0.39, 95% CI=−0.84 to 0.37). Thus, from the two investigated parameters, ESS holds promise for detection of apoptotic brain injury caused by administration of SEVO.
Fig. 5: Changes in QUS parameters after 6.0hr of initiating SEVO exposure expressed as a percentage of the value measured at 0.5hr vs apoptotic score.
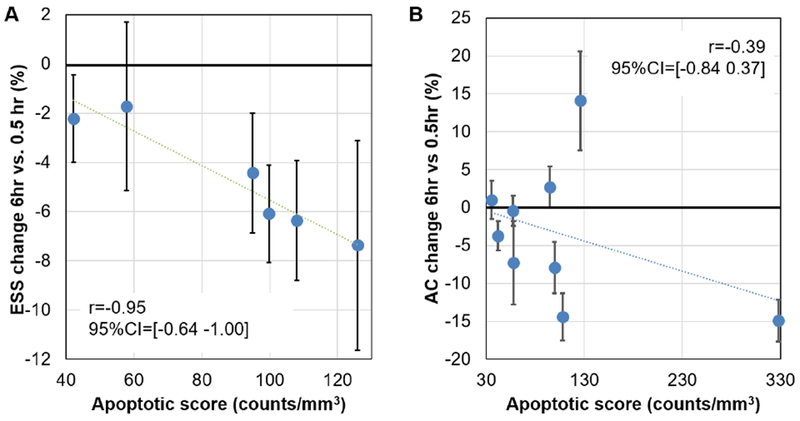
A depicts changes in the effective scatterer size (ESS) after exclusion of outliers. B depicts changes in the Acoustic Concentration (AC). Also shown are values of the Pearson correlation coefficient and its 95% confidence interval. Values of the correlation coefficient indicate that, as more apoptosis is induced, the reduction in ESS becomes more prominent. No important correlation is observed between the AC and the apoptotic score.
Discussion
Here we show that SEVO anesthesia has the potential to irreversibly injure the neonatal primate brain. The apoptotic response elicited by SEVO resembles in terms of distribution and severity that described following isoflurane and propofol administration6–15 and affects both neurons and oligodendrocytes. Of high significance and translational value is our finding that ESS is altered within the thalamus in vivo following exposure to SEVO in a way that appears to correlate with the severity of apoptosis detected using histological techniques.
ESS changes correlated strongly with apoptotic scores when outliers were excluded. Although, as figure 2 clearly shows, thalamic tissue is much less vulnerable at this age to the proapoptotic effect of SEVO than other brain regions, ESS changes were measured in association with even the small increase of apoptosis in the thalamus. Unfortunately, the technical challenges of performing ultrasound studies through a very small imaging window (the sagittal suture) in the infant rhesus monkey precluded us from studying more vulnerable brain regions such as the cortex and subcortical white matter. Our study is further limited by the fact that we were unable to obtain repeat QUS measurements in non-anesthetized controls due to extreme motion artefacts in awake animals. Thus, our current data in nonhuman primate infants do not allow conclusions regarding false positives and false negatives. Furthermore, conclusions are limited in that a strong correlation between changes in ESS and apoptotic scores was seen after (but not before) outliers were eliminated. However, given the proven capability of QUS to detect and quantify apoptosis in cancer tissue16–25, we feel confident that further optimization of data acquisition and higher numbers of studied subjects will allow more definitive conclusions about its capability to also detect and quantify apoptosis in the primate brain.
QUS results of only 9 out of the 15 scanned subjects passed the left-right side agreement acceptance criteria. The large variance and data paucity of our analysis could be attributed, in part, to the violation of the assumption of diffuse scattering required in the estimation of these parameters. A preliminary analysis on the prevalence of this condition on the data set (results not shown) indicated that diffuse scattering was found only in 23% of our measurements, with larger proportions of our data showing a low scatterer density, which leads to low spectral SNR, or the presence of specular reflectors, which can introduce bias in the ESS and the AC. Interestingly, in the data in which we found discrepancy between QUS parameters from the left and right thalamus, the chance of fulfilling the conditions of diffuse scattering was very low compared to the cases in which we saw agreement. Coherent scattering could have contributed to the presence of outliers. Two of the cases (animals 4 and 8 in table 2) that were identified as outliers were found having specular reflectors in at least 50% of the ultrasound data from either the 0.5hr or 6.0hr scans. In the case of animal 9, data acquired at 6.0hr from the right thalamus presented low scatterer density. These observations demonstrate the complexity of the analysis of the thalamic microstructure with Quantitative Ultrasound. Thus, we are currently refining the preliminary QUS analysis presented here and exploring ways of using information provided by coherent scattering46 to gain deeper insight into the underlying changes of brain tissue microstructure exposed to SEVO.
Another factor that could have contributed to discrepancy between results from both sides of the thalamus could be misalignment of the scanning planes at 0.5hr and 6.0hr. The thalamus is composed primarily of gray matter, with axon fibers forming bundles aligned in different directions.43 Bundles from each of the thalamus’ nuclei connect to different cortical zones.44,45 Because of the difficulty of imaging the exact same tissue at 0.5hr and 6.0hr, our measurements were subject to the effects of heterogeneity and anisotropy of the thalamic microstructure. Thus, current efforts are focused on standardizing data acquisition using anatomic fiducials such as blood vessels found with Doppler ultrasound to improve imaging reproducibility.
Another source of variance was the use of a single attenuation value for compensating for energy losses due to intervening tissues between the transducer and the region of interest. Although methods exist to make subject-based estimates of attenuation from RF signals, they require the presence of a homogeneous scattering field. As observed in figure 3, the complexity of the young rhesus brain does not create such conditions. We are currently developing signalprocessing methods that allow estimating attenuation under these conditions.
Despite these limitations, results that passed the acceptance criteria demonstrated that the ultrasound scattering properties of thalamic tissue change following a 5hr course of anesthesia in neonatal nonhuman primates in a way that correlates with the amount of apoptotic cell death present in this tissue, once outliers are eliminated. Interestingly, recent studies by Tadayyon et al.47 and Sannachi et al.48 on the use of ESS and AC to evaluate cell death of breast tumors treated with chemotherapy found larger sensitivity of AC to cell death. This difference from our results may be caused by different microstructural changes in breast and brain tissues. As demonstrated by the IHC analysis, a wide diversity of neurons and oligodendroglial cells undergo apoptosis after exposure to SEVO. Thus, it is likely that microstructural changes also reflect this diversity and result in changes in QUS parameters different from those observed in breast tissue. Future studies will investigate possible correlations between QUS parameters and histological evaluation of tissue microstructure to gain insight into the nature of the changes that we are sensing with QUS parameters in the brain.
Retrospective clinical studies in children exposed to sedative/anesthetic or antiepileptic drugs in utero, during infancy, or early childhood have delivered evidence for a correlation of repeat anesthesia with adverse neurodevelopmental outcomes. 49–59 Prospective studies with anesthetics in humans are currently ongoing. 57 All of these studies will rely of behavioral and neurocognitive outcomes to indirectly conclude about developmental neurotoxicity of anesthetics in humans.57 The ultimate question of whether anesthetics induce apoptosis in the brains of human infants will remain unanswered as long as non-invasive methods that allow in vivo detection of apoptosis in the brain are not established. QUS has the potential to close this gap and provide us with the opportunity to study whether the multitude of findings in animals on developmental CNS toxicity of multiple pediatric drugs is transferrable to humans.
Our findings raise hope that QUS will enable the study of in vivo apoptosis in human brains. In human infants the anterior and posterior fontanelles provide excellent sonographic windows which will likely allow studying the response of cortical and subcortical areas to various injurious insults.
Each year, millions of human infants sustain irreversible brain injuries following perinatal asphyxia, trauma, infection or seizures. Though, in this study, we used a prime model for apoptosis in the infant nonhuman primate brain to test capabilities of QUS, we believe that this technique may help explore the nature, distribution and time course of cell death caused by other types of insults, including perinatal asphyxia, trauma, seizures and infections. The translational potential of our work is high, given the open anterior and posterior fontanels in human infants and the possibility to repeatedly apply this technique safely at the bedside. The low cost, portability, lack of need of contrast agents, rapid image acquisition, and prospects for rapid processing of the RF signals makes QUS appealing for the in vivo study of cell death in the brain.18,19
Intriguing is also the thought that QUS might allow in vivo studies of the response to neuroprotective interventions in infancy. In our opinion, QUS has the potential to become a novel tool to assist in formulating long term prognosis for our young patients, assessing neuroprotective effects of therapeutic interventions in the peri-insult period, and provide means of neurologic monitoring in neonatal and pediatric intensive care medicine.
Highlights.
Sevoflurane triggers apoptosis of neurons and oligodendrocytes in primate brains
Quantitative ultrasound (QUS) measures changes in microstructure of the brain
Changes in effective scatterer size (ESS) correlate with the severity of apoptosis
QUS may be used to image apoptosis in vivo in the brains of human infants.
ACKNOWLEDGEMENTS
This research was supported by pilot grant award, Office of the Director, NIH P51OD011106 to WNPRC and NIH/NICHD R01HD083001-01A1 grant to C. Ikonomidou; NIH grants HD052664 and U54-HD087011 the Intellectual and Developmental Disabilities Research Center at Washington University to K. Noguchi. This work was also supported by UNAM-PAPIIT grants IA104518 and IN107916 to I. Rosado-Mendez and L. Castañeda-Martinez and CONACyT National Researcher (level 3) assistant support to L. Castañeda-Martinez.
Footnotes
Publisher's Disclaimer: This is a PDF file of an unedited manuscript that has been accepted for publication. As a service to our customers we are providing this early version of the manuscript. The manuscript will undergo copyediting, typesetting, and review of the resulting proof before it is published in its final citable form. Please note that during the production process errors may be discovered which could affect the content, and all legal disclaimers that apply to the journal pertain.
ADDITIONAL INFORMATION
Competing interests: The authors declare no competing interests
References
- 1.Ikonomidou C, Bittigau P, Ishimaru MJ,et al. Ethanol-inducedapoptotic neurodegeneration and fetal alcohol syndrome. Science 2000;287:1056–1060. [DOI] [PubMed] [Google Scholar]
- 2.Ikonomidou C, Bosch F, Miksa M, et al. Blockade of nmda receptors and apoptotic neurodegeneration in the developing brain. Science 1990;283:70–74. [DOI] [PubMed] [Google Scholar]
- 3.Bittigau P,Sifringer M,Genz K, et al. Antiepileptic drugs and apoptotic neurodegeneration in the developing brain. Proc Natl Acad Sci USA 2002;99:15,089–15,094. [DOI] [PMC free article] [PubMed] [Google Scholar]
- 4.Jevtovic-Todorovic V, Hartman RE, Izumi Y, et al. Early exposure to common anesthetic agents causes widespread neurodegeneration in the developing rat brain and persistent learning deficits. J Neurosci 2003;23;876–882. [DOI] [PMC free article] [PubMed] [Google Scholar]
- 5.Kerr JF, Winterford CM, Harmon BV. Apoptosis. It’s significance in cancer and cancer therapy. Cancer 1994;73:2013–2026. [DOI] [PubMed] [Google Scholar]
- 6.Brambrink AM, Evers AS, Avidan MS, et al. Isoflurane-induced neuroapoptosis in the neonatal rhesus macaque brain. Anesthesiology 2010;112:834–841. [DOI] [PMC free article] [PubMed] [Google Scholar]
- 7.Brambrink AM, Back SA,Riddle A, et al. Isoflurane-induced apoptosisof oligodendrocytes in the neonatal primate brain. Ann Neurol 2012;72:525–535. [DOI] [PMC free article] [PubMed] [Google Scholar]
- 8.Creeley C, Dikranian K, Dissen G, et al. Propofol-induced apoptosis of neurons and oligodendrocytes in fetal and neonatal rhesus macaque brain. Br J Anaesth 2013; 110:i29–Ϊ38. [DOI] [PMC free article] [PubMed] [Google Scholar]
- 9.Creeley E, Dikranian KT,Dissen GA, et al. Alcohol-induced apoptosisof oligodendrocytes in the fetal macaque brain. Acta Neuropathol Commun 2013;1:23. [DOI] [PMC free article] [PubMed] [Google Scholar]
- 10.Creeley E, Dikranian KT, Dissen GA, et al. Isoflurane-induced apoptosis of neurons and oligodendrocytes in the fetal rhesus macaque brain. Anesthesiology 2014;120:626–638. [DOI] [PMC free article] [PubMed] [Google Scholar]
- 11.Noguchi KK, Johnson SA, Kristick LE, et al. Lithium protects against anaesthesia neurotoxicity in the infant primate brain. Sci Rep 2016;6:22427. [DOI] [PMC free article] [PubMed] [Google Scholar]
- 12.Noguchi KK, Johnson SA, Dissen GA, et al. Isoflurane exposure for three hours triggers apoptotic cell death in neonatal macaque brain. Br J Anaesth 2017;119:524–531. [DOI] [PMC free article] [PubMed] [Google Scholar]
- 13.Schenning KJ, Noguchi KK, Martin LD, et al. Isoflurane exposure leads to apoptosis of neurons and oligodendrocytes in 20- and 40-day old rhesus macaques. Neurotoxicol Teratol 2017;60:63–68. [DOI] [PMC free article] [PubMed] [Google Scholar]
- 14.Noguchi KK, Johnson SA, Manzella FM, et al. Caffeine augments anesthesia neurotoxicity in the fetal macaque brain. Sci Rep 2018;8:5302. [DOI] [PMC free article] [PubMed] [Google Scholar]
- 15.Istaphanous GK, Howard J, Nan X, et al. Comparison of the neuroapoptotic properties of equipotent anesthetic concentrations of desflurane, isoflurane, or sevoflurane in neonatal mice. Anesthesiol 2011;114:578–587. [DOI] [PubMed] [Google Scholar]
- 16.Tunis A, Czarnota GJ, Giles A, Sherar MD, Hunt JW, Kolios MC. Monitoring structural changes in cells with high-frequency ultrasound signal statistics. Ultrasound Med Biol 2005;31:1041–1049. [DOI] [PubMed] [Google Scholar]
- 17.Sadeghi-Naini A, Falou O, Tadayyon H, et al. Conventional frequency ultrasonic biomarkers of cancer treatment response in vivo. Transl Oncol 2013;6:234–IN2. [DOI] [PMC free article] [PubMed] [Google Scholar]
- 18.Insana MF, Wagner RF, Brown DG, Hall TJ. Describing small-scale structure in random media using pulse-echo ultrasound. J Acoust Soc Am 1990;87:179–192. [DOI] [PMC free article] [PubMed] [Google Scholar]
- 19.Guerrero QW, Rosado-Mendez IM, Drehfal LC, Felovich H, Hall TJ. Quantifying backscatter anisotropy using the reference phantom method. IEEE Trans. Ultrason Ferroelect Freq Control 2017;64:1063–1077. [DOI] [PMC free article] [PubMed] [Google Scholar]
- 20.Czarnota GJ, Kolios MC, Vaziri H, et al. Ultrasonic biomicroscopy of viable, dead and apoptotic cells. Ultrasound Med Biol 1007;23:961–965. [DOI] [PubMed] [Google Scholar]
- 21.Czarnota GJ, Kolios MC, Abraham J, et al. Ultrasound imaging of apoptosis: high-resolution non-invasive monitoring of programmed cell death in vitro, in situ and in vivo. Br J Cancer 1999;81:520–527. [DOI] [PMC free article] [PubMed] [Google Scholar]
- 22.Vlad RM, Alajez NM, Giles A, Kolios MC, Czarnota GJ. Quantitative ultrasound characterization of cancer radiotherapy effects in vitro. Int J Radiat Oncol Biol Phys 2008;72:1236–1243. [DOI] [PubMed] [Google Scholar]
- 23.Vlad RM, Czarnota GJ, Giles A, Sherar MD, Hunt JW, Kolios MC. High-frequency ultrasound for monitoring changes in liver tissue during preservation. Phys Med Biol 2004;50:197–213. [DOI] [PubMed] [Google Scholar]
- 24.Blum A, Schlagenhauff B, Stroebel W, Breuninger H, Rassner G, Garbe C. Ultrasound examination of regional lymph nodes significantly improves early detection of locoregional metastases during the follow-up of patients with cutaneous melanoma. Cancer 2000;88: 2534–2539. [DOI] [PubMed] [Google Scholar]
- 25.Chollet P, Charrier S, Brain E, et al. Clinical and pathological response to primary chemotherapy in operable breast cancer. Eur J Cancer 1997;33:862–866. [DOI] [PubMed] [Google Scholar]
- 26.Lizzi FL, Ostromogilsky M, Feleppa EJ, Rorke MC, Yaremko MM. Relationship of ultrasonic spectral parameters to features of tissue microstructure. IEEE Trans Ultrason Ferroelectr Freq Control 1987;34:319–329. [DOI] [PubMed] [Google Scholar]
- 27.Lizzi FL, King DL, Rorke MC, et al. Comparison of theoretical scattering results and ultrasonic data from clinical liver examinations. Ultrasound Med Biol 1988;14:377–385. [DOI] [PubMed] [Google Scholar]
- 28.Insana M, Garra BS, Rosenthal SJ, Hall TJ. Quantitative Ultrasonography. Med Prog Technol 1989;15:141–153. [PubMed] [Google Scholar]
- 29.Insana M, Hall T. Characterizing The Microstructure Of Random-Media Using Ultrasound. Physics Med Biol 1990;35:1373–1386. [DOI] [PubMed] [Google Scholar]
- 30.Insana MF, Hall TJ, Fishback JL. Identifying acoustic scattering sources in normal renal parenchyma from the anisotropy in acoustic properties. Ultrasound Med Biol 1991;17:613–626. [DOI] [PubMed] [Google Scholar]
- 31.Insana MF, Wood JG, Hall TJ. Identifying acoustic scattering sources in normal renal parenchyma in vitro by varying arterial and ureteral pressures. Ultrasound Med Biol 1992;18:587–599. [DOI] [PubMed] [Google Scholar]
- 32.Hall CS, Scott MJ, Lanza GM, Miller JG, Wickline SA. The extracellular matrix is an important source of ultrasound backscatter from myocardium. J Acous Soc Am 2000;107: 612–619. [DOI] [PubMed] [Google Scholar]
- 33.Feleppa EJ, Mamou J, Porter CR, Machi J. Quantitative ultrasound in cancer imaging. Sem Oncol 2011;38:136–150. [DOI] [PMC free article] [PubMed] [Google Scholar]
- 34.Brunke SS, Insana MF, Dahl JJ, Hansen C, Ashfaq M, Ermert H. An ultrasound research interface for a clinical system. IEEE Trans Ultrason Ferroelectr Freq Control 2007; 54:198–210. [DOI] [PubMed] [Google Scholar]
- 35.Chaturvedi P, Insana MF. Error bounds on ultrasonic scatterer size estimates. J Acoust Soc Am 1996;100:392–399. [DOI] [PubMed] [Google Scholar]
- 36.Perciva DB, Walden AT. Spectral analysis for physical applications. Cambridge: University press, 1993. [Google Scholar]
- 37.Rosado-Mendez IM, Nam K, Hall TJ, Zagzebski JA. Task-oriented comparison of power spectral density estimation methods for quantifying acoustic attenuation in diagnostic ultrasound using a reference phantom method. Ultrason Imaging 2013;35:214–234. [DOI] [PMC free article] [PubMed] [Google Scholar]
- 38.Yao LX, Zagzebski JA, Madsen EL. Backscatter coefficient measurements using a reference phantom to extract depth-dependent instrumentation factors. Ultrason Imaging 1990;12:58–70. [DOI] [PubMed] [Google Scholar]
- 39.Kremkau FW, Barnes RW, McGraw CP. Ultrasonic attenuation and propagation speed in normal human brain. J Acous Soc Am 1981;70:29–38. [Google Scholar]
- 40.Hall TJ, Insana MF, Harrison LA, Cox GG. Ultrasonic measurement of glomerular diameters in normal adult humans. Ultrasound Med Biol 1996;22:987–997. [DOI] [PubMed] [Google Scholar]
- 41.Anderson JJ, Herd MT, Kind MR et al. Interlaboratory comparison of backscatter coefficient estimates for tissue mimicking phantoms. Ultrason Imaging 2010;32:48–64. [DOI] [PMC free article] [PubMed] [Google Scholar]
- 42.Nam K, Rosado-Mendez IM, Witzfeld LA, et al. Cross imaging system comparison of backscatter coefficient estimates from a tissue-mimicking material. J Acous Soc Am 2012;132:1319–1324. [DOI] [PMC free article] [PubMed] [Google Scholar]
- 43.Mai JK, Forutan F. The Thalamus, in The human nervous system, Mai JK, Paxinos G, eds. Academic Press; 2011, pp. 618–677. [Google Scholar]
- 44.Scott BH, Saleem KS, Kikuchi Y, Fukushima M, Mishkin M, Saunders RC Thalamic connections of the core auditory cortex and rostral supratemporal plane in the macaque monkey, J Comp Neurol 2017;525:3488–3513. [DOI] [PMC free article] [PubMed] [Google Scholar]
- 45.Cappe C, Morel A, Barone P, Rouiller EM The thalamocortical projection systems in primate: an anatomical support for multisensory and sensorimotor interplay. Cerebral cortex 2009; 19:2025–2037. [DOI] [PMC free article] [PubMed] [Google Scholar]
- 46.Rosado-Mendez IM, Nam K, Hall TJ, Zagzebski JA. Task-oriented comparison of power spectral density estimation methods for quantifying acoustic attenuation in diagnostic ultrasound using a reference phantom method. Ultrasonic Imaging 2013;35:214–34. [DOI] [PMC free article] [PubMed] [Google Scholar]
- 47.Tadayyon H, Sannachi L, Sadeghi-Naini A, et al. Quantification of ultrasonic scattering properties of in vivo tumor cell death in mouse models of breast cancer. Transl Oncology 2015;8:463–473. [DOI] [PMC free article] [PubMed] [Google Scholar]
- 48.Sannachi L, Tadayyon H, Sadeghi-Naini A, et al. Non-invasive evaluation of breast cancer response to chemotherapy using quantitative ultrasonic backscatter parameters. Medical image analysis 2015;20:224–236. [DOI] [PubMed] [Google Scholar]
- 49.DiMaggio C, Sun LS, Kakavouli A, Byrne MW, Li G. A retrospective cohort study of the association of anesthesia and hernia repair surgery with behavioral and developmental disorders in young children. J Neurosurg Anesth 2009;21:286–291. [DOI] [PMC free article] [PubMed] [Google Scholar]
- 50.DiMaggio C, Sun LS, Li G. Early childhood exposure to anesthesia and risk of developmental and behavioral disorders in a sibling birth cohort. Anesth Analg 2011; 113: 1143–1151. [DOI] [PMC free article] [PubMed] [Google Scholar]
- 51.Wilder RT, Flick RP, Sprung J, et al. Early exposure to anesthesia and learning disabilities in a population-based birth cohort. Anesthesiology 2009;110:796–804. [DOI] [PMC free article] [PubMed] [Google Scholar]
- 52.Flick RP, Katusic SK, Colligan RC, et al. Cognitive and behavioral outcomes after early exposure to anesthesia and surgery. Pediatrics 2011; 128:e1053–1061. [DOI] [PMC free article] [PubMed] [Google Scholar]
- 53.Sprung J, Flick RP, Katusic SK, et al. Attention-deficit/hyperactivity disorder after early exposure to procedures requiring general anesthesia. Mayo Clin Proc 2012;87:120–129. [DOI] [PMC free article] [PubMed] [Google Scholar]
- 54.Farwell JR, Lee YJ, Hirtz DG, Sulzbacher SI, Ellenberg JH, Nelson KB. Phenobarbital for febrile seizures: effects on intelligence and on seizure recurrence. N Engl J Med 1990;322: 364–369. [DOI] [PubMed] [Google Scholar]
- 55.Meador KJ, Baker GA, Browning N, et al. Cognitive function at 3 years of age after fetal exposure to antiepileptic drugs. N Engl J Med 2009; 360:1597–1605. [DOI] [PMC free article] [PubMed] [Google Scholar]
- 56.Meador K, Baker GA, Browning N, et al. Effects of fetal antiepileptic drug exposure outcomes at age 4.5 years. Neurology 2012;78:1207–1214. [DOI] [PMC free article] [PubMed] [Google Scholar]
- 57.Rappaport B, Mellon RD, Simone A, Woodcock J. Defining safe use of anesthesia in children. N Engl J Med 2011;364:1387–1390. [DOI] [PubMed] [Google Scholar]
- 58.Sun LS, Li G, Miller TL, et al. Association between a single general anesthesia exposure before age 36 months and neurocognitive outcomes in later childhood. JAMA 2016;315: 2312–2320. [DOI] [PMC free article] [PubMed] [Google Scholar]
- 59.Davidson AJ, Disma N, de Graaff JC, et al. Neurodevelopmental outcome at 2 years of age after general anaesthesia and awake-regional anaesthesia in infancy (GAS): an international multicenter, randomized controlled trial. Lancet 2016;387:239–250. [DOI] [PMC free article] [PubMed] [Google Scholar]