

Abstract
Objective:
The Centers for Medicare and Medicaid Services (CMS) requires hospitals to report compliance with a sepsis treatment bundle as part of its Inpatient Quality Reporting Program (IQRP). We used recently released data from this program to characterize national performance on the sepsis measure, known as SEP-1.
Design:
Cross-sectional study of United States hospitals participating in the CMS Hospital IQRP linked to CMS’s Healthcare Cost Reporting Information System (HCRIS).
Setting:
General, short-stay, acute-care hospitals in the United States.
Measurements and Main Results:
We examined the hospital factors associated with reporting SEP-1 data, the hospital factors associated with performance on the SEP-1 measure, and the relationship between SEP-1 performance and performance on other quality measures related to time-sensitive medical conditions. A total of 3,283 hospitals were eligible for the analysis, of which 2,851 (86.8%) reported SEP-1 performance data. SEP-1 reporting was more common in larger, nonprofit hospitals. The most common reason for non-reporting was an inadequate case volume. Among hospitals reporting SEP-1 performance data, overall bundle compliance was generally low, but it varied widely across hospitals (mean and standard deviation: 48.9% ± 19.4%). Compared to hospitals with worse SEP-1 performance, hospitals with better SEP-1 performance tended to be smaller, for-profit, non-teaching, and with intermediate-sized ICUs. Better hospital performance on SEP-1 was associated with higher rates of timely head CT interpretation for stroke patients (rho=0.16, p<0.001), more frequent aspirin administration for patients with chest pain or heart attacks (rho=0.24, p<0.001), and shorter median time to EKG for patients with chest pain (rho=−0.12, p<0.001).
Conclusions:
The majority of eligible hospitals reported SEP-1 data, and overall bundle compliance was highly variable. SEP-1 performance was associated with structural hospital characteristics and performance on other measures of hospital quality, providing preliminary support for SEP-1 performance as a marker of timely hospital sepsis care.
Keywords: sepsis, health policy, healthcare quality indicators, critical care, Medicare, health services research
INTRODUCTION
Sepsis is a common cause of morbidity and mortality, affecting over 1.5 million individuals annually in the United States alone (1). Among hospitalized patients, sepsis is the leading cause of death (2). Beyond the human toll of morbidity and mortality, sepsis imposes substantial financial costs, accounting for over $20 billion in annual US hospital spending (3). Identifying and treating sepsis early in its course can reduce sepsis-related morbidity and mortality, but many patients with sepsis do not receive early and potentially life-saving therapy (4–7).
One approach to improve the early recognition and treatment of sepsis across the health system is to use regulatory mandates for sepsis care (8). In New York State, where hospitals are required to report their compliance with guideline-based sepsis treatment bundles, adherence to these bundles is associated with lower sepsis mortality (4). At the federal level, the Centers for Medicare and Medicaid Services (CMS) instituted a sepsis quality measure as part of its Hospital Inpatient Quality Reporting Program (IQRP) in October 2015 (9). This program, known as SEP-1, requires hospitals to report their compliance with a multicomponent 3- and 6-hour treatment and resuscitation bundle for patients with sepsis, which includes antibiotic and fluid administration, blood culture and lactate measurement, the use of vasopressors for fluid-refractory hypotension, and the bedside evaluation of a patient’s response to treatment.
Although there is consensus on the importance of sepsis-focused quality improvement in general, the SEP-1 reporting program itself has generated considerable controversy related to the administrative burden of data abstraction and reporting, the potential to result in financial penalties for hospitals, and concerns about the program’s ultimate impact on patient care and outcomes (10–15). We sought to inform this debate by evaluating national reporting patterns from the first year of the program. Specifically, we sought to answer three questions critical to understanding the SEP-1 program: 1) what characteristics are associated with whether a hospital reports SEP-1 data, 2) what hospital characteristics are associated with SEP-1 performance among reporting hospitals, and 3) is SEP-1 performance associated with hospital performance on other quality measures related to time-sensitive health care?
MATERIALS AND METHODS
Study design and data
We performed a cross-sectional study of US hospitals participating in Medicare’s IQRP, which is a requirement for all non-federal hospitals that provide care for Medicare beneficiaries. IQRP data, including data from the SEP-1 reporting program, were obtained from CMS’s Hospital Compare website, which publicly reports performance data for participating hospitals. Hospital organizational data, including hospital size, ownership, and academic status, were obtained from Medicare’s Healthcare Cost Reporting Information System (HCRIS). Hospital Compare and HCRIS were linked using unique hospital identifiers. The Hospital Compare data were from the fiscal year 2017 reporting period, running from October 1, 2016 to September 30, 2017. We used HCRIS data from 2016, the most recent year that reliable data are available. We restricted the analysis to general, short-stay, acute-care hospitals, because these are the hospitals to which the SEP-1 program applies. We excluded all other hospitals including critical access hospitals, long-term acute care hospitals, and specialty hospitals. We also excluded hospitals with data in the Hospital Compare dataset but not the HCRIS dataset.
Variables
Using the Hospital Compare and HCRIS data sets we identified four sets of variables: (a) whether a hospital reported SEP-1 data; (b) SEP-1 performance; (c) general hospital characteristics; and (d) performance on other quality measures related to time-sensitive medical conditions.
SEP-1 reporting
We used the Hospital Compare data to identify whether a hospital reported any SEP-1 compliance data. For hospitals that did not report SEP-1 data, we used text fields in the Hospital Compare data to identify the reasons cited for not reporting.
SEP-1 performance
The Hospital Compare data contain the percent compliance with the SEP-1 bundle among eligible patients, as reported by hospitals. Since the SEP-1 measure is an “all-or-none” measure, this is the percentage of patients with severe sepsis or septic shock who received every required element of the SEP-1 bundle. We also identified the number of SEP-1 cases each hospital reported to CMS, which is included in the Hospital Compare data. This reported case volume does not necessarily represent total annual sepsis case volume for each hospital, because the SEP-1 measure excludes patients transferred from other hospitals, and it allows hospitals with very high case volumes to report data on a subsample of patients (i.e. 60 per quarter).
General hospital characteristics
Using 2016 HCRIS data, we categorized hospitals according to ownership (nonprofit, for-profit, government), teaching status using the resident-to-bed ratio (nonteaching if no residents, small teaching if ratio <0.2, large teaching if ratio 0.2 or greater), hospital bed totals (small less than 100 beds, medium 100 to 249 beds, and large 250 beds or more), and intensive care unit (ICU) bed totals (0 beds, less than 5 beds, 5–14 beds, 15–29 beds, and 30 or more beds), as performed previously (16, 17).
Performance for other time-sensitive conditions
We used Hospital Compare data to assess hospital performance on other core measures related to time-sensitive conditions. We focused our analyses on quality measures from the “Timely and Effective Care” domain, which includes SEP-1. In addition to SEP-1, we included three other “Timely and Effective Care” measures that were reported by hospitals that also reported SEP-1 data and might provide insight into how a hospital performs in treatment of time-sensitive conditions: OP-4, which is the proportion of patients presenting with chest pain and acute myocardial infarction (AMI) who receive aspirin in the ED; OP-20, which is the proportion of patients with stroke or intracranial hemorrhage for whom the interpretation of a head CT scan is available within 45 minutes of ED arrival; and OP-5, which is the median time to obtaining an EKG for ED patients with chest pain or myocardial infarction. We hypothesized these measures to reflect a hospital’s underlying quality of care for time-sensitive conditions. To the degree that SEP-1 performance also reflects the quality of care for time-sensitive conditions, it should correlate with these measures.
Analysis
To understand the hospital-factors associated with SEP-1 reporting, we compared characteristics of hospitals that reported SEP-1 data to those that did not, using chi-square statistics. We also summarized the frequency of different reasons cited for not reporting data.
To understand variation in SEP-1 performance, we first dropped hospitals that did not report on SEP-1. Among the remaining hospitals, we calculated the mean and standard deviation of the reported SEP-1 performance rates. To visually illustrate the variation in SEP-1 performance, we created a caterpillar plot of the reported SEP-1 performance rates. We calculated the 95% confidence intervals for these rates using binomial standard errors.
To understand the association between hospital characteristics and SEP-1 performance, we performed a series of linear regression models, with SEP-1 performance as the dependent variable and categorical hospital characteristics as independent variables. We first fit univariable models with each of several categorical variable: categorized reported SEP-1 case volume, hospital ownership, teaching status, hospital size, and ICU size. Next, to understand which characteristics were independently associated with SEP-1 performance, we fit a multivariable linear regression model with all hospital characteristic variables. Using this multivariable model and STATA’s postestimation margins command, which generates population-averaged estimates, we created graphs illustrating the relationship between adjusted SEP-1 performance and reported SEP-1 case volume, hospital ownership, and hospital size.
Finally, we evaluated whether hospital performance on SEP-1 was associated with performance on other measures of timely and effective care—timely head CT interpretation in stroke, and aspirin administration and time to EKG for patients with chest pain or AMI. We first excluded hospitals with performance on these measures above the 99th percentile or below the 1st percentile to improve the visual interpretability of the comparisons. We then calculated Spearman’s rank correlation coefficient (ρ) for pairwise comparisons between SEP-1 performance and each of the other performance measures. Because not all hospitals reported on all measures, the number of hospitals varied across these pairwise comparisons. To visually represent each comparison, we created scatterplots with lines of best fit.
We conducted all analyses using STATA version 15.1 (StataCorp, College Station, TX). We defined statistically significant associations using a p-value of <0.05. This research was reviewed by the University of Pittsburgh Human Research Protection Office and determined not to constitute human subjects research because it used only publicly available hospital-level data.
RESULTS
A total of 3,283 general, short-stay, acute-care hospitals participated in IQRP and could be linked to HCRIS data. Of these hospitals, 2,851 (86.8%) reported SEP-1 performance data in Hospital Compare (Table 1). Compared to hospitals that did not report, hospitals reporting SEP-1 data were more likely to be large, nonprofit, teaching institutions. The most common reason for not reporting SEP-1 data was that there were no eligible cases or too few eligible cases to report (366 hospitals, 11% of total). A small minority of hospitals (66 hospitals, 2% of total) cited no reason or other reasons for not reporting SEP-1.
Table 1.
Prevalence of SEP-1 reporting among eligible United States hospitals
| Hospital characteristic | N | Reported | Did not report |
|---|---|---|---|
| All hospitals | 3283 | 2851 (86.8%) | 432 (13.2%) |
| By hospital type* | |||
| Ownership | |||
| Nonprofit | 1931 | 1821 (94.3%) | 110 (5.7%) |
| For-profit | 804 | 621 (77.2%) | 183 (22.8%) |
| Government | 548 | 409 (74.6%) | 139 (25.4%) |
| Teaching status | |||
| Non-teaching | 2147 | 1752 (81.6%) | 395 (18.4%) |
| Small teaching | 703 | 685 (97.4%) | 18 (2.6%) |
| Large teaching | 433 | 414 (95.6%) | 19 (4.4%) |
| Total bed count | |||
| <100 beds | 1221 | 836 (68.5%) | 385 (31.5%) |
| 100-250 beds | 1194 | 1152 (96.5%) | 42 (3.5%) |
| >250 beds | 868 | 863 (99.4%) | 5 (0.6%) |
| ICU bed count | |||
| 0 ICU beds | 463 | 129 (27.9%) | 334 (72.1%) |
| <5 ICU beds | 120 | 91 (75.8%) | 29 (24.2%) |
| 5-14 ICU beds | 1028 | 981 (95.4%) | 47 (4.6%) |
| 15-29 ICU beds | 604 | 593 (98.2%) | 11 (1.8%) |
| ≥30 ICU beds | 1068 | 1057 (99.0%) | 11 (1.0%) |
Data are reported as frequencies and row percentages
ICU = Intensive Care Unit
p<0.001 for comparisons of hospital characteristics of reporting vs. non-reporting hospitals, for all examined hospital characteristics
Among hospitals reporting SEP-1 data, SEP-1 performance was highly variable, with a mean of 48.9 ± 19.4 % bundle compliance and a range from 0 to 100% (Figure 1). The median number of patients per hospital was 87 (range 11 – 1117; interquartile range 59 – 133).
Figure 1.
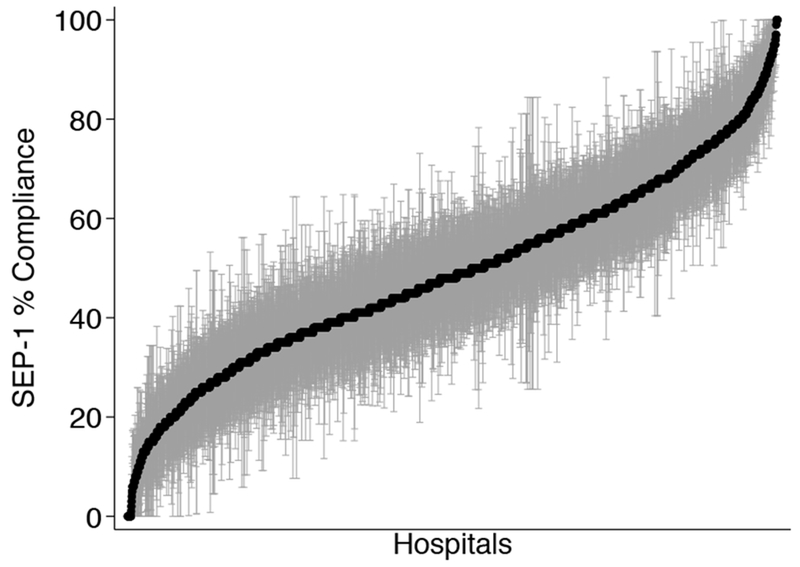
Distribution of SEP-1 bundle compliance across hospitals. Black dots are point estimates as reported in the Hospital Compare data. Grey bars represent 95% confidence intervals from a binomial distribution.
Table 2 displays the results of linear regression models analyzing SEP-1 performance and hospital characteristics. In pairwise single predictor variable models, higher SEP-1 performance was associated with larger reported SEP-1 case volumes, for-profit ownership, non-teaching status, smaller hospital size, and intermediate ICU size. In the multivariable model, case volume, hospital ownership, and hospital size were most strongly associated with SEP-1 performance. Figure 2 depicts the relationship between selected hospital characteristics and SEP-1 performance, adjusted for the other hospital characteristics in the model from Table 2.
Table 2.
Univariable and multivariable associations between hospital characteristics and level of SEP-1 performance (N=2851 hospitals).
| Bivariable models | Multivariable models | |||||
|---|---|---|---|---|---|---|
| β* | 95% CI | P-value | β* | 95% CI | P-value | |
| Reported SEP-1 case volume | ||||||
| 11-25 | Ref | -- | Ref | -- | ||
| 26-50 | 6.39 | 2.78 – 9.99 | 0.001 | 6.03 | 2.42 – 9.64 | 0.001 |
| 51-75 | 8.19 | 4.86 – 11.53 | <0.001 | 9.36 | 5.88 – 12.84 | <0.001 |
| 76-100 | 6.68 | 3.29 – 10.08 | <0.001 | 9.35 | 5.72 – 12.97 | <0.001 |
| 101-150 | 5.85 | 2.48 – 9.22 | 0.001 | 9.03 | 5.36 – 12.69 | <0.001 |
| 151-200 | 5.20 | 1.27 – 9.13 | 0.01 | 8.26 | 4.12 – 12.41 | <0.001 |
| >200 | 5.9 | 2.39 – 9.54 | 0.001 | 9.98 | 6.10 – 13.87 | <0.001 |
| Hospital ownership | ||||||
| Nonprofit | Ref | -- | Ref | -- | ||
| For-profit | 8.81 | 7.08 – 10.53 | <0.001 | 8.81 | 7.06 – 10.55 | <0.001 |
| Government | −2.53 | −4.56 – −0.49 | 0.02 | −1.91 | −3.96 – 0.14 | 0.07 |
| Teaching status | ||||||
| Non-teaching | Ref | -- | Ref | -- | ||
| Small teaching | −1.17 | −2.87 – 0.53 | 0.18 | 0.66 | −1.20 – 2.52 | 0.48 |
| Large teaching | −5.77 | −7.83 – −3.70 | <0.001 | −2.44 | −4.71 – −0.16 | 0.04 |
| Hospital size | ||||||
| <100 beds | Ref | -- | Ref | -- | ||
| 100-250 beds | −1.28 | −3.00 – 0.43 | 0.14 | −3.85 | −6.03 – 1.67 | 0.001 |
| >250 beds | −4.57 | −6.40 – −2.73 | <0.001 | −4.64 | −7.72 – 1.56 | 0.003 |
| ICU size | ||||||
| 0 ICU beds | Ref | -- | Ref | -- | ||
| <5 ICU beds | 3.40 | −1.77 – 8.56 | 0.20 | 1.56 | −3.49 – 6.60 | 0.55 |
| 5-14 ICU beds | 6.19 | 2.66 – 9.73 | 0.001 | 3.31 | −0.33 – 6.95 | 0.08 |
| 15-29 ICU beds | 5.27 | 1.60 – 8.94 | 0.005 | 3.07 | −1.07 – 7.21 | 0.15 |
| >=30 ICU beds | 1.61 | −1.19 – 5.13 | 0.37 | 1.11 | −3.27 – 5.50 | 0.62 |
ICU = intensive care unit; ED = emergency department
Beta coefficients are interpreted as the relative difference in percent compliance between the given category and referent category.
Figure 2.
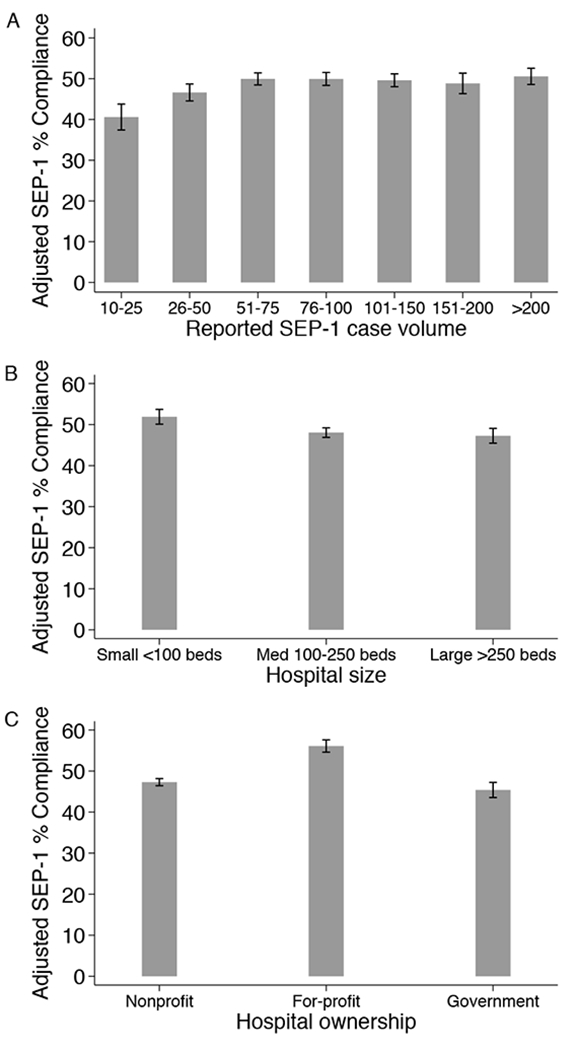
Association between adjusted SEP-1 performance and hospital characteristics. Better SEP-1 performance, as measured by percent bundle compliance, was associated with higher reported SEP-1 case volumes (Panel A), smaller hospital size (Panel B), and for-profit hospital ownership (Panel C). Adjusted SEP-1 performance was predicted from multivariable model including reported SEP-1 case volume, hospital size, ownership, teaching status, and ICU size, using postestimation margins.
Performance on SEP-1 was statistically significantly associated with all four three timely and effective care measures (Figure 3). Higher rates of SEP-1 bundle compliance were associated with higher rates of timely head CT interpretation for stroke patients (ρ=0.16, p<0.001, 1365 hospitals), more frequent aspirin administration for patients with chest pain or AMI (ρ=0.24, p<0.001, 1771 hospitals), and shorter median time to EKG for patients with chest pain or AMI (ρ=−0.12, p<0.001, 1794 hospitals).
Figure 3.

Association between unadjusted SEP-1 performance and hospital performance on other quality measures from Hospital Compare’s Timely and Effective Care domain. Higher rates of SEP-1 compliance were observed in hospitals with higher rates of rapid head CT interpretation for patients with stroke (Panel A, ρ=0.16, p<0.001, 1365 hospitals), higher rates of aspirin administration to patients with chest pain or acute myocardial infarction (Panel B, ρ=0.24, p<0.001, 1771 hospitals), and shorter median time to initial EKG for patients with chest pain or acute myocardial infarction (Panel C, ρ=−0.12, p<0.001, 1794 hospitals).
DISCUSSION
In a national study of hospital-level SEP-1 reporting and performance, we found that the vast majority of eligible hospitals reported SEP-1 data. Among hospitals reporting SEP-1 data, the average SEP-1 bundle compliance rate was only around 50%, confirming prior work demonstrating that many patients may not be receiving care consistent with current sepsis guidelines (7, 18, 19). In addition, performance varied widely across hospitals, with smaller, for-profit, non-teaching hospitals reporting higher SEP-1 bundle completion rates, as did hospitals caring for greater numbers of patients with sepsis.
The finding that nearly all eligible hospitals reported SEP-1 data is reassuring, since SEP-1 reporting requires a major financial and organizational investment (10, 12). Despite these costs, it appears that the vast majority of hospitals were able to successfully collect and report SEP-1 data. This finding suggests that the SEP-1 measure will not force large numbers of hospitals to face financial penalties for non-reporting, at least so long as SEP-1 remains only a “pay-for-reporting” measure rather than a “pay-for-performance” measure. At the same time, the opportunity costs of investments in data reporting may impose indirect effects even when hospitals do not receive financial penalties for nonreporting. Future work should be devoted to developing and testing ways to reduce the burden of SEP-1 data collection and reporting, perhaps through the development of tools in the electronic health record.
Our finding that SEP-1 bundle compliance was higher in smaller, for-profit hospitals provides preliminary insight to the organizational determinants of variation in sepsis performance. One possible explanation for these findings is variation in case-mix. Sepsis case-mix differs across hospitals (1), and the increased complexity of the SEP-1 bundle for patients with septic shock may drive lower compliance in hospitals with a greater proportion of patients in shock (20). In addition, patients with comorbid cardiac or renal disease may be less likely to receive fluid volumes consistent with the SEP-1 bundle (21). Greater concentrations of patients with more severe sepsis or comorbid illnesses in larger, nonprofit hospitals could contribute to our findings.
Another consideration is that EDs at smaller, for-profit hospitals may be less crowded, facilitating earlier identification and treatment of patients with sepsis and other time-sensitive conditions (22–24). This explanation would be consistent with our observation that better SEP-1 performance is associated with other measures of hospitals’ ability to provide time-sensitive care. A prior study of sepsis resuscitation bundles also identified smaller hospitals as providing more bundle-compliant care (4). Ultimately, understanding the mechanisms by which some hospitals achieve more rapid sepsis identification and treatment is a prerequisite to expanding these strategies to other hospitals, which would improve sepsis care and outcomes broadly.
Our findings provide some mechanistic insight into known volume-outcome relationships and point to time-sensitive care processes as potential targets for quality improvement. Previous studies consistently report a volume-outcome relationship in sepsis, whereby patients admitted to hospitals caring for higher volumes of patients with sepsis experience greater survival (25). We found that SEP-1 compliance was lowest in hospitals with very low case volumes, but that the effect of higher case volumes leveled off at around 75 annual reported cases. The absence of a consistent volume-performance relationship at higher case volumes may reflect the fact that the SEP-1 program excludes patients transferred between hospitals, for whom care may differ from those directly admitted (26), and allows hospitals with very high case volumes to report data on a subsample of patients. Nevertheless, our findings support a conceptual model of the sepsis volume-outcome relationship in which worse outcomes at the lowest-volume hospitals are explained in part by less timely sepsis care at these hospitals. Under this model of the volume-outcome relationship, SEP-1 bundle compliance is at least a marker, if not the defining feature, of timely sepsis care. Understanding which strategies allow higher-volume hospitals to excel at delivering time-sensitive care, so that these practices can be disseminated to lower-volume hospitals, could thereby improve sepsis care across the health system.
These results support the overall value of the SEP-1 measure by providing additional construct validity (27). Specifically, our analysis demonstrates that performance on the SEP-1 measure tracks with multiple other established measures of quality for time-sensitive conditions, as would be expected if hospital quality for time-sensitive conditions is related to shared factors related to timely and effective emergency care. Examples of such factors may be an organizational commitment to communication and coordination among care groups (28) or the use of written protocols for recognition and treatment of acute illness (29). There is a robust body of evidence demonstrating that early identification and treatment of sepsis saves lives (4, 5). Our findings suggest that hospitals that comply with the SEP-1 bundle also implement time-sensitive diagnostic and treatment processes for other emergency medical conditions.
Our study has several limitations. First, SEP-1 compliance and other process data are self-reported and have not undergone external audit, creating the potential for inaccuracies. For example, variability between data abstractors in their approach to defining sepsis “time zero” relative to the bundle components could lead to better SEP-1 performance (30); if this were to occur systematically in smaller, for-profit hospitals, it could contribute to our findings. This vulnerability is particularly challenging given the complex measure specification and concerns over the challenge of resolving different clinical definitions of sepsis (10).
Second, we analyzed only overall SEP-1 performance, and it is possible that the reasons for SEP-1 failure differed across hospitals. A hospital with low SEP-1 performance due to a lack of documentation, which is not inherently linked to patient outcomes, likely differs from a hospital with low SEP-1 performance due to widespread delays in antibiotic administration, which correlates strongly with higher sepsis mortality (4, 5). SEP-1 is collected and reported as an “all-or-none” measure, which necessarily limits the ability of hospitals and investigators to use the data to understand the mechanisms behind low and high performance. While some hospitals track the individual components of SEP-1 performance, not all hospitals have the resources to do so (10). Many have argued to allow hospitals more flexibility to focus on aspects of care that are most tightly linked to better patient-centered outcomes (10, 15, 20). Indeed, since the original release of SEP-1, CMS simplified the component required for the reassessment of a patient’s response to therapy, which may allow hospitals to concentrate their efforts beyond documentation. Ongoing changes to the SEP-1 reporting requirements that yield more granular insight into reasons for success or failure and increase the flexibility of the measure might facilitate both process improvement and research insights across the health system.
Finally, while our results provide evidence supporting construct validity of the SEP-1 measure in general, its impact on patient outcomes remains uncertain. The overall magnitude of the associations between SEP-1 and other performance measures was weak, tempering the strength of our conclusions. The evidence base for sepsis diagnosis and treatment is dynamic, and all quality measures should incorporate ongoing evidence as it accumulates. Perhaps more importantly, protocolized sepsis bundles do not improve outcomes in randomized trials—and in fact may incur excess costs (31). We therefore need to understand how SEP-1 implementation has affected outcomes of patients with and without sepsis, including intended benefits like earlier sepsis recognition and treatment, and unintended harms such as excessive fluid administration or adverse effects of the widespread application of broad-spectrum antibiotics across the health system.
CONCLUSIONS
In a national study of US hospitals’ SEP-1 reporting and performance, we found that the primary reason for nonreporting was an inadequate case volume, and that SEP-1 performance was higher in smaller, for-profit hospitals and in those with higher case volumes. SEP-1 performance was also associated with other ED-based process measures for time-sensitive care, providing a preliminary signal that compliance with the SEP-1 bundle is a marker of a hospital’s ability to deliver timely sepsis care. Future work will need to evaluate the link between these hospital-level observations and patient-level data on sepsis treatment processes and outcomes associated with the SEP-1 reporting program.
Acknowledgments
Financial Support: Agency for Healthcare Research and Quality (IJB, K08HS025455), National Institutes of Health (JMK, K24HL133444)
REFERENCES
- 1.Rhee C, Dantes R, Epstein L, et al. : Incidence and Trends of Sepsis in US Hospitals Using Clinical vs Claims Data, 2009-2014. JAMA 2017; 318:1241–1249 [DOI] [PMC free article] [PubMed] [Google Scholar]
- 2.Liu V, Escobar GJ, Greene JD, et al. : Hospital deaths in patients with sepsis from 2 independent cohorts. JAMA 2014; 312:90–2 [DOI] [PubMed] [Google Scholar]
- 3.Torio CM, Moore BJ: National Inpatient Hospital Costs: The Most Expensive Conditions by Payer, 2013 Statistical brief No. 204. Healthcare Cost Utilization Project (HCUP). Rockville, MD: Agency for Healthcare Research and Quality; May 2016. [PubMed] [Google Scholar]
- 4.Seymour CW, Gesten F, Prescott HC, et al. : Time to Treatment and Mortality during Mandated Emergency Care for Sepsis. N Engl J Med 2017; 376:2235–2244 [DOI] [PMC free article] [PubMed] [Google Scholar]
- 5.Liu VX, Fielding-Singh V, Greene JD, et al. : The Timing of Early Antibiotics and Hospital Mortality in Sepsis. Am J Respir Crit Care Med 2017; 196:856–863 [DOI] [PMC free article] [PubMed] [Google Scholar]
- 6.Han X, Edelson DP, Snyder A, et al. : Implications of Centers for Medicare & Medicaid Services Severe Sepsis and Septic Shock Early Management Bundle and Initial Lactate Measurement on the Management of Sepsis. Chest 2018; 154:302–308 [DOI] [PMC free article] [PubMed] [Google Scholar]
- 7.Levy MM, Rhodes A, Phillips GS, et al. : Surviving Sepsis Campaign: association between performance metrics and outcomes in a 7.5-year study. Crit Care Med 2015; 43:3–12 [DOI] [PubMed] [Google Scholar]
- 8.Cooke CR, Iwashyna TJ: Sepsis mandates: Improving inpatient care while advancing quality improvement. JAMA 2014; 312:1397–1398 [DOI] [PMC free article] [PubMed] [Google Scholar]
- 9.Centers for Medicare & Medicaid Services; Joint Commission: Specifications manual for national hospital inpatient quality measures [Internet]. [cited 2018 Sep 10] Available from: https://www.jointcommission.org/specifications_manual_for_national_hospital_inpatient_quality_measures.aspx
- 10.Barbash IJ, Rak KJ, Kuza CC, et al. : Hospital Perceptions of Medicare’s Sepsis Quality Reporting Initiative. J Hosp Med 2017; 12:963–968 [DOI] [PMC free article] [PubMed] [Google Scholar]
- 11.Barbash IJ, Kahn JM, Thompson BT: Medicare’s Sepsis Reporting Program: Two Steps Forward, One Step Back. Am J Respir Crit Care Med 2016; 194:139–141 [DOI] [PMC free article] [PubMed] [Google Scholar]
- 12.Wall MJ, Howell MD: Variation and Cost-effectiveness of Quality Measurement Programs. The Case of Sepsis Bundles. Ann Am Thorac Soc 2015; 12:1597–9 [DOI] [PubMed] [Google Scholar]
- 13.Pepper DJ, Jaswal D, Sun J, et al. : Evidence Underpinning the Centers for Medicare & Medicaid Services’ Severe Sepsis and Septic Shock Management Bundle (SEP-1). Ann Intern Med 2018; 168:558–568 [DOI] [PMC free article] [PubMed] [Google Scholar]
- 14.Faust JS, Weingart SD: The Past, Present, and Future of the Centers for Medicare and Medicaid Services Quality Measure SEP-1. Emerg Med Clin North Am 2017; 35:219–231 [DOI] [PubMed] [Google Scholar]
- 15.Klompas M, Rhee C: The CMS Sepsis Mandate: Right Disease, Wrong Measure. Ann Intern Med 2016; 165:517–518 [DOI] [PubMed] [Google Scholar]
- 16.Wallace DJ, Seymour CW, Kahn JM: Hospital-Level Changes in Adult ICU Bed Supply in the United States. Crit Care Med 2017; 45:e67–e76 [DOI] [PMC free article] [PubMed] [Google Scholar]
- 17.Wallace DJ, Angus DC, Seymour CW, et al. : Critical Care Bed Growth in the United States: a Comparison of Regional and National Trends. Am J Respir Crit Care Med 2015; 191:410–6 [DOI] [PMC free article] [PubMed] [Google Scholar]
- 18.Ferrer R, Artigas A, Levy MM, et al. : Improvement in process of care and outcome after a multicenter severe sepsis educational program in Spain. JAMA 2008; 299:2294–303 [DOI] [PubMed] [Google Scholar]
- 19.Levy MM, Dellinger RP, Townsend SR, et al. : The Surviving Sepsis Campaign: results of an international guideline-based performance improvement program targeting severe sepsis. Crit Care Med 2010; 38:367–74 [DOI] [PubMed] [Google Scholar]
- 20.Rhee C, Filbin MR, Massaro AF, et al. : Compliance With the National SEP-1 Quality Measure and Association With Sepsis Outcomes. Crit Care Med 2018; 1 [DOI] [PMC free article] [PubMed] [Google Scholar]
- 21.Liu VX, Morehouse JW, Marelich GP, et al. : Multicenter Implementation of a Treatment Bundle for Patients with Sepsis and Intermediate Lactate Values. Am J Respir Crit Care Med 2016; 193:1264–70 [DOI] [PMC free article] [PubMed] [Google Scholar]
- 22.Pines JM, Decker SL, Hu T: Exogenous Predictors of National Performance Measures for Emergency Department Crowding. Ann Emerg Med 2012; 60:293–298 [DOI] [PubMed] [Google Scholar]
- 23.Mullins PM, Pines JM: National ED crowding and hospital quality: results from the 2013 Hospital Compare data. Am J Emerg Med 2014; 32:634–639 [DOI] [PubMed] [Google Scholar]
- 24.Gaieski DF, Agarwal AK, Mikkelsen ME, et al. : The impact of ED crowding on early interventions and mortality in patients with severe sepsis. Am J Emerg Med 2017; 35:953–960 [DOI] [PubMed] [Google Scholar]
- 25.Walkey AJ, Wiener RS: Hospital Case Volume and Outcomes among Patients Hospitalized with Severe Sepsis. Am J Respir Crit Care Med 2014; 189:548–555 [DOI] [PMC free article] [PubMed] [Google Scholar]
- 26.Barbash IJ, Zhang H, Angus DC, et al. : Differences in Hospital Risk-standardized Mortality Rates for Acute Myocardial Infarction When Assessed Using Transferred and Nontransferred Patients. Med Care 2017; 55:476–482 [DOI] [PMC free article] [PubMed] [Google Scholar]
- 27.Bagozzi RP, Yi Y, Phillips LW: Assessing Construct Validity in Organizational Research. Adm Sci Q 1991; 36:421 [Google Scholar]
- 28.Curry LA, Spatz E, Cherlin E, et al. : What distinguishes top-performing hospitals in acute myocardial infarction mortality rates? A qualitative study. Ann Intern Med 2011; 154:384–90 [DOI] [PMC free article] [PubMed] [Google Scholar]
- 29.Fonarow GC, Smith EE, Saver JL, et al. : Timeliness of Tissue-Type Plasminogen Activator Therapy in Acute Ischemic Stroke: Patient Characteristics, Hospital Factors, and Outcomes Associated With Door-to-Needle Times Within 60 Minutes. Circulation 2011; 123:750–758 [DOI] [PubMed] [Google Scholar]
- 30.Rhee C, Brown SR, Jones TM, et al. : Variability in determining sepsis time zero and bundle compliance rates for the centers for medicare and medicaid services SEP-1 measure. Infect Control Hosp Epidemiol 2018; 39:994–996 [DOI] [PMC free article] [PubMed] [Google Scholar]
- 31.PRISM Investigators: Early, Goal-Directed Therapy for Septic Shock - A Patient-Level Meta-Analysis. N Engl J Med 2017; 376:2223–2234 [DOI] [PubMed] [Google Scholar]