Abstract
During gestation the developing human fetus is exposed to a diverse range of potentially immune-stimulatory molecules including semi-allogeneic antigens from maternal cells1,2, substances from ingested amniotic fluid3,4, food antigens5 and microbes6. Yet the capacity of the fetal immune system, including antigen presenting cells (APC), to detect and respond to such stimuli remains unclear. In particular, dendritic cells (DC), which are crucial for effective immunity and tolerance, remain poorly characterized in the developing fetus. Here, we show that APC subsets can be identified in fetal tissues and are related to adult APC populations. Similar to adult DC, fetal DC migrate to lymph nodes and respond to TLR ligation; however, they differ markedly in their response to allogeneic antigens, strongly promoting regulatory T cell (Treg) induction and inhibiting T cell TNF-α production through arginase-2 activity. Our results reveal a previously unappreciated role of DC within the developing fetus and indicate that fetal DC mediate homeostatic immune suppressive responses during gestation.
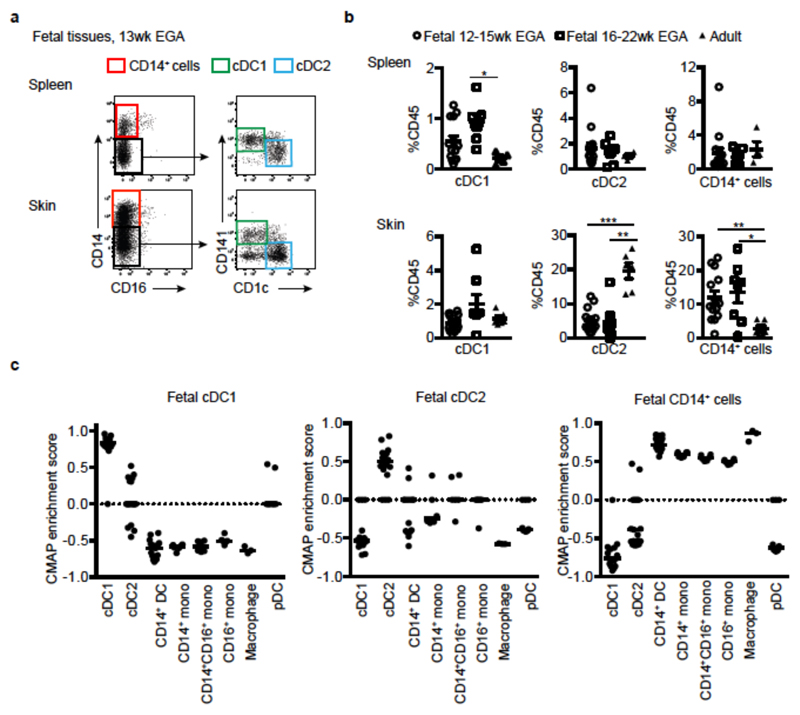
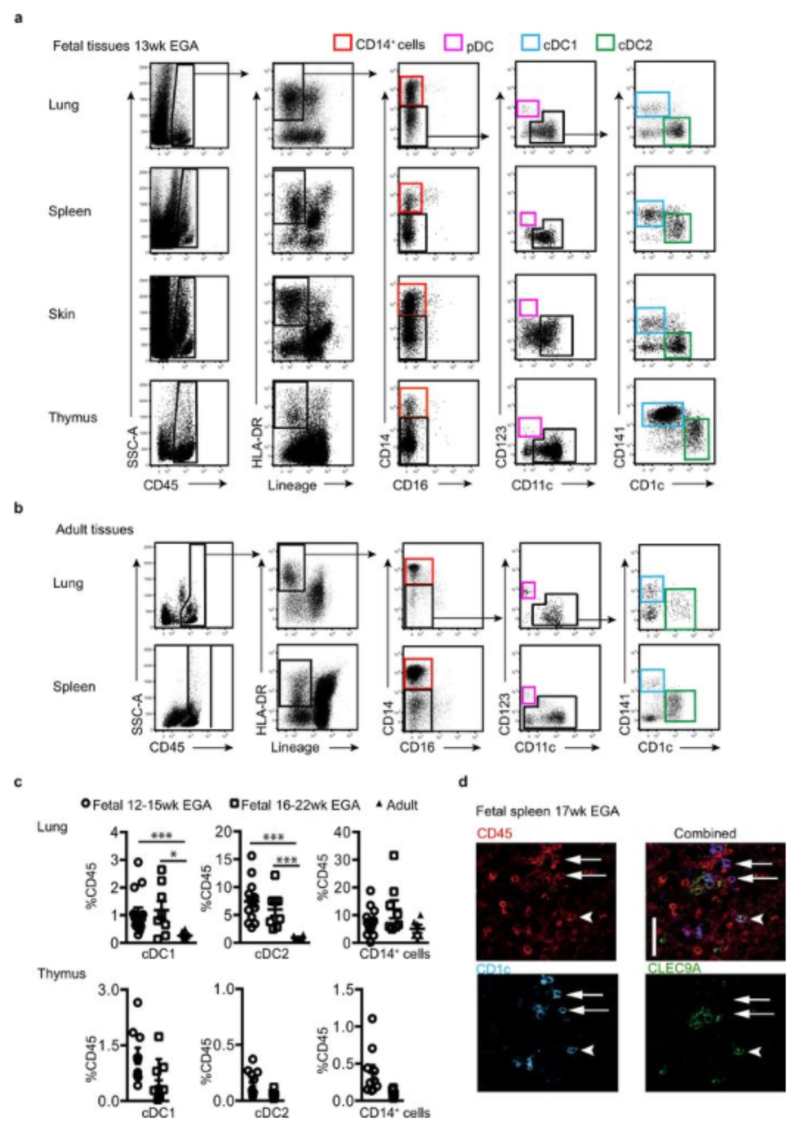
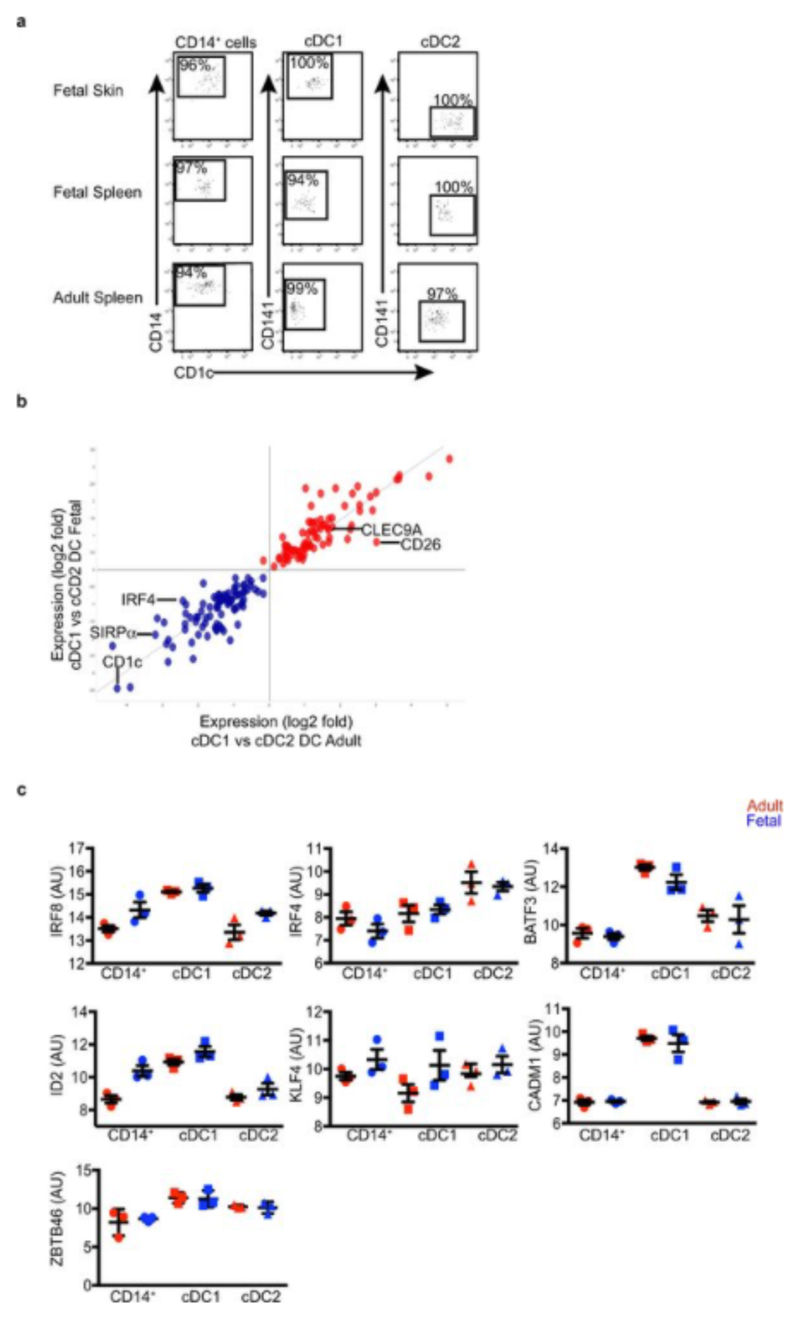
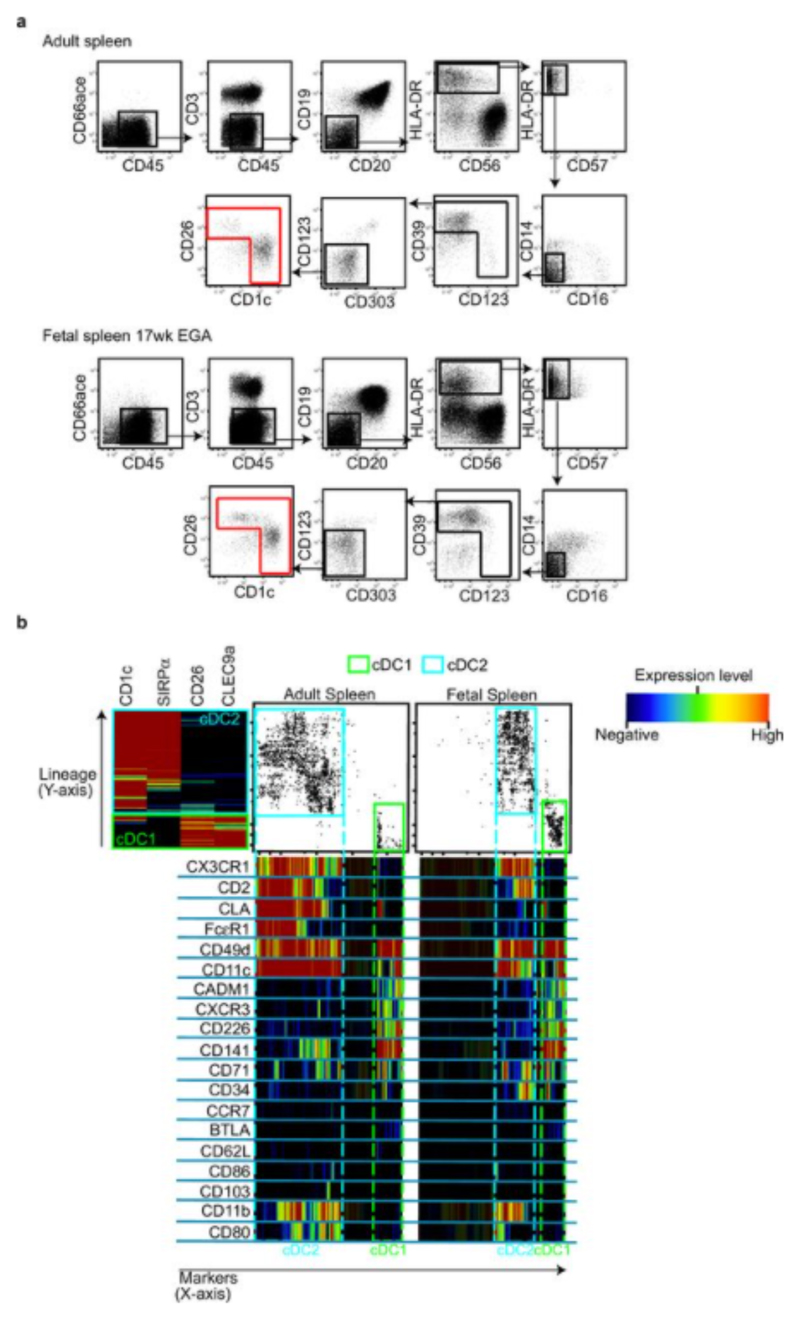
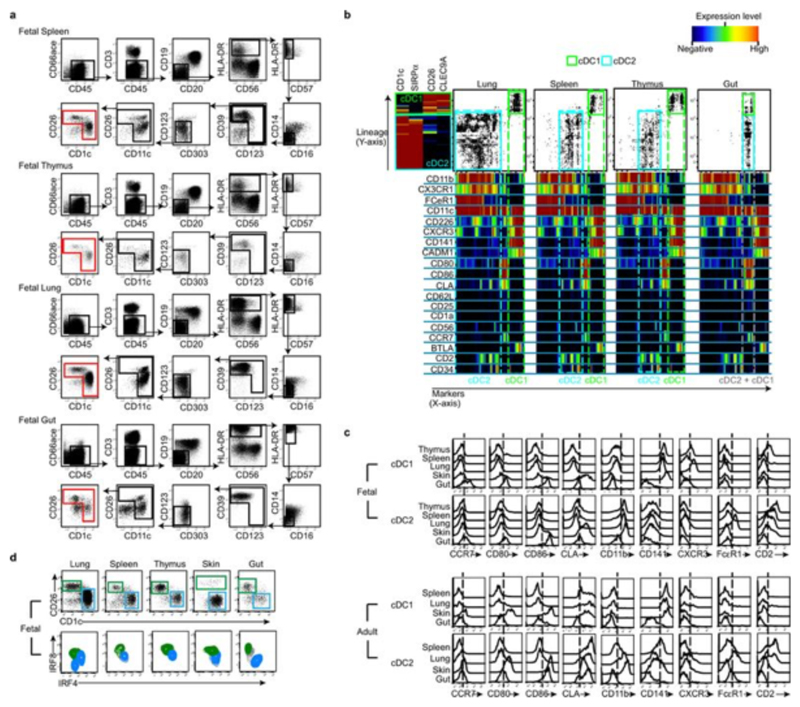
We employed a combination of flow cytometry and gene array analysis to characterize human fetal APC and compare them with adult APC. Using our previously-described gating strategy for adult tissue APC7,8 (Extended Data Fig. 1a, b), we identified fetal APC subsets: CD14+ monocytes/macrophages, pDC, cDC1 and cDC2 within fetal spleen, skin (in agreement with findings from others9), thymus and lung (Fig. 1a and Extended Data Fig. 1a) by 13 weeks (wk) estimated gestational age (EGA). Within both early (12-15wk) and late (16-22wk) 2nd trimester fetal tissues, APC were relatively abundant within the CD45+ compartment in comparison with equivalent adult tissues (Fig. 1b, Extended Data Fig. 1c). Fetal spleen cDC1 and cDC2 were also observed in situ using immunofluorescence microscopy (Extended Data Fig. 1d). Next we compared the gene expression profiles of cDC1, cDC2 and CD14+ cells purified by FACS from fetal skin and spleen with those from adult spleen (for sort gating strategy see Extended Data Fig. 1a, b and post-sort cell purity confirmation Extended Data Fig. 2a) as well as with published data on adult blood- and skin- derived APC subsets (Supplemental Experimental Procedures, Extended Data Fig. 3 and7). Connectivity map (CMAP) analysis7 was performed to compare the subset-specific gene expression signatures of fetal spleen and skin cDC1, cDC2 and CD14+ cells with adult blood, skin and spleen APC (Fig. 1c). CMAP scores indicated that gene expression signature of fetal cDC1 was enriched with genes also expressed by adult cDC1; similarly, the fetal cDC2 signature was enriched with adult cDC2-associated genes and fetal CD14+ cells scored most highly with adult blood monocyte and tissue macrophage populations, as expected7,8. Scatter plot analysis of normalized gene expression confirmed the strong correlation (R score 0.92) between the expression profiles of fetal and adult cDC1, as well as fetal and adult cDC2 (Extended Data Fig. 2b). Conserved gene lists across fetal and adult APC subsets and Ingenuity Pathway Analysis (IPA) of these gene lists are provided in SI Tables 1 - 9 (See Supplementary Experimental Procedures for the analysis). At the molecular level, fetal and adult DC expressed comparable levels of DC subset-specific transcription factors such as IRF8, IRF4, BATF3 and CADM1 (Extended Data Fig. 2c), in agreement with published data10. Detailed phenotyping of fetal and adult spleen DC by CyTOF and OneSense analysis (see Supplemental Experimental Procedures and11) demonstrated that fetal and adult spleen DC had similar antigen expression profiles, except for CD141, FcεR1 and CLA which were relatively more highly expressed on adult cDC2 (Extended Data Fig. 4a, b).
Figure 1. Identification of fetal APC.
a, CD14+ cells, cDC1 and cDC2 were identified within fetal spleen and skin by flow cytometry. b, Enumeration of APC subsets within fetal and adult tissues. Mann-Whitney test *P<0.05, **P<0.01, ***P<0.001. Mean±s.e.m. c, CMAP enrichment scores for fetal skin and spleen cDC1, cDC2 and CD14+ cells against all adult blood, skin and spleen APC subsets are shown. Enrichment scores for fetal skin and spleen cDC1, cDC2 and CD14+cells with equivalent adult APC subsets were significant at P<0.0001. a, b Each data point in the scatter plots represents an individual experiment.
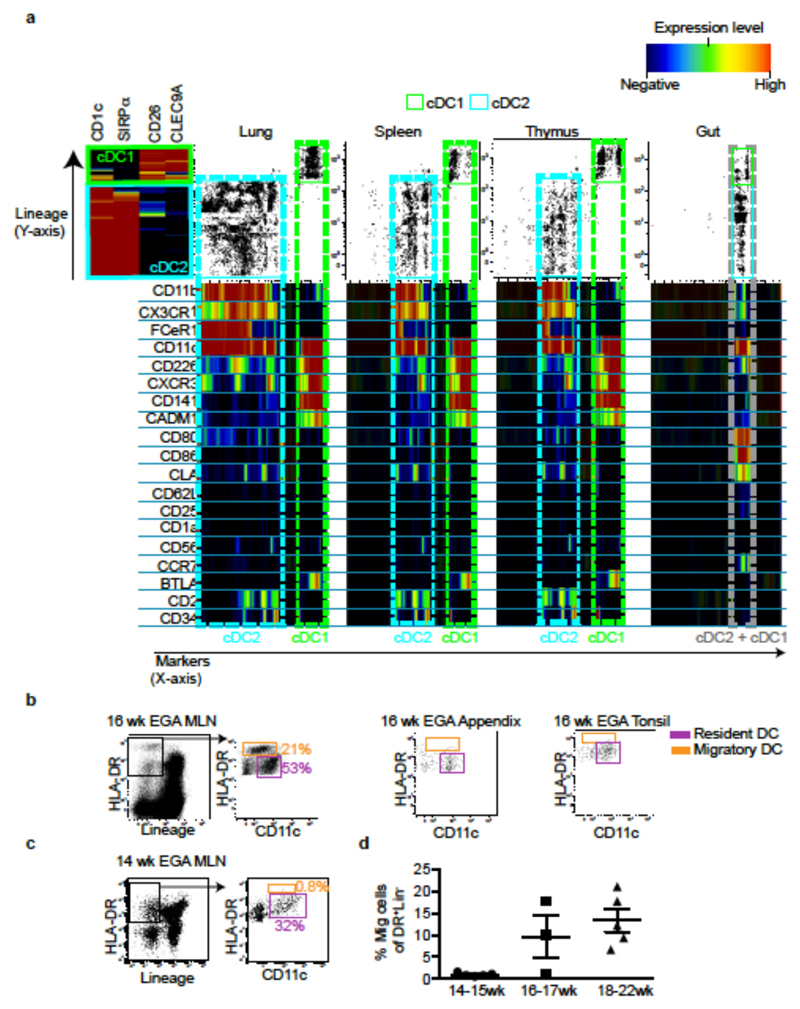
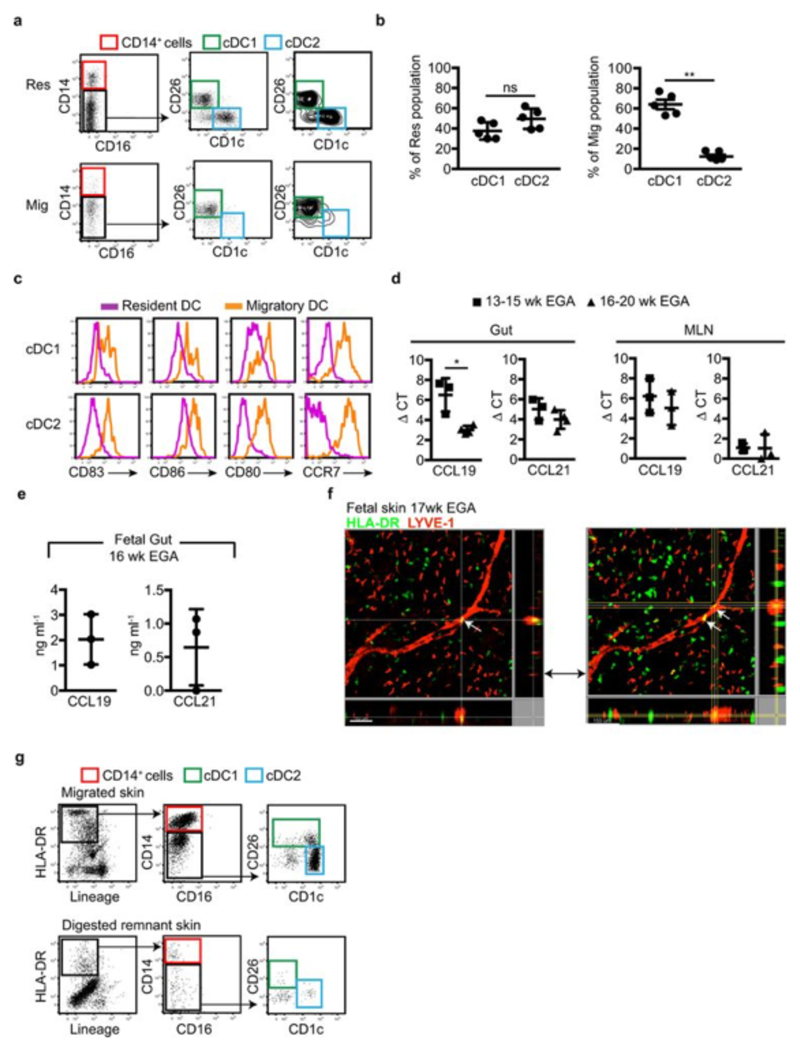
To gain insight into the functions and heterogeneity of the fetal tissue cDC populations, we first compared their surface antigen expression profiles across tissues within single donors (Fig. 2a, input gating strategy and original heatmap in Extended Data Fig. 5a, b), and with cDC from adult tissues using CyTOF and OneSense analysis11 (Extended Data Fig. 5c). Fetal cDC1 and cDC2 showed great heterogeneity between tissues at the single cell level (Fig. 2a), most obviously within the lung, suggesting differential tissue imprinting. We also identified tissue-specific cDC phenotypes conserved between adults and fetuses (Extended Data Fig. 5c). For example, both fetal and adult lung cDC2 expressed elevated levels of CD2 and FcεR1, while expression of these markers by fetal and adult gut cDC were low to negative. Notably, the fetal lung cDC2 population exhibited heterogeneous expression of the transcription factor IRF4 (Extended Data Fig. 5d), which indicates contamination of the gated population with monocytes and/or monocyte-derived cells, as seen in adults12. Several activation markers were differentially expressed between cDC from different fetal tissues. In particular, fetal gut cDC displayed a more activated phenotype than did cDC in others fetal tissues (Fig. 2 a and Extended Data Fig. 5b, c), expressing higher levels of the chemokine receptor CCR7 and the activation markers CD80 and CD86. As CCR7 mediates DC migration to lymph nodes in adults, where they initiate and shape emergent T cell responses8,13, we then asked whether CCR7+ gut DC migrated to their draining lymphoid organs during fetal life. Using a gating strategy verified in adult tissues7, we identified migratory (HLA-DRhiCD11clo/int) and resident (HLA-DRintCD11chi) DC in 16wk EGA fetal mesenteric lymph nodes (MLN) (Fig. 2b). In contrast, in the fetal appendix and tonsil, which lack connecting afferent lymphatics, we observed only resident DC (Fig. 2b). Within the MLN, the resident cell population included CD14+ cells, cDC1 (CD26+CD1c-) and cDC2 (CD26-CD1c+) (Extended Data Fig. 6a). The migratory-phenotype fraction of DC within the MLN contained relatively few CD14+ cells, as in adults7,8, alongside both cDC1 and cDC2, with the former relatively more abundant (Extended Data Fig. 6a, b). Of note fetal gut cDC1 expressed more CCR7 than did cDC2 (Extended Data Fig. 5c), which might suggest preferential priming and greater migratory capacity within this population. Similar to adult migratory DC7, fetal MLN migratory DC expressed higher levels of CCR7 and the activation markers CD80, CD83 and CD86 than did DC with the resident phenotype (Extended Data Fig. 6c). Looking along the timeline of the 2nd trimester of gestation, we found that while MLN from 14-15wk EGA fetuses contained abundant resident DC, migratory DC were scarce or absent (Fig. 2c, d), suggesting that fetal gut DC begin migrating to the MLN from 16-17wk EGA. The presence of migratory DC in the MLN is consistent with expression of the lymph node-homing cytokines CCL19 and CCL2114 in the fetal gut and MLN (Extended Data Fig. 6d, e). Migratory HLA-DR+ cells were also visualized within the lymphatic vessels (LYVE-1+) of 17-22wk EGA fetal skin (Extended Data Fig. 6f), using a protocol validated in adult skin8, providing confirmation that fetal cDC can migrate via lymphatic vessels in vivo. Furthermore, we observed fetal DC actively migrating out of skin explants over a period of 48 hours (Extended Data Fig. 6g), using ex vivo skin assays validated in adult tissues15. In summary, our data suggest that fetal skin and gut DC have the capacity to migrate through lymphatics and to lymph nodes from 16wk EGA, where they may interact with fetal T cells that are present in lymphoid organs from 10wk EGA16. The reason for the initiation of DC migration to the lymph nodes around 16wk EGA remains unclear: while the human lymphatic system is structurally complete by 8wk EGA, it may remain functionally immature for some time thereafter17.
Figure 2. Fetal cDC migrate to draining lymph nodes.
a, Characterisation of cDC1 and cDC2 across fetal tissues using CyTOF and one-Sense algorithm (see Methods, representative plots of n=5). b, c Flow cytometry analysis of fetal mesenteric lymph nodes (MLN) at 16wk (b) or 14wk (c) EGA. Within the HLA-DR+Lin- gate (black), MLN- HLA-DRintCD11chi resident DC (pink) are distinguished from HLA-DRhiCD11int migratory DC (orange gate). b, 16wk EGA MLN (left) and fetal appendix and tonsil (right, n=3). d, Enumeration of migratory cDC at indicated time points. Mean±s.e.m. Each data point in the scatter plots represents an individual experiment.
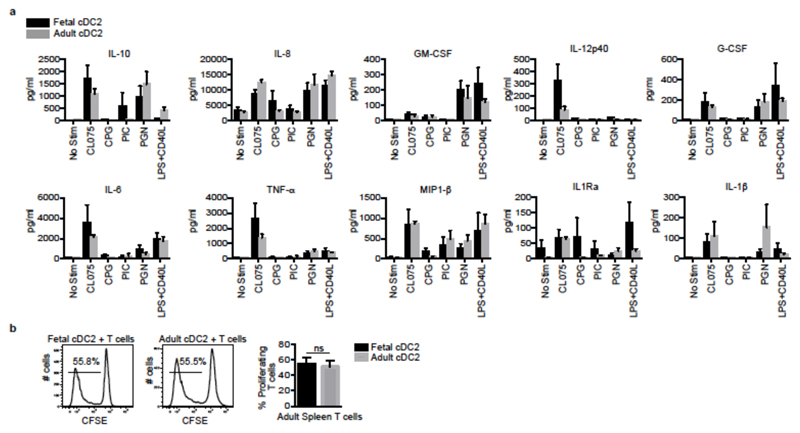
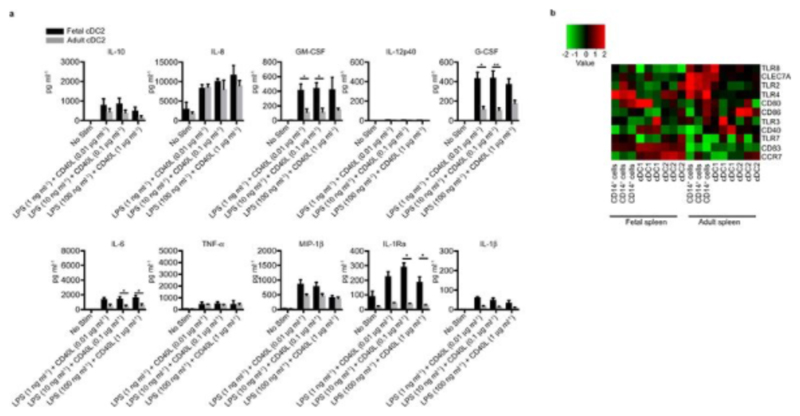
Next, we asked whether fetal cDC were able to respond to ligation of their toll-like receptors (TLR)18 and/or to stimulate naïve T cells in vitro. We sorted the most abundant cDC subset, splenic cDC2, from 17-22wk EGA fetuses and adult samples and exposed them to a panel of TLR agonists: adult and fetal cells secreted similar amounts of the pro-inflammatory cytokines GM-CSF, IL-6, IL-8 and MIP-1β (Fig. 3a, Extended Data Fig. 7a), in line with their similar expression of pattern recognition receptors (Extended Data Fig. 7b). Moreover, fetal and adult splenic cDC2 induced comparable proliferation of allogeneic CFSE-labeled adult splenic T cells in a mixed lymphocyte reaction (MLR) (Fig. 3b). Thus fetal cDC are capable of both sensing pathogens and stimulating T cells, which, together with their migratory ability, indicates that they have the potential to initiate an immune response to microbe-derived products around 17wk EGA.
Figure 3. Fetal cDC are responsive to TLR stimulation and induce T cell proliferation.
a, Cytokines in supernatants of fetal and adult cDC2 stimulated for 18 hrs with TLR agonists; CL075 (1μg/ml), CPG (3μM), PI:C (25μg/ml), PGN (10μg/ml), LPS (0.1μg/ml)+CD40L (1μg/ml). Mean±s.e.m, n=4. b, Alloactivation of adult CD4+ T cells by fetal and adult cDC2 after 6 days co-culture. Proliferation was measured by CFSE dilution. Left panel, representative histograms. Right bar graph, cumulative data, n=5. Data shown as mean±s.e.m. ns, not significant (P>0.05), Mann-Whitney test.
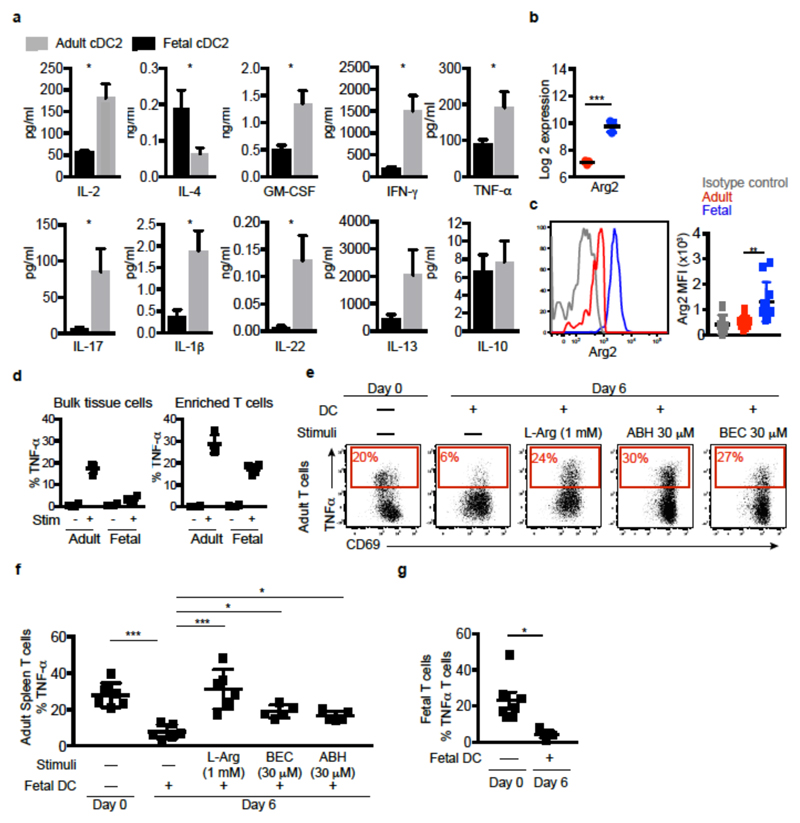
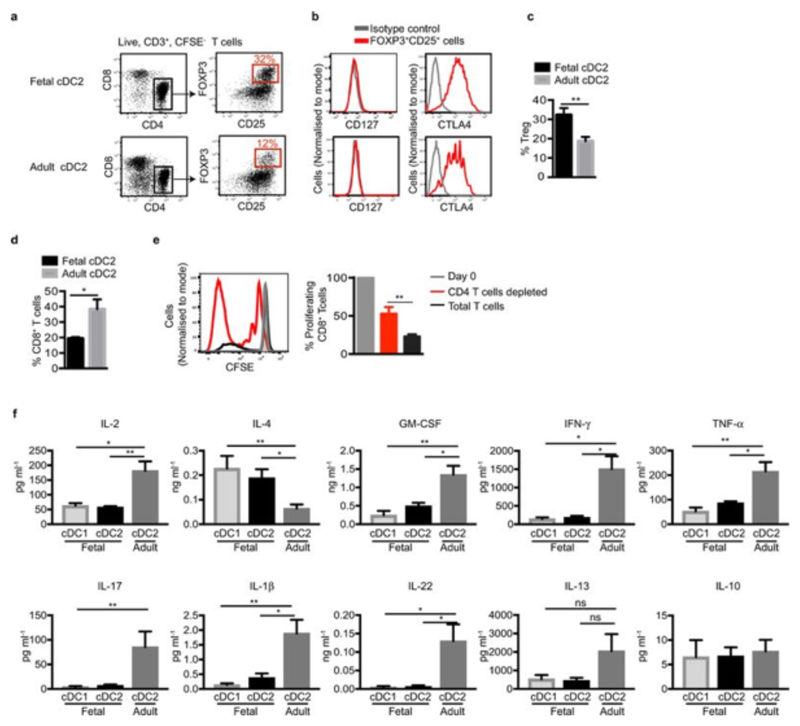
While this shows that fetal cDC are capable of initiating allogeneic T cell proliferation in vitro, we know that life-long in vivo tolerance towards non-inherited maternal allogeneic antigens is established during gestation2,9,19Thus, to understand how fetal DC contribute to such tolerogenic T cell responses, we examined the phenotype of the T cell populations generated from MLR, where fetal or adult cDC2 were co-cultured with allogeneic adult spleen T cells. After 6 days co-culture, fetal spleen cDC2 induced the differentiation of significantly higher frequencies of CD4+CD25+FOXP3+CD127-CTLA4+ bona fide T regulatory cells (Treg)1,20,21 than did adult splenic cDC2 (Extended Data Fig. 8 a, b, c). Confirming the immunosuppressive capacity of fetal cDC2-induced Tregs, CD8+ T cell proliferation was significantly impaired upon co-culture with fetal cDC2 as opposed to adult cDC2 (Extended Data Fig. 8d), and was restored when CD4+ T cells were removed (Extended Data Fig. 8e). In addition, allogeneic T cells cultured with fetal cDC2 (Figure 4a) or cDC1 (Extended Data Fig. 8f) produced significantly less of several pro-inflammatory cytokines and significantly more of the Th2-polarising cytokine IL-4, but not IL-13, compared with allogeneic T cells incubated with adult cDC2. Thus, consistent with the establishment of fetal tolerance to maternal antigens in vivo, fetal cDC initiate Treg induction and do not launch T cell pro-inflammatory responses in vitro.
Figure 4. Arginase 2+ fetal cDC regulate TNF-α production.
a, Cytokine production by adult T cells after 6 days co-culture with fetal or adult cDC2 (n=5). b, c Expression of arginase-2 gene (b) and protein (c) in cDC2. d, Splenocyte T cell TNF-α production. e, f TNF-α production (red) of stimulated adult T cells, after overnight culture in the absence (Day 0) or presence of cDC2 (Day 6 of co-culture), with or without additional supplementation of L-arginine or arginase inhibitors (ABH or BEC). e, Representative dot plots. f, Cumulative data. g, TNF-α production from stimulated fetal T cells under indicated culture conditions. Data shown as mean±s.e.m. *p<0.05, **p<0.01, ***P<0.001, Mann-Whitney test. Each data point in the scatter plots represents an individual experiment.
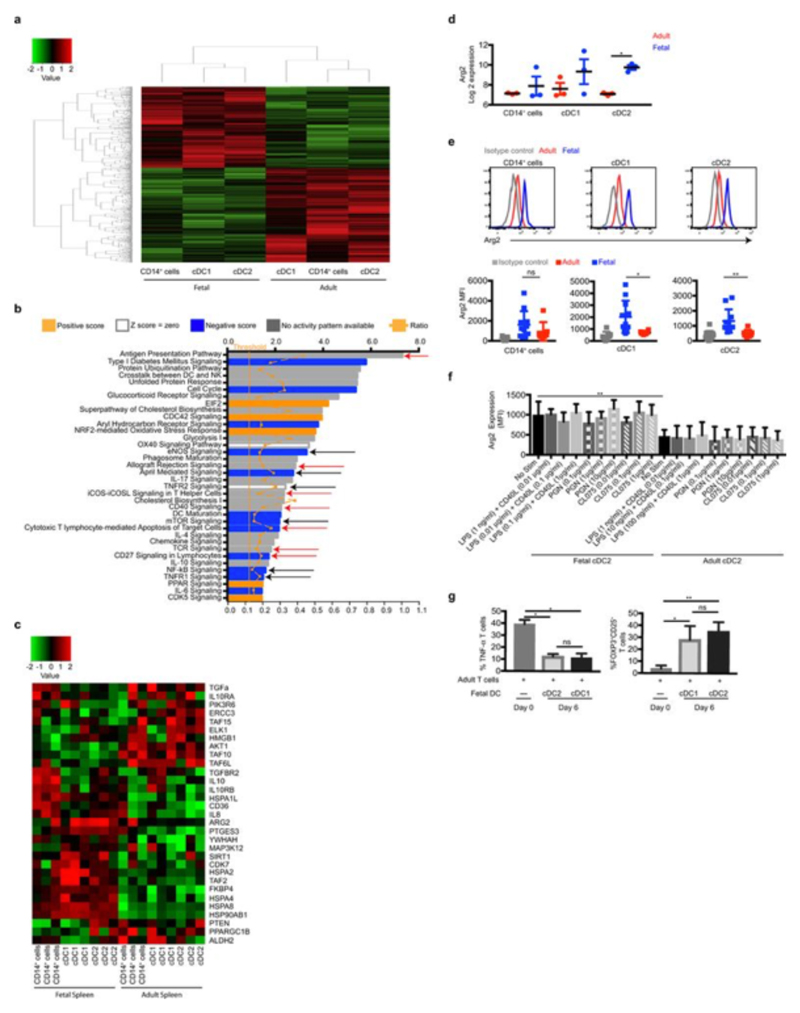
The observed functional differences between fetal and adult DC were mirrored at their gene expression level, with over 3,000 genes being significantly differentially expressed between fetal and adult APC (Fig. 9a, SI Table 10, 11). IPA revealed that multiple pathways involved in educating T cells were significantly differentially regulated between fetal and adult APC, as were several pathways involved in the iNOS/TNF-α axis (Extended Data Fig. 9b, red and black arrows, respectively, SI Table 12). Further analysis revealed that a number of genes involved in immune-suppression/inflammation were differentially expressed (Extended Data Fig 9c). Of particular interest was the elevated expression of arginase-2 by fetal spleen cDC2 (Fig. 4b, c) and cDC1 (Extended Data Fig. 9d, e) in comparison with adult spleen cDC. Of note, arginase 2 expression was not modulated by TLR stimulation (Extended Data Fig. 9f). Arginase depletes the local environment of L-arginine (by converting L-arginine to L-ornithine and urea) which is required for the production of TNF-α22,23. Importantly, arginase activity has been shown to be an essential player in the regulation of TNF-α levels in the neonate22.
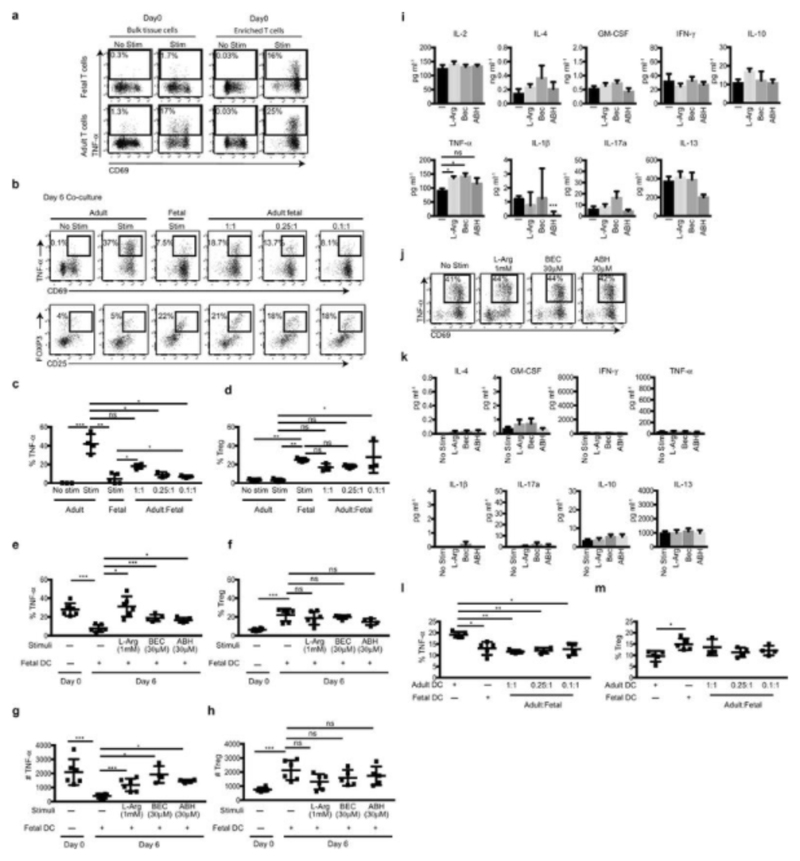
Coincidingly, we found that in stimulated splenic culture (i.e. include APC), fetal T cells did not produced TNF-α compared to adult T cells (Fig. 4d, Extended Data Fig. 10a). However, when enriched (i.e. in the absence of APC), they produced TNF-α, although to a lesser level to their adult counterparts (Fig. 4d). Furthermore, we found significantly lower frequencies of fetal T cells producing TNF-α than adult T cells after 6 days of culture (Extended Data Fig. 10b). In addition, when fetal and adult splenocytes were co-cultured at increasing ratios of fetal cells, adult T cell TNF-α production was impaired. While fetal splenocytes also promoted Treg induction, the change in TNF-α levels did not correlate with the change observed in Treg induction (Extended Data Fig. 10b-d). These data suggested that the differential arginase-2 expression between adult and fetal cDC is sufficient to regulate T cell responses and their TNF-α production.
In the absence of any cDC, approximately 24% of proliferating adult splenic T cells produced TNF-α while following 6 days co-culture with fetal cDC2 (Fig. 4e, f) or cDC1 (Extended Data Fig. 9g) that express arginase-2, their ability to produce TNF-α was dramatically reduced. TNF-α production was reinstated upon replenishing the medium with L-arginine or by the addition of arginase-specific inhibitors22 (Fig. 4e, f), confirming that the reduced TNF-α production was mediated through arginase-2 activity. Treg numbers did not change when arginase activity was modulated, suggesting fetal DC regulation of TNF-α production is independent of their promotion of Treg induction (Extended Data Fig. S10e-h). Further analysis of the supernatants from the co-cultures found that fetal cDC did not mediate T cell production of other pro-inflammatory cytokines by arginase activity (Extended Data Fig. 10i-k), suggesting fetal DC utilize a range of mechanisms to regulate T cell biology which remain to be explored. We also found that when fetal cDC were cultured with adult cDC2, they could abrogate adult cDC2 promotion of TNF-α production by T cells (Extended Data Fig. 10l, m). In addition, when fetal T cells were cultured in the absence of cDC, they produced TNF-α, but when co-cultured with fetal cDC their ability to produce TNF-α was significantly impaired (Fig. 4g). Altogether, these data confirm that in the absence of TLR stimulation, fetal DC promote immune-suppression and impair T cell TNF-α production in response to allogeneic antigens through expression of arginase-2. Importantly, a recent study highlighted the crucial role of L-arginine as major modulator of adult T cell biology24.
In summary, our findings uncovered a yet unknown mechanism of tolerance and immune suppression that is used during gestation by fetal cDC and works in concert with others mechanisms used by fetal NK cells25 and Tregs1. Understanding the mechanisms through which TNF-α production is regulated within the fetus is important as elevated levels of TNF-α are associated with a number of pregnancy and perinatal complications including recurrent spontaneous miscarriage, gestational diabetes and necrotizing enterocolitis. Our data suggest that the regulation of L-arginine levels by fetal DC is important for controlling T cell TNF-α levels during gestation placing fetal DC are key regulators of TNF-α production and should be investigated as potential therapeutic target in such situations. In addition, our study demonstrates that fetal cDC are immunologically dynamic and can orchestrate immune responses as early as in the 2nd trimester. How TLR stimulation during intrauterine infections can override immune-suppression induced by arginase 2 expressing fetal DC in an allogeneic context remain to be explored. Altogether, these findings highlight that key processes in human immune development and programming in fact begin early during gestation and may have life-long implications for immune homeostasis19.
Supplementary Experimental Procedures
Human samples and consent
The donation of fetal tissue for research is approved by the Centralised Institutional Research Board (CIRB) of the Singapore Health Services in Singapore. This approval strictly follows established international guidelines regarding the use of fetal tissue for research26. This approval allowed the collection of fetal tissue from women undergoing clinically-indicated termination of pregnancies for the study of immune cells in different fetal tissues. Women gave written informed consent for the donation of fetal tissue to research nurses who were not directly involved in the research, or in the clinical treatments of women participating in the study as per the Polkinghorne guidelines26. This protocol has been reviewed on an annual basis by the CIRB that includes annual monitoring of any adverse events, for which there had been none. All fetal organs for this study (lung, thymus, spleen, mesenteric lymph nodes, gut, appendix, liver, tonsil and skin) were obtained from 2nd trimester (12-22 wk EGA). All fetuses were considered structurally normal on ultrasound examination prior to termination and by gross morphological examination following termination. In total 72 fetuses of 14-16 wk EGA and 24 fetuses of 17-22 wk EGA were used for this study. For comparisons across fetal organs the same donors were used, for example for CyTOF data analysis.
Adult tissue (lung, spleen, gut and skin) were obtained with approval from Singapore Singhealth and National Health Care Group Research Ethics Committees.
Cell isolation
Fetal organs were mechanically dispersed and incubated with 0.2 mg/ml collagenase (Type IV; Sigma Aldrich) and DNase I (20000U/ml, Roche) in RPMI with 10% FCS for up to 1 hour in a 6 well plate. Viability was typically 80-90% measured by DAPI exclusion (Partec). Fetal gut was initially cut longitudinally through the center, washed extensively in PBS until all inner content (meconium) was removed and the PBS was clear, before mechanical dispersion and digestion as above, for up to 1h. Adult lung specimens (8 samples from different donors) were obtained from peritumoral tissue. Adult skin (20 samples from different donors) was obtained from mammoplasty and breast reconstruction surgery. Adult spleen specimens (8 samples from different donors) were obtained at distal pancreatectomies in patients with pancreatic tumours in the pancreas. Adult lung27 and skin8 specimens were prepared as described previously. Adult spleen specimens were prepared in a similar manner to lung. Tissue macrophages and DC were isolated to 95% purity from freshly digested tissue cell suspensions by fluorescence activated cell sorting (FACS) using BD FACSAriaII or III (BD Biosciences). T cells were isolated to 90% purity from adult and fetal spleen by negative selection using T cell enrichment kits (Miltenyi Biotec) and separated on an AutoMacs following manufacturer’s instructions. T cells were labeled with 0.2μM carboxyfluorescein succinimidyl ester (CFSE) (Life Technologies) for 5 minutes at 37°C. In all experiments enriched APC and T cells were from fetal and adult spleen unless stated otherwise.
Flow cytometry
Flow cytometry was performed on a BDLSRII and data analyzed with FlowJo (Treestar). Antibodies used are listed in Table 12. The eBioscience FOXP3 / Transcription Factor Staining Buffer Set (eBioscience/Affimetrix) was used for intracellular staining of IRF8, IRF4, CTLA4, arginase-2, TNF-α and FOXP3 cells by following manufacturer’s instructions. ALDEFLUOR™ kit (STEMCELL technologies) was used to measure ALDH activity.
Mixed lymphocyte reactions
5,000 sorted cDC from defined subpopulations were co-cultured with 100,000 CFSE-labeled adult or fetal spleen T cells for 6 days in 200μl complete RPMI-1640 Glutamax™ medium (Life Technologies) supplemented with 10% FBS and 1% penicillin/streptomycin27. On day 6, cells supernatants (100μl) were removed and stored at -80°C for detection of the cytokines indicated in Fig. 4a, Extended Data Fig. 8f, 10h-j) at a later date. Cytokines were detected using Luminex® bead-based multiplex assays, as detailed below. For analysis of intracellular TNF-α production analysis, on day 6 of co-cultures T cells were re-stimulated with 10μg/ml phorbol myristate acetate (PMA) and 500 μg/ml Ionomycin for 1 hour at 37°C. 10 μg/ml Brefeldin A solution was added for 4 hours. Intracellular cytokine production was determined by flow cytometry. In some experiments on Day 0, the arginase inhibitors S-(2-boronoethyl)-l-cysteine (BEC) or amino-2-borono-6-hexanoic acid (ABH) (each used at 30μM respectively) were added to co-cultures. In some experiments on Day 6, 1 mM l-arginine was added to co-cultures 1 hour prior to stimulation with PMA/Ionomycin.
Ex-vivo co-culture assays
Fetal or adult splenocytes (1x10⁵) were seeded into 96-well round bottom plates alone or combined at defined ratios in 200μl medium. After o/n or 6 days of co-culture the splenocytes were stimulated with 10 μg/ml phorbol myristate acetate (PMA) (InvivoGen) and 500 μg/ml Ionomycin (Sigma) for 1 hour at 37°C. 10 μg/ml Brefeldin A solution was added for 4 hours. Intracellular T cell TNF-α production was determined by flow cytometry as described above.
Millipore Luminex® bead-based multiplex assays on supernatants from mixed lymphocyte reactions
Samples (supernatants) or standards were incubated with fluorescent-coded magnetic beads pre-coated with cytokine-specific capture antibodies. After an overnight incubation at 4°C with shaking, plates were washed twice with wash buffer. Biotinylated detection antibodies specific to the cytokine of interest were incubated with the complex for 1 hour and subsequently Streptavidin-PE was added and incubated for another 30 minutes. Plates were washed twice again, and beads were re-suspended with sheath fluid before a minimum of 50 beads per cytokine were analysed on the Luminex FLEXMAP® 3D (Merck Millipore). Data acquisition was carried out using xPONENT® 4.0 (Luminex) acquisition software, with data analysed in Bio-Plex Manager® 6.1.1 (Bio-Rad). Cytokine concentrations were calculated from the standard curve using a 5PL (5-parameter logistic) curve fit.
Drop array Luminex assays on fetal and adult spleen cDC2
Sorted fetal (17-22wk EGA) and adult spleen cDC2 were incubated for 18 hours at 20,000 cells/well in 100μl complete RPMI-1640 Glutamax™ medium (Life Technologies) supplemented with 10% FBS and 1% penicillin/streptomycin, and stimulated with either TLR agonists; CL075 (1μg/ml), CPG (3μM), PI:C (25μg/ml), PGN (10μg/ml), LPS (0.1μg/ml) + CD40L (1μg/ml), or DMSO control. Cells were then pelleted and 95μl of supernatants were collected. Fetal and adult spleen cDC2 cytokine production was assessed using Luminex® bead-based multiplex assays. Cytokines indicated in the figures were detected with DropArray™-bead plates (Curiox) according to manufacturers’ recommendations. Acquisition was performed with the xPONENT 4.0 (Luminex) acquisition software, while data analysis was performed with Bio-Plex Manager 6.1.1 (Bio-Rad).
Mass cytometry staining, barcoding, acquisition and data pre-processing
For mass cytometry analysis, purified antibodies were obtained from Invitrogen, Fluidigm, Biolegend, eBioscience, Beckton Dickinson and R&D Systems using clones as listed in SI Table 13. For some markers, fluorophore- or biotin-conjugated antibodies were used as primary antibodies, followed by secondary labeling with anti-fluorophore metal-conjugated antibodies (i.e. anti-FITC clone FIT-22) or metal conjugated streptavidin produced as previously described11. Briefly, cells were plated, stained, and labeled in a V-bottom 96 well plate (BD Falcon). Cells were washed once with 200μl FACS buffer (4% FBS, 2mM EDTA, 0.05% Azide in 1X PBS), followed by staining with 100μl of 200μM cisplatin (Sigma-Aldrich) for 5 minutes on ice to exclude dead cells. Cells were then labelled with anti-CADM1-biotin and antibodies in a 50μl reaction volume for 30 minutes on ice. Cells were washed twice with FACS buffer and labeled with 50μl heavy-metal isotope-conjugated secondary antibody cocktail for 30 minutes on ice. Cells were washed twice with FACS buffer then once with PBS before fixation with 200μl 2% PFA (Electron Microscopy Sciences) in PBS overnight or longer. Following fixation, cells were pelleted and resuspended in 200μl 1X perm buffer (Biolegend) and allowed to stand for 5 minutes at room temperature. Cells were washed once with PBS before barcoding. Bromoacetamidobenzyl-EDTA (BABE)-linked metal barcodes were prepared by dissolving BABE (Dojindo) in 100mM HEPES buffer (Gibco) to a final concentration of 2mM. Then isotopically-purified PdCl2 (Trace Sciences Inc.) was added to BABE solution to 0.5mM. Similarly, DOTA-maleimide (DM)-linked metal barcodes were prepared by dissolving DM (Macrocyclics) in L buffer (MAXPAR) to a final concentration of 1mM. Then, 50mM of RhCl3 (Sigma) and isotopically-purified LnCl3 were added to DM solution to 0.5mM. Six metal barcodes were used: BABE-Pd-102, BABE-Pd-104, BABE-Pd-106, BABE-Pd-108, BABE-Pd-110 and DM-Ln-113. All BABE and DM-metal solution mixtures were immediately snap-frozen in liquid nitrogen and stored at -80°C. A unique dual combination of barcodes was chosen to stain each tissue sample. Barcode Pd-102 was used at 1:4000 dilution, Pd-104 at 1:2000, Pd-106 and Pd-108 at 1:1000, and Pd-110 and Ln-113 at 1:500. Cells were incubated with 100μL of barcodes in PBS for 30 minutes on ice. Cells were then washed in perm buffer and incubated in FACS buffer for 10 minutes on ice. Cells were then pelleted and resuspended in 100μl of nucleic acid Ir-Intercalator (MAXPAR) in 2% PFA/PBS (1:2000), at room temperature. After 20 minutes, cells were washed twice with FACS buffer and twice with water before a final resuspension in water. In each set, cells were pooled from all tissue types, enumerated, and diluted to a final concentration of 0.5x10⁶ cells/ml for acquisition. EQ Four Element Calibration Beads (DVS Science, Fluidigm) were added at a concentration of 1% prior to acquisition. Cells were acquired and analyzed using a CyTOF Mass cytometer. The data were exported in a traditional flow-cytometry-file (.fcs) format and cells for each barcode were deconvolved using Boolean gating.
OneSense Analysis
The automated analysis was performed by the OneSense algorithm as described previously11. For Fig. 2 and Extended Data Fig. 4b, 5b the lineage dimension included CD1c and SIRPα as cDC2 markers and CD26 and CLEC9A as cDC1 markers. The marker dimension includes all the other non-lineage markers of the CyTOF panel. Frequency heat maps of indicated markers are displayed for both dimensions. cDC2 clusters (cyan gate) and cDC1 clusters (green gate) for each organ and their marker expression profile are highlighted by the extended gates (representative plots of n=5). For comparisons across fetal organs, organs from the same donor were used.
Microarray analysis
Total RNA was isolated from FACS-purified fetal spleen and skin (17-22wk EGA) CD14+ cells, cDC1 and cDC2 subsets and adult spleen CD14+ cells, cDC1 and cDC2 subsets with the Qiagen RNeasy Micro kit (Qiagen). Total RNA integrity was assessed using Agilent Bioanalyzer and the RNA Integrity Number (RIN) was calculated; all RNA samples had a RIN ≥ 7.1. Biotinylated cRNA was prepared according to the protocol by Epicentre TargetAmp™ 2-Round Biotin-aRNA Amplification Kit 3.0 using 500pg of total RNA. Hybridization of cRNA was performed on Illumina Human-HT12 Version 4 chips. Microarray data were exported from GenomeStudio software without background subtraction. Expression values were quantile normalized and log2 transformed in R (version 3.1.2) with Bioconductor (version 2.26.0) lumi package (version 2.18.0). For generation of fetal APC subset gene signatures, one cell subset was compared with other cell subsets pooled using t-test in R. DEGs were selected with Benjamini-Hochberg (BH) multiple testing28 corrected p-value of < 0.05. For the adult APC gene expression data, samples were grouped by tissue type and tissue specific probes were identified with one-way ANOVA and with BH multiple testing corrected p-value of < 0.05. CMAP analysis as previously described11 was performed comparing fetal DC signature gene subsets with the adult APC gene expression data after removal of the tissue-specific probes (see Extended Data Fig. 3 for hierarchical clustering and PCA plots before and after removal of tissue specific probes). To identify the genes that are highly or lowly expressed in a particular cell subset, we used the single-class rank product method29, which is implemented in the Bioconductor RankProd package (version 2.38.0), and selected the top and bottom ranked genes with percentage of false-positives (PFP) less than 0.01. The in-house generated adult and fetal microarray data have been submitted to the Gene Expression Ominous (GEO) database under the accession numbers GSE35457, GSE85305, and GSE85304.
Quantitative real-time PCR
Total RNA was isolated from adult or fetal gut and mesenteric lymph node (14-20wk EGA) cells with the Qiagen RNeasy Micro kit (Qiagen). Total RNA integrity and concentration was assessed using nanodrop 2000 (Thermoscientific). Total RNA (1 μg) was reverse transcribed using oligo (dT)18 primer and SuperScript II reverse transcriptase (GIBCO-BRL). CCL19 and CCL21 expression was analysed by Quantitative real-time PCR using the following primer: +5-CCAGCCTCACATCACTCACACCTTGC-3 and −5-TGTGGTGAACACTACAGCAGGCACCC-3 for CCL19; +5-AACCAAGCTTAGGCTGCTCCATCCCA-3 and −5-TATGGCCCTTTAGGGGTCTGTGACCG-3 for CCL21. CCL19 and CCL21 expression was normalized to the housekeeping gene GAPDH +5-GCCAAGGTCATCCATGACAACTTTGG-3 and −5-GCCTGCTTCACCACCTTCTTGATGTC-3.
Confocal microscopy
Samples were prepared for confocal microscopy as described previously15.
Statistical analysis
Statistical analysis used for each experiment is indicated in the figure legends. Each n number represents an individual donor and a separate experiment.
Extended Data
Extended Data Fig. 1. Identification of APC subsets in fetal and adult tissues.
Representative flow plots of gating strategy used to identity APC subsets in fetal and adult tissues. a, Gating strategy used to identify APC populations within the live CD45+, HLA-DR+Lin- gate; CD14+ cells (red gate), pDC (pink gate), cDC1 (blue gate) and cDC2 (green gate) in fetal lung, spleen, skin and thymus. b, Gating strategy used to identify CD14+ cells (red gate), pDC (pink gate), cDC1 (blue gate) and cDC2 (green gate) in adult lung and spleen. c, Abundance of APC plotted as a percentage of live CD45+ mononuclear cells. Cell abundance was determined in fetal lung and thymus at 2 time points within the 2nd trimester (12-15 wk EGA (circle, lung n=13, thymus=9) and 16-22wk EGA (square, lung n=8, thymus n=8) and compared with adult tissues (triangle, lung n=8). *P<0.05, ***P<0.001, Mann-Whitney test. d, Pseudo-color images of whole-mount fetal spleen (17wk EGA) immunolabeled for CD45 (red), CD1c (blue), and CLEC9A (green). White arrows highlight cDC2 (CD45+CD1c+CLEC9A-), white arrow head highlights cDC1 (CD45+CD1c+CLEC9A+). Scale bar represents 5μm. Representative image of n=3 experiments shown.
Extended Data Fig. 2. Comparison of the transcriptomes and phenotypes of fetal and adult APC subsets.
a, Confirmation of post-sort APC subset purity. Representative dot plots demonstrating cell purity after using FACS to isolate indicated APC subsets from fetal skin and spleen (18-22wk EGA), and adult spleen. n=4. b, Scatter plot of the log fold change in gene expression of cDC2 vs cDC1 from fetal and adult skin and spleen. R score = 0.92 and p-value < 2.2x10⁻¹⁶. Colors indicate genes upregulated (red) or downregulated (blue) in fetal and adult cDC1 relative to cDC2. c, Scatterplots demonstrating the expression profile of transcription factors important for APC development10, conserved across fetal (blue) and adult (red) spleen.
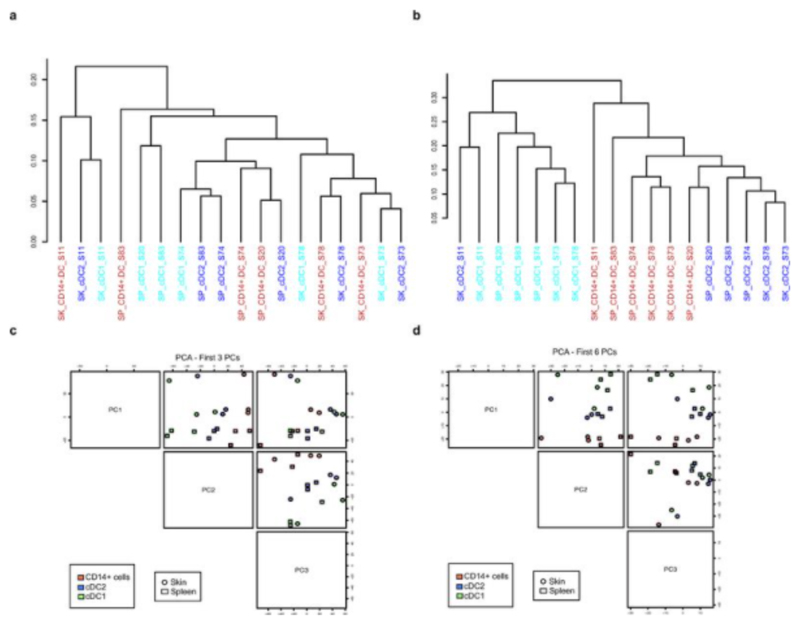
Extended Data Fig. 3. Fetal APC populations cluster based on subset after the removal of tissue specific probes.
a-d, Hierarchical clustering and PCA data before (a, c) and after (b, d) removal of tissue specific probes. It is clear from the hierarchical clustering (a) that there is strong tissue imprinting in the cells that overwhelms subtype specificity. Upon the removal of tissue specific probes, cells now cluster based on subtype (b). Also clearly from the PCA plots (c, d), we can see that prior to tissue gene removal (c), PC1 is entirely determined by tissue. However, upon tissue specific probe removal (d), PC1 is now devoted to cell type. We identified these tissue-specific genes by finding DEGs between the pools of all cells from the different tissues (all spleen vs. all skin).
Extended Data Fig. 4. Fetal and adult spleen cDC have similar phenotypes.
a, b, Characterization of cDC1 (green gate) and cDC2 (cyan gate) across adult and fetal spleen using CyTOF and one-Sense algorithm11. a, Representative gating strategy used to select input population (red gate) for One-Sense analysis from fetal (17wk EGA) and adult spleen samples. b, Representative data of fetal and adult spleen cDC analyzed using the one-Sense algorithm. The lineage dimension included CD1c and SIRPα as cDC2 markers, CD26 and CLEC9A as cDC1 markers. The marker dimension includes all the other non-lineage markers of the CyTOF panel. Frequency heat maps of markers expression are displayed for both dimensions. The expression of markers by both adult and fetal spleen cDC1 (green) and cDC2 (cyan) is highlighted with the dashed gates. Representative data from n=5 experiments.
Extended Data Fig. 5. Phenotypic characterisation of fetal spleen, thymus, lung and gut cDC.
a, Representative gating strategy used to select input population (red gate) for One-Sense analysis from fetal spleen, thymus, lung and gut (17wk EGA). b, Characterization of cDC1 (green gate) and cDC2 (cyan gate) across fetal lung, spleen, thymus and gut using CyTOF and one-Sense algorithm11. The lineage dimension included CD1c and SIRPα as cDC2 markers, CD26 and CLEC9A as cDC1 markers. The marker dimension includes all the other non-lineage markers of the CyTOF panel. Frequency heat maps of markers expression are displayed for both dimensions. The expression of markers by fetal cDC1 (green) and cDC2 (cyan) subsets are highlighted with the dashed gates. Representative data from n=5 experiments. c, Histograms displaying surface markers differentially expressed across fetal organs (17 wk EGA) but conserved from fetus to adult. The histograms are generated from CyTOF data (generated as described above). Data is representative of n=5 experiments. d, Fetal cDC1 (green gate) and cDC2 (blue gate) populations were identified within each organ based on their CD26 and CD1c expression (top panel) by flow cytometry analysis. Using the gates in the top panel to select fetal cDC1 (green contours) and cDC2 (blue contours), intracellular expression of IRF8 and IRF4 was determined by flow cytometry. Representative data. n=3.
Extended Data Fig. 6. Fetal cDC migrate to lymph nodes.
a, Representative plot of CD14+ cells (red gate), cDC1 (green gate) and cDC2 (blue gate) identified within the MLN-resident (Res) DC gate (top panel) and migratory (Mig) DC gate (bottom panel), from a 16wk EGA sample. b, Abundance of cDC1 and cDC2 plotted as a percentage of the total cDC within the resident (left plot) and migratory (right plot) fraction within the MLN from 16-22wk EGA n=5. c, Histograms comparing the expression of activation markers by resident (pink) and migratory (orange) cDC1 and cDC2. n=3. d, RNA from fetal gut and MLN were analysed for the expression of CCL19 and CCL21 from early (13- 15wk EGA) and late (16-20wk EGA) samples. n=3. e, Detection of the proteins CCL19 and CCL21 from lysed fetal gut cells by ELISA. f, Whole-mount immune-fluorescence microscopy of 17wk EGA fetal skin from 2 plains of view. Lymphatic vessels are labeled for LYVE-1 (red), APC are labeled for HLA-DR (green). White arrow indicates APC within lymphatic vessels. Scale bar represents 100μm (left image) and 150μm (right image). Representative image of n=3 experiments shown. g, Gating strategy used to identify CD14+ cells (red gate), cDC1 (green gate) and cDC2 (blue gate) within the supernatant from fetal skin explant left for 48 hours in culture and the digested remnant. Representative plots of n=3 experiments shown.
Extended Data Fig. 7. Fetal cDC are sensitive to low concentrations of TLR agonist stimuli.
a, Sort-purified fetal liver and adult spleen cDC2 were cultured with indicated TLR agonists for 18hrs. Cytokines produced were measured in the supernatants by Luminex assay. b, Heatmap of fetal and adult spleen APC populations of selected genes, including pathogen recognition receptors and co-stimulatory molecules. Heat map shows the row-based z-score normalized gene expression intensities.
Extended Data Fig. 8. Fetal cDC promote Treg induction.
a, b, Flow cytometry expression analysis of Tregs after 6 day co-culture of adult spleen T cells with fetal (n=5) or adult (n=4) spleen cDC2. a, b, The frequency of FOXP3+CD25+ Treg cells (a, red gate) and representative histograms showing intensity of CD127 and CTLA-4 expression by Tregs (red histograms) and respective isotype controls (grey histograms) are shown (b). c, Composite results showing the frequency of Treg cells plotted as percentage of CD4+ T cells, n≥4. d, Bar graph of proliferating CD8+ T cells after 6 days of adult spleen pan T cell co-culture with fetal (black, n=4) or adult (grey, n=4) spleen cDC2. Proliferation was measured by CFSE dilution. e, Proliferation of isolated adult spleen CD8+ T cells, after co-culture with fetal spleen cDC2 for 6 days. Left, representative histograms showing CFSE dilution by CD8+ T cells on day 0 (grey histogram) compared to day 6 with (red histogram) or without (black histogram) CD4+ T cell depletion. Right, cumulative data (n=4). Bar graphs show mean±s.e.m. *P<0.05, **P<0.01, Mann-Whitney test. f, Fetal spleen cDC1 and cDC2 share immune-suppressive properties. Cytokine detected in co-culture supernatants (mean±s.e.m) after T cell co-culture with fetal cDC1 or cDC2 or adult cDC2 (n=5). Statistical significance represents comparisons between indicated conditions measured by one-way Anova, multiple comparisons test. * P<0.05, ** P<0.01, ***P<0.001, ns (not significant) P>0.05.
Extended Data Fig. 9. Gene expression comparison between fetal and adult APC.
a, Heatmap showing the row-based z-score normalized gene expression intensities of 3,909 differentially expressed genes between fetal and adult APC. DEGs were identified using t-test with BH multiple testing corrected p-value of <0.05. The genes and cell populations were clustered using Pearson correlation distance measure and Complete Linkage method. b, Ingenuity™ Pathway Analysis (IPA) of the differentially-expressed genes (DEGs), >1.5 fold change, between fetal and adult APC. The bars indicate the p values (-log10) for pathway enrichment. The yellow squares indicate the ratio of the number of up- or down-regulated genes mapped to the enriched pathway, to the total number of molecules on that pathway represented by the dashed yellow line. The horizontal solid yellow line corresponds to the >1.5 fold change threshold. Red arrows highlight pathways involved in DC:T cell interactions, black arrows highlight pathways associated with iNOS/TNF-α signaling. c, Heatmap of immune-modulatory genes involved in cellular metabolism, immune suppression and the iNOS/TNF-α signaling. Heat map shows the row-based z-score normalized gene expression intensities. d, e Microarray (d) and flow cytometry (e) data demonstrating arginase-2 expression by fetal (blue, n=11) and adult (red, n=7) APC subsets. Isotype control, grey histogram and square on scatterplot (n=7). Mean frequencies ± s.e.m. f, Fetal and adult cDC2 arginase 2 expression is not mediated by TLR stimulation. Fetal liver and adult spleen cDC2 were sort-purified and stimulated with the indicated TLR agonists or DMSO control for 18hrs. cDC2 arginase 2 (Arg 2) expression was measured by flow cytometry. Mean frequencies ± s.e.m. One-way Anova, multiple comparisons test. ** P<0.01
Extended Data Fig. 10. Fetal cDC regulate T cell TNF-α production.
a, Ex-vivo splenocyte T cell (bulk tissue cells) and enriched spleen T cell TNF-α production, representative plots of n=4. b, Ex-vivo co-culture assay where fetal and adult splenocytes were cultured alone or at the indicated ratios of adult:fetal cells (n=3-4) for 6 days. TNF-α+ and Treg cells induction was determined by flow cytometry analysis. c – d, Scatterplots demonstrating the percentage of TNF-α+ T cells and Treg after the culture of splenocytes under the indicated conditions for 6 days. n≥3, mean±s.e.m. Statistical significance represents comparisons between indicated conditions measured by one-way anova, multiple comparisons test. * P<0.05, **P<0.01, ***P<0.001, ns P>0.05. e – h, Scatterplots demonstrating the percentage (e, f) and absolute cell counts (g, h) of TNF-α+ T cells and Treg after o/n culture of adult spleen T cells alone (n=6) or 6 day co-culture with fetal cDC2 in the absence (n=6) or the presence of L-arginine (n=6), ABH (n=4) or BEC (n=5). Statistical significance represents comparisons between indicated conditions measured by one-way Anova, multiple comparisons test. * P<0.05, ***P<0.001, ns P>0.05. i, Fetal DC arginase activity impacts T cell TNF-α production but not other pro-inflammatory cytokines. Cytokine detected in co-culture supernatants after adult spleen T cell co-culture with fetal cDC2 in the absence (n=5) or presence of L-arginine (1mM) (n=5), BEC (30μM) (n=3), ABH (30μM) (n=5) for 6 days (mean ± s.e.m n≥3). Statistical significance represents comparisons between indicated conditions measured by one-way Anova, multiple comparisons test. *P<0.05, **P<0.01 ns P>0.05. j, Adult spleen T cells were cultured overnight with the indicated of L-arginine, BEC and ABH (n=5). Representative flow cytometry of n=3 experiments. k, Cytokines detected in co-culture supernatants after adult spleen T cells were cultured alone (in the absence of DC) for 6 days with or without L-arginine (1mM) (n=5), BEC (30μM) (n=3), ABH (30μM) (n=4) (mean ± s.e.m n≥3). l, m, Fetal spleen cDC (pooled cDC1 and cDC2) and adult spleen cDC2 were cultured alone or in combination at the indicated ratios with adult spleen T cells for 6 days. T cell TNF-α production (k) and the expansion of Tregs (l) were assessed by flow cytometry. Statistical significance represents comparisons between indicated conditions measured by one-way Anova, multiple comparisons test. * P<0.05, ns P>0.05. Each data point in all the scatter plots represents an individual donor and experiment.
Supplementary Material
Acknowledgements
This work was supported by Singapore Immunology Network core (F.G and E.W.N), BMRC YIG (N.McG), Austrian Science Fund (P19474-B13, W1248-B30 to A.E-B), BMRC SPF2014/00 (S.A.), and the Singapore Ministry of Health’s National Medical Research Council (J.K.Y.C, CSIRG/1383/2014). We thank Dr L. Robinson of Insight Editing London for manuscript editing.
Footnotes
Data Availability
Source data for figure(s) [number(s)] are provided with the paper. Sequence data that support the findings of this study have been deposited to the Gene Expression Ominous (GEO) database under the accession numbers GSE35457, GSE85305, and GSE85304. Further data that support the findings of this study are available from the corresponding author upon reasonable request.
Author Contributions
Conceptualization, N.McG., F.G., J.K.Y.C.; Methodology, N.McG., A.S., G.L., D.L., L.J.T., R.M, I.L., N.B.S., H.R.S., E.S., J.L., E.M., S.H., P.S., B.J., C.S., A.E-B., X.N.W, E.W.N; Clinicians for helping to access samples and discussion,. E.H.K., Y.H.L., M.C., C.N.Z.M., Y.F., T.K.H.L., D.K.H, K-K.T., J.K.C.T., V.B, M.C, M.H, A.S, S.A, A.L, E.W.N; Bioinformatic analysis, N.McG., K.D., M.P., F.G.; Writing, N.McG., F.G., J.K.Y.C.
References
- 1.Mold JE, et al. Maternal alloantigens promote the development of tolerogenic fetal regulatory T cells in utero. Science. 2008;322:1562–1565. doi: 10.1126/science.1164511. [DOI] [PMC free article] [PubMed] [Google Scholar]
- 2.Claas FH, Gijbels Y, van der Velden-de Munck J, van Rood JJ. Induction of B cell unresponsiveness to noninherited maternal HLA antigens during fetal life. Science. 1988;241:1815–1817. doi: 10.1126/science.3051377. [DOI] [PubMed] [Google Scholar]
- 3.de Vries JI, Visser GH, Prechtl HF. The emergence of fetal behaviour. II. Quantitative aspects. Early Hum Dev. 1985;12:99–120. doi: 10.1016/0378-3782(85)90174-4. [DOI] [PubMed] [Google Scholar]
- 4.Mor G, Cardenas I. The immune system in pregnancy: a unique complexity. Am J Reprod Immunol. 2010;63:425–433. doi: 10.1111/j.1600-0897.2010.00836.x. [DOI] [PMC free article] [PubMed] [Google Scholar]
- 5.Campbell DE, Boyle RJ, Thornton CA, Prescott SL. Mechanisms of allergic disease - environmental and genetic determinants for the development of allergy. Clin Exp Allergy. 2015;45:844–858. doi: 10.1111/cea.12531. [DOI] [PubMed] [Google Scholar]
- 6.Aagaard K, et al. The placenta harbors a unique microbiome. Sci Transl Med. 2014;6:237ra65–237ra65. doi: 10.1126/scitranslmed.3008599. [DOI] [PMC free article] [PubMed] [Google Scholar]
- 7.Haniffa M, et al. Human tissues contain CD141hi cross-presenting dendritic cells with functional homology to mouse CD103+ nonlymphoid dendritic cells. Immunity. 2012;37:60–73. doi: 10.1016/j.immuni.2012.04.012. [DOI] [PMC free article] [PubMed] [Google Scholar]
- 8.McGovern N, et al. Human Dermal CD14(+) Cells Are a Transient Population of Monocyte-Derived Macrophages. Immunity. 2014;41:465–477. doi: 10.1016/j.immuni.2014.08.006. [DOI] [PMC free article] [PubMed] [Google Scholar]
- 9.Schuster C, et al. HLA-DR+ leukocytes acquire CD1 antigens in embryonic and fetal human skin and contain functional antigen-presenting cells. Journal of Experimental Medicine. 2009;206:169–181. doi: 10.1084/jem.20081747. [DOI] [PMC free article] [PubMed] [Google Scholar]
- 10.Schlitzer A, McGovern N, Ginhoux F. Dendritic cells and monocyte-derived cells: Two complementary and integrated functional systems. Semin Cell Dev Biol. 2015;41:9–22. doi: 10.1016/j.semcdb.2015.03.011. [DOI] [PubMed] [Google Scholar]
- 11.Cheng Y, Wong MT, van der Maaten L, Newell EW. Categorical Analysis of Human T Cell Heterogeneity with One-Dimensional Soli-Expression by Nonlinear Stochastic Embedding. The Journal of Immunology. 2016;196:924–932. doi: 10.4049/jimmunol.1501928. [DOI] [PMC free article] [PubMed] [Google Scholar]
- 12.Guilliams M, et al. Unsupervised High-Dimensional Analysis Aligns Dendritic Cells across Tissues and Species. Immunity. 2016;45:669–684. doi: 10.1016/j.immuni.2016.08.015. [DOI] [PMC free article] [PubMed] [Google Scholar]
- 13.Ohl L, et al. CCR7 governs skin dendritic cell migration under inflammatory and steady-state conditions. Immunity. 2004;21:279–288. doi: 10.1016/j.immuni.2004.06.014. [DOI] [PubMed] [Google Scholar]
- 14.Förster R, Davalos-Misslitz AC, Rot A. CCR7 and its ligands: balancing immunity and tolerance. Nat Rev Immunol. 2008;8:362–371. doi: 10.1038/nri2297. [DOI] [PubMed] [Google Scholar]
- 15.Wang XN, et al. A Three-Dimensional Atlas of Human Dermal Leukocytes, Lymphatics, and Blood Vessels. J Investig Dermatol. 2013 doi: 10.1038/jid.2013.481. [DOI] [PMC free article] [PubMed] [Google Scholar]
- 16.Haynes BF, Heinly CS. Early human T cell development: analysis of the human thymus at the time of initial entry of hematopoietic stem cells into the fetal thymic microenvironment. The Journal of Experimental Medicine. 1995;181:1445–1458. doi: 10.1084/jem.181.4.1445. [DOI] [PMC free article] [PubMed] [Google Scholar]
- 17.Schuster C, et al. Development of Blood and Lymphatic Endothelial Cells in Embryonic and Fetal Human Skin. The American journal of pathology. 2015;185:2563–2574. doi: 10.1016/j.ajpath.2015.05.006. [DOI] [PubMed] [Google Scholar]
- 18.Tong X. Amniotic fluid may act as a transporting pathway for signaling molecules and stem cells during the embryonic development of amniotes. J Chin Med Assoc. 2013;76:606–610. doi: 10.1016/j.jcma.2013.07.006. [DOI] [PubMed] [Google Scholar]
- 19.Burlingham WJ, et al. The effect of tolerance to noninherited maternal HLA antigens on the survival of renal transplants from sibling donors. N Engl J Med. 1998;339:1657–1664. doi: 10.1056/NEJM199812033392302. [DOI] [PubMed] [Google Scholar]
- 20.Liu W, et al. CD127 expression inversely correlates with FoxP3 and suppressive function of human CD4+ T reg cells. The Journal of Experimental Medicine. 2006;203:1701–1711. doi: 10.1084/jem.20060772. [DOI] [PMC free article] [PubMed] [Google Scholar]
- 21.Seddiki N, et al. Expression of interleukin (IL)-2 and IL-7 receptors discriminates between human regulatory and activated T cells. The Journal of Experimental Medicine. 2006;203:1693–1700. doi: 10.1084/jem.20060468. [DOI] [PMC free article] [PubMed] [Google Scholar]
- 22.Elahi S, et al. Immunosuppressive CD71+ erythroid cells compromise neonatal host defence against infection. Nature. 2013;504:158–162. doi: 10.1038/nature12675. [DOI] [PMC free article] [PubMed] [Google Scholar]
- 23.Morris SM. Arginine: master and commander in innate immune responses. Sci Signal. 2010;3:pe27. doi: 10.1126/scisignal.3135pe27. [DOI] [PubMed] [Google Scholar]
- 24.Geiger R, et al. L-Arginine Modulates T Cell Metabolism and Enhances Survival and Anti-tumor Activity. Cell. 2016;167:829–842.e13. doi: 10.1016/j.cell.2016.09.031. [DOI] [PMC free article] [PubMed] [Google Scholar]
- 25.Ivarsson MA, et al. Differentiation and functional regulation of human fetal NK cells. The Journal of Clinical Investigation. 2013;123:3889–3901. doi: 10.1172/JCI68989. [DOI] [PMC free article] [PubMed] [Google Scholar]
- 26.J P. Review of the guidance on the research use of fetuses and fetal material. 1989 [Google Scholar]
- 27.Schlitzer A, et al. IRF4 transcription factor-dependent CD11b+ dendritic cells in human and mouse control mucosal IL-17 cytokine responses. Immunity. 2013;38:970–983. doi: 10.1016/j.immuni.2013.04.011. [DOI] [PMC free article] [PubMed] [Google Scholar]
- 28.Benjamini Y, Drai D, Elmer G, Kafkafi N, Golani I. Controlling the false discovery rate in behavior genetics research. Behav Brain Res. 2001;125:279–284. doi: 10.1016/s0166-4328(01)00297-2. [DOI] [PubMed] [Google Scholar]
- 29.Breitling R, Armengaud P, Amtmann A, Herzyk P. Rank products: a simple, yet powerful, new method to detect differentially regulated genes in replicated microarray experiments. FEBS Lett. 2004;573:83–92. doi: 10.1016/j.febslet.2004.07.055. [DOI] [PubMed] [Google Scholar]
Associated Data
This section collects any data citations, data availability statements, or supplementary materials included in this article.


