Abstract
Background
Long non-coding RNAs (lncRNAs) perform crucial roles in biological process involving complex mechanisms. However, information regarding their abundance, characteristics and potential functions linked to fish skin color is limited. Herein, Illumina sequencing and bioinformatics were conducted on black, white, and red skin of Koi carp (Cyprinus carpio L.).
Results
A total of 590,415,050 clean reads, 446,614 putative transcripts, 4252 known and 72,907 novel lncRNAs were simultaneously obtained, including 92 significant differentially expressed lncRNAs and 722 mRNAs. Ccr_lnc5622441 and Ccr_lnc765201 were up-regulated in black and red skin, Ccr_lnc14074601 and Ccr_lnc2382951 were up-regulated in white skin, and premelanosome protein a (Pmela), Pmelb and tyrosinase (Tyr) were up-regulated in black skin. The expression patterns of 18 randomly selected differentially expressed genes were validated using the quantitative real-time PCR method. Moreover, 70 lncRNAs acting on 107 target mRNAs in cis and 79 lncRNAs acting on 41,625 target mRNAs in trans were investigated. The resulting co-expression networks revealed that a single lncRNA can connect with numerous mRNAs, and vice versa. To further reveal their potential functions, Gene Ontology (GO) terms and Kyoto Encyclopedia of Genes and Genomes (KEGG) pathways were analyzed, and membrane, pigment cell development, cAMP signaling, melanogenesis and tyrosine metabolism appear to affect skin pigmentation. Additionally, three lncRNAs (Ccr_lnc142711, Ccr_lnc17214525 and Ccr_lnc14830101) and three mRNAs (Asip, Mitf and Tyr) involved in the melanogenesis pathway were investigated in terms of potential functions in embryogenesis and different tissues.
Conclusions
The findings broaden our understanding of lncRNAs and skin color genetics, and provide new insight into the mechanisms underlying lncRNA-mediated pigmentation and differentiation in Koi carp.
Electronic supplementary material
The online version of this article (10.1186/s12864-019-5894-8) contains supplementary material, which is available to authorized users.
Keywords: LncRNA, mRNA, Skin color, Function annotation, Koi carp, Illumina sequencing
Background
Non-coding RNAs (ncRNAs), which are not translated into proteins but play vital roles in various biological processes, are receiving increasing attention [1]. Among them, long non-coding RNAs (lncRNAs), defined as transcripts longer than 200 nucleotides and lacking protein-coding capacity, have emerged as essential mediators in numerous biological functions [2]. LncRNAs positively regulate gene expression at different levels, including transcriptional and posttranscriptional regulation, and chromosome remodeling [3]. Through these actions, lncRNAs typically function in protein localization, telomere replication and RNA interference [4]. With next-generation high-throughput RNA sequencing techniques and computational analysis, thousands of lncRNA transcripts have been identified through systematic sequencing of full-length cDNA libraries in many species, such as Homo sapiens [5], Rattus norvegicus [6], Salmo salar [7] and Danio rerio [8].
Recently, lncRNAs have also been suggested to perform a crucial role in regulating skin. Researchers have discovered several lncRNAs associated with skin biology such as BANCR, ANCR, U1 RNA and PRINS [9]. A series of well-known oncogenes including H19, H19-as, Foxn2-as and Hottip function in vitamin D receptor protection against skin cancer formation by helping to maintain the balance between oncogenic and tumor-suppressing lncRNAs [10]. Ren et al. identified 1336 lncRNAs in goat fetal skin and investigated significant differences in gene architecture, expression levels, and impact on target genes in cis and trans [11]. Weikard et al. demonstrated a complex transcript pattern for bovine skin and identified 4365 potential intergenic lncRNAs in bulls with a piebald phenotype [12]. To our knowledge, there have been no reports describing the involvement of lncRNAs in skin color pigmentation and differentiation in fish.
Koi carp, a colorful variant of common carp (Cyprinus carpio L.), is one of the most important ornamental fish worldwide with great economic value [13]. Some individuals display fascinating skin color patterns that play important roles in numerous biological processes including mate-choice, camouflage, and perception of threatening behavior [14, 15]. Skin color regulation in fish is a complicated process, linked to various cellular, genetic, nutritional, and environmental factors [16]. In Koi carp, much attention has been paid to skin color regulation, including the genetics of pigment patterning [17], cloning of color-related genes, functional analysis [18, 19], environmental factors [20], nutrition [21] and transcriptome analysis [22]. However, lncRNA-mediated regulatory mechanisms related to skin color have not been reported.
In our previous study, we performed small RNA sequencing (sRNA-Seq) on three skin colors (black, white and red) in Koi carp using Illumina sequencing. We screened 164 differentially expressed miRNAs and identified several key miRNAs related to pigment regulation including miR-196a, miR-200b, miR-125b and miR-202 [23]. In the present study, we conducted a high-throughput sequencing strategy to screen expression of lncRNAs and mRNAs in these three skin colors. Differentially expression patterns were validated using qRT-PCR to confirm the results of RNA-seq. Putative target mRNAs of lncRNAs in cis and trans were predicted, and we selected candidate lncRNAs and mRNAs that are highly likely affect skin pigmentation to construct coding/non-coding gene co-expression diagrams. Moreover, we also analyzed the Gene Ontology (GO) terms and Kyoto Encyclopedia of Genes and Genomes (KEGG) pathways to excavate the function roles of genes in the determination of skin color. Spatial and temporal expression patterns of some lncRNAs and mRNAs involved in the melanogenesis pathway were further analyzed, indicating that these genes have strict tissue specificity during skin development and pigmentation. Our findings provide an invaluable resource for understanding the genetics of skin color in fish, and expand our knowledge on lncRNA biology in general in Koi carp.
Results
Identification of lncRNAs in koi carp skin
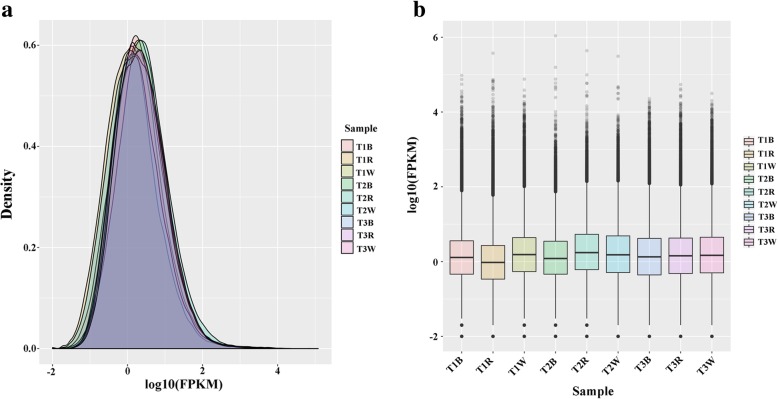
A total of 612,253,232 raw reads were excavated from the nine sequencing libraries. After discarding adaptor and low-quality sequences, 590,415,050 clean reads remained, and the percentage of clean reads among raw tags in each library ranged from 95.83–96.95% (Additional file 2). The quality of transcript expression level measurements was checked by density plots for each sample (Fig. 1a) and the distribution of maximum, minimum, and percentile values for normalized signals for each sample (Fig. 1b). Subsequently, clean reads were mapped to the C. carpio v3.0 reference genome, resulting in 446,614 putative transcripts (Table 1). Several filtering steps were applied to screen lncRNAs in the transcript list by removing protein-coding transcripts, pseudogenes, and other classes of non-coding RNAs including ribosomal RNA (rRNA), microRNA (miRNA), transfer ribonucleic acid (tRNA). We identified 77,159 expressed lncRNAs, of which 4252 (5.5%) were previously annotated and 72,907 (94.5%) were novel lncRNAs (Additional file 3).
Fig. 1.
a Density plot showing the distribution of each sample. b Box plot showing the distribution of maximum, minimum and percentile values for normalized signals of each sample
Table 1.
Summary of Koi carp sequencing data
| Item | Value |
|---|---|
| Total number of sequences | 698,058 |
| Total number of genes | 446,614 |
| Total base of sequences (Mb) | 644 |
| Maximum sequence length (bp) | 17,984 |
| Minimum sequence length (bp) | 200 |
| Average sequence length (bp) | 922.82 |
| Median contig length (bp) | 616 |
| N50 (bp) | 1328 |
| Percent GC (%) | 43.55 |
Expression profiling of lncRNAs and mRNAs
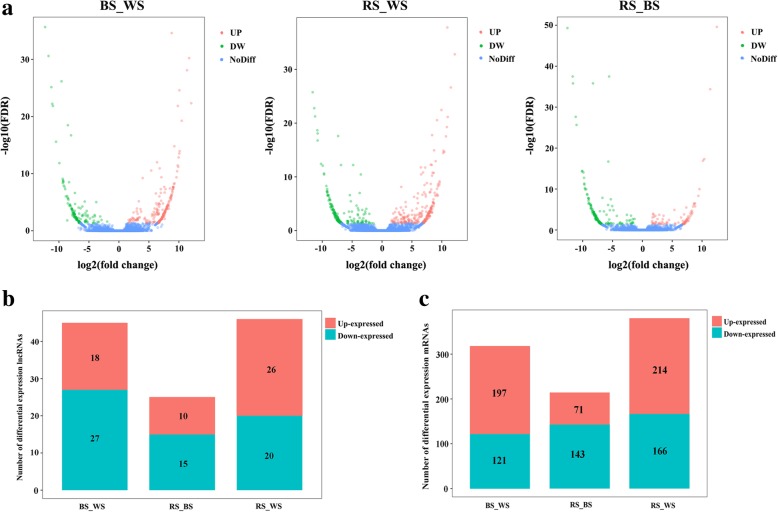
A total of 722 mRNAs and 92 lncRNAs were identified as significant, and volcano plots of three pairwise comparisons were plotted to reveal expression trends (Fig. 2a). Among differentially expressed (DE) lncRNAs, 18 were up-regulated and 27 were down-regulated in BS compared with WS; 10 lncRNAs were up-regulated and 15 were down-regulated in RS compared with BS; and 26 lncRNAs were up-regulated and 20 were down-regulated in RS compared with WS (Fig. 2b). Furthermore, among DE mRNAs, 197 mRNAs were up-regulated and 121 were down-regulated between BS and WS, 71 mRNAs were up-regulated and 143 were down-regulated between RS and BS, and 214 mRNAs were up-regulated and 166 were down-regulated between RS and WS (Fig. 2c). The proportion of significantly DE lncRNAs and mRNAs reflects their specific functions, and detailed lists of all genes are provided in Additional file 4.
Fig. 2.
Differentially expressed genes in the three pairwise comparison groups. a Volcano plots of all genes in the three pairwise comparisons. Blue, red and green dots represent non-significant, up- and down-regulated genes, respectively; b Brown and cyan indicate the number of significant up- and down-regulated lncRNAs, respectively; c Brown and cyan indicate the number of significant up- and down-regulated mRNAs, respectively
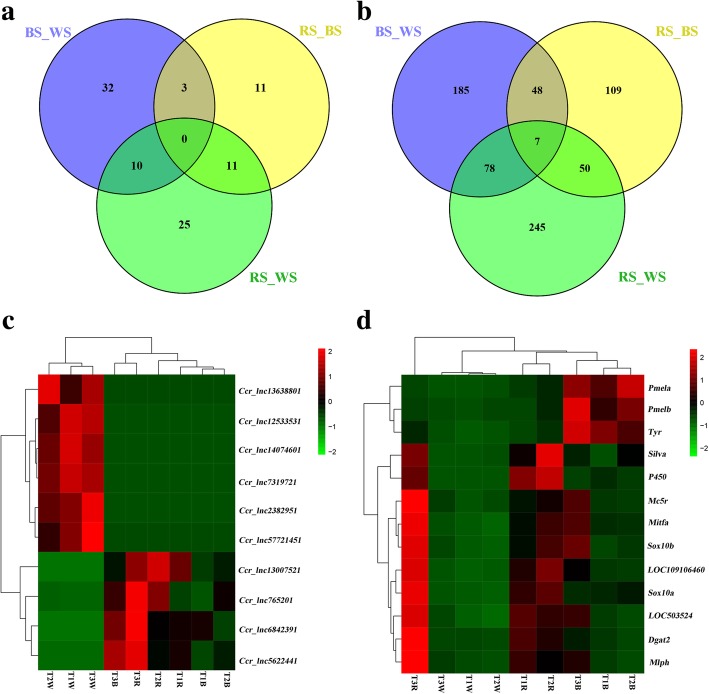
Venn 2.1 (http://bioinfogp.cnb.csic.es/tools/venny/index.html) was employed to further visually compare gene expression. Among the lncRNAs, 11 known and 81 novel lncRNAs were identified, and 10 lncRNAs were DE in both RS and BS groups compared with the WS group (Fig. 3a). Meanwhile, 722 mRNAs including seven overlapping sequences were also identified, and 85 mRNAs were DE in both RS and BS groups compared with the WS group (Fig. 3b). Ten lncRNAs and 13 mRNAs (randomly selected from the 85 mRNAs) were chosen for plotting heatmaps. Hierarchical clustering allowed us to hypothesize relationships among these genes, and the 10 DE lncRNAs (Fig. 3c) and 13 mRNAs (Fig. 3d) presented different expression patterns. For example, Ccr_lnc5622441, Ccr_lnc765201, Ccr_lnc6842391 and Ccr_lnc13007521 were up-regulated in RS and BS groups compared with the WS group, and Pmela, Pmelb and Tyr were up-regulated in BS compared with RS and WS.
Fig. 3.
a Venn diagram of differentially expressed lncRNAs in the three pairwise comparison groups; b Venn diagram of differentially expressed mRNAs in the three pairwise comparison groups; c Heatmaps and hierarchical clustering of 10 selected lncRNAs. d Heatmaps and hierarchical clustering of 13 randomly selected mRNAs. High to low expression is colored green to red
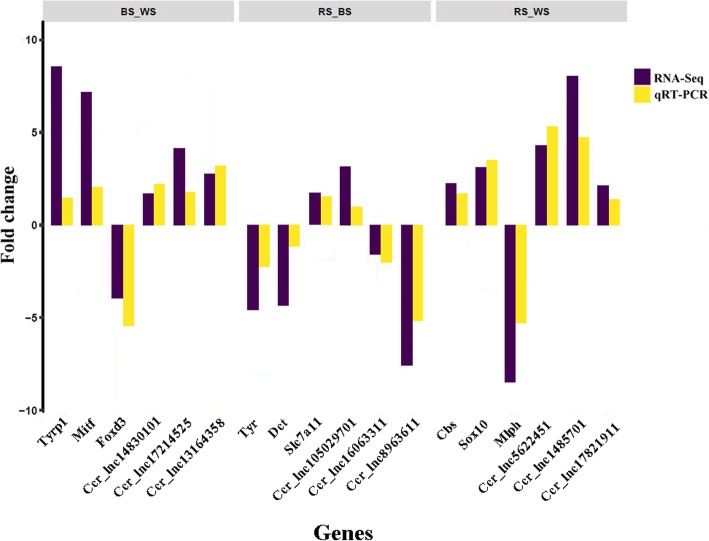
To further confirm the reliability and validity of the sequencing data, we randomly selected nine significant DE mRNAs and nine DE lncRNAs for analysis by qRT-PCR. The result showed that the qRT-PCR expression patterns were in complete agreement with the RNA-seq results, indicating that the RNA-seq data was reliable (Fig. 4). For example, based on the RNA-seq results, expression of Sox10 in RS was almost 2.8 times higher than in WS, compared with a 3.2-fold difference according to qRT-PCR.
Fig. 4.
Relative expression levels of genes measured using quantitative real-time PCR (qRT-PCR) and Illumina sequencing (RNA-seq) in the three comparative groups
GO and KEGG enrichment of differentially expressed mRNAs
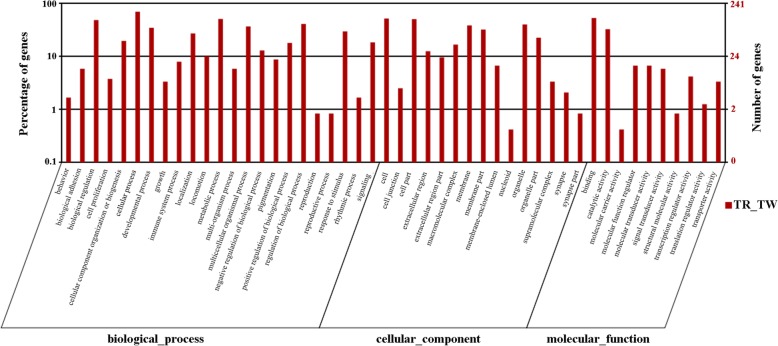
To further explore the potential functions of 722 significant DE mRNAs, we analyzed the associated functions using the GO database. As shown in Figs. 5, 48 terms were assigned including 23 (47.92%) biological process, 15 (31.25%) cellular component and 10 (20.83%) molecular function categories in RS vs. WS. The results of all comparisons are presented in Additional file 5: Figure S3 and S4). The results showed that the most highly enriched terms were membrane (cellular component), binding (molecular function), and cellular process (biological process). Moreover, we identified some differently enriched terms in the three comparisons. For example, melanosome in cellular component and melanosome organization in biological process were more highly enriched in BS_WS and RS_BS groups than the RS_WS group. Detailed results are provided in Additional file 5.
Fig. 5.
Gene Ontology (GO) enrichment analysis of significant differentially expressed mRNAs in RS and WS groups
In the KEGG pathway analysis of DE mRNAs, p-value denotes significance, with lower p-values indicating greater significance (the p-value cut-off determining significance was 0.05). The top 10 enriched pathways are presented in Table 2. Interestingly, some pathways, including melanogenesis and tyrosine metabolism, were more highly enriched in RS_BS and BS_WS groups than RS_WS, while tight junction was more highly enriched in the RS_WS comparisons. All 206 pathways identified in the three comparisons are presented in Additional file 5.
Table 2.
The top ten KEGG pathways related to differentially expressed mRNAs in the three comparative groups
| RS_WS group | RS_BS group | BS_WS group |
|---|---|---|
| Tight junction | Melanogenesis | Melanogenesis |
| Osteoclast differentiation | Tyrosine metabolism | Tyrosine metabolism |
| Pathways in cancer | Hypertrophic cardiomyopathy (HCM) | Neuroactive ligand-receptor interaction |
| Neuroactive ligand-receptor interaction | Dilated cardiomyopathy | Ether lipid metabolism |
| Fat digestion and absorption | Cardiac muscle contraction | Glycerophospholipid metabolism |
| Retinol metabolism | Circadian entrainment | Osteoclast differentiation |
| Viral myocarditis | Adrenergic signaling in cardiomyocytes | Linoleic acid metabolism |
| Cardiac muscle contraction | Fatty acid degradation | alpha-Linolenic acid metabolism |
| Cytokine-cytokine receptor interaction | Fatty acid metabolism | Retinol metabolism |
| Ras signaling pathway | Cell adhesion molecules (CAMs) | Arachidonic acid metabolism |
Cis and trans role of lncRNAs
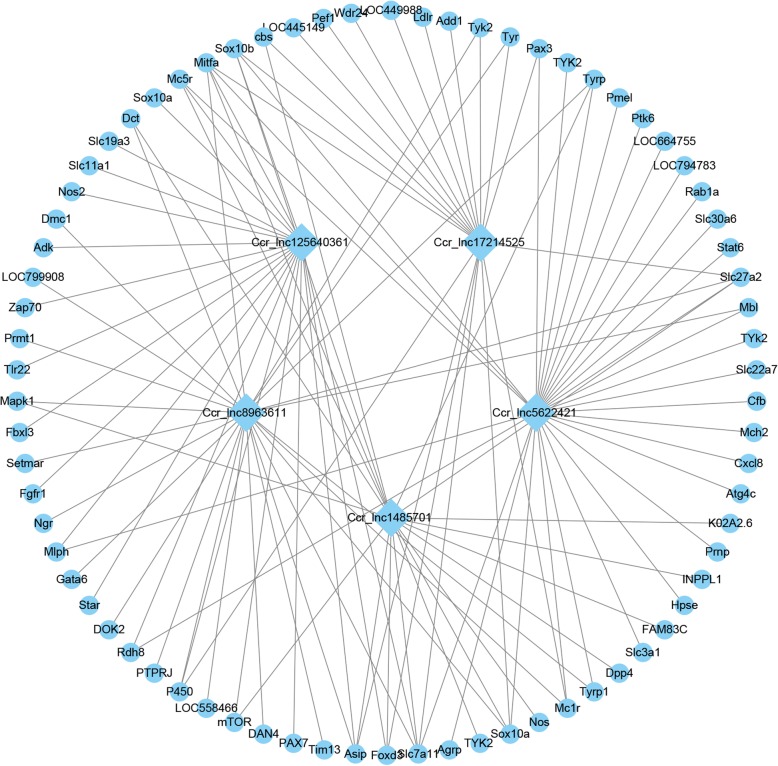
The potential cis and trans targets of lncRNAs were predicted to investigate the functions of 92 DE lncRNAs. Regarding cis action, 70 DE lncRNAs corresponded to 107 protein-coding genes (Additional file 6). Among them, the skin color-related genes such as Wnt3a, Slc45a2 and Mitf located near the Ccr_lnc8247101, Ccr_lnc13638801 and Ccr_lnc17821911 loci, respectively. GO term and KEGG pathway analysis were also conducted on 107 cis lncRNA targets to explore their functions (Additional file 6). A total of 41,625 interactions were identified for trans actions between 79 lncRNAs and protein-coding genes (Additional file 7). The interaction networks are quite complex, with some trans-regulation relationships evident (Fig. 6). For example, some mRNAs (Mitfa, Slc7a11 and Sox10a) appear to be regulated by multiple lncRNAs (Ccr_lnc8963611, Ccr_lnc1485701 and others), and one lncRNA (Ccr_lnc5622421) can target many mRNAs (Tyk2, Mc1r, Tyrp1 and others).
Fig. 6.
Networks analysis of putative interactions between five selected lncRNAs and trans-regulated mRNAs related to the pigmentation process. Square and circular nodes represent lncRNAs and protein-coding genes, respectively
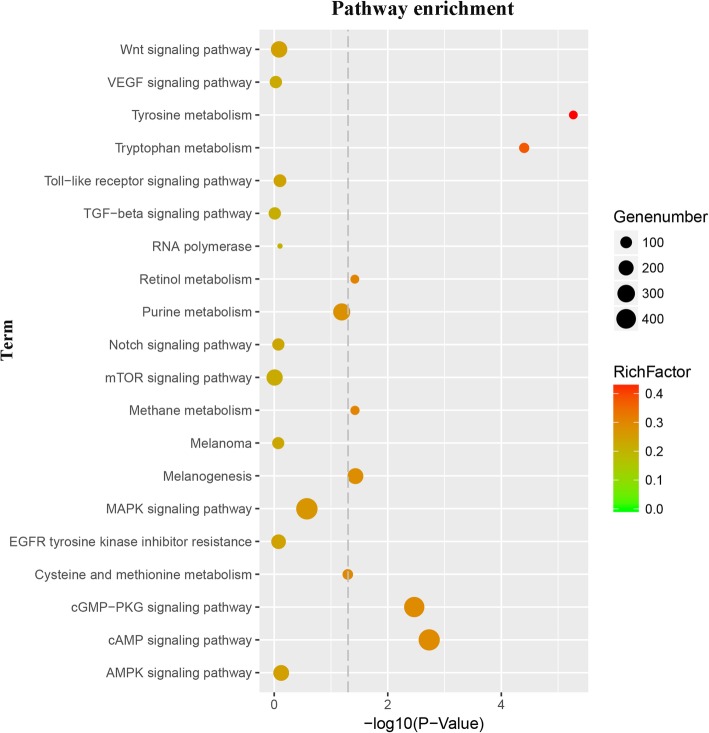
We further analyzed these trans-targeted mRNA functions, and 6139 GO terms and 355 KEGG pathways were identified (Additional file 7). These include a number of terms related to pigment regulation, such as protein tyrosine kinase activity, retinal pigment epithelium development, pigment cell development, and melanin metabolic process. Importantly, we also identified some pathways related to pigmentation, including cAMP, Wnt, MAPK signaling pathways, melanogenesis, and tyrosine metabolism (Fig. 7).
Fig. 7.
Predicted pigmentation-related pathways of trans-target mRNAs based on Kyoto Encyclopedia of Genes and Genomes (KEGG) pathway analysis. Gene number, number of target genes in each pathway; Rich factor, ratio of the number of target genes divided by the total number of genes in each pathway
We also identified some key lncRNAs and target mRNAs related to the melanogenesis pathway (Table 3). The results showed that Mitf and Wnt3a genes, which are known to play crucial roles in skin color pigmentation, were linked to both cis and trans actions. Furthermore, we selected three lncRNAs (Ccr_lnc142711, Ccr_lnc17214525 and Ccr_lnc14830101) and three mRNAs (Asip, Mitf and Tyr) to analyze their spatial and temporal expression characteristics. The results indicate that expression is tightly regulated in a time- and space-dependent manner. Ccr_lnc142711, Ccr_lnc17214525, Asip and Tyr were strongly expressed in gastrula, neurula and organogenesis stages, and Mitf expression was substantially up-regulated in gastrula and neurula stages, and after 20 days post-hatching (Fig. 8). In addition, we examined their expression profiles in different tissues of Koi carp. Interestingly, we found that Ccr_lnc142711 and Ccr_lnc148301 abundantly expressed in kidney, brain, blood, eye and gut, whereas Ccr_lnc17214525 abundantly expressed in white skin and eye tissue (Additional file 8: Figure S3A). Expression of Asip was up-regulated in white skin, red skin, kidney, brain, eye, gonad and gut, and Mitf highly expressed in kidney, blood, eye and gut, whereas Tyr is abundantly expressed in black skin, eye and muscle (Additional file 8: Figure S3B).
Table 3.
LncRNAs and their potential target genes involved in melanogenesis
| Protein-coding genes | lncRNAs in cis | lncRNAs in trans |
|---|---|---|
| Mitf | Ccr_lnc17821911 | Ccr_lnc125640361, Ccr_lnc1485701, Ccr_lnc5622421, Ccr_lnc17214525, Ccr_lnc8963611 |
| Wnt3a | Ccr_lnc8247101 | Ccr_lnc105029701, Ccr_lnc1134941511, Ccr_lnc1442012, Ccr_lnc2059601, Ccr_lnc6033401, Ccr_lnc105029701 |
| Tyr | Ccr_lnc17214525, Ccr_lnc14830101, Ccr_lnc8963611 | |
| Tyrp1 | Ccr_lnc16301123, Ccr_lnc5622441, Ccr_lnc8963611, Ccr_lnc822721141 | |
| Asip | Ccr_lnc1485701, Ccr_lnc17214525, Ccr_lnc142711, Ccr_lnc113494151, Ccr_lnc11354001, Ccr_lnc8963611 | |
| Sox10 | Ccr_lnc125640361, Ccr_lnc1485701, Ccr_lnc5622421, Ccr_lnc7090801, Ccr_lnc5622421,Ccr_lnc17214525 | |
| Tyk2 | Ccr_lnc1134941511, Ccr_lnc11354001, Ccr_lnc15278331, Ccr_lnc11354001, Ccr_lnc12754831, Ccr_lnc12757551, Ccr_lnc131643581, Ccr_lnc14074601, Ccr_lnc14419221, Ccr_lnc14420121, Ccr_lnc14420301, Ccr_lnc147974311, Ccr_lnc17632401, Ccr_lnc175284642, Ccr_lnc3111401 |
Fig. 8.
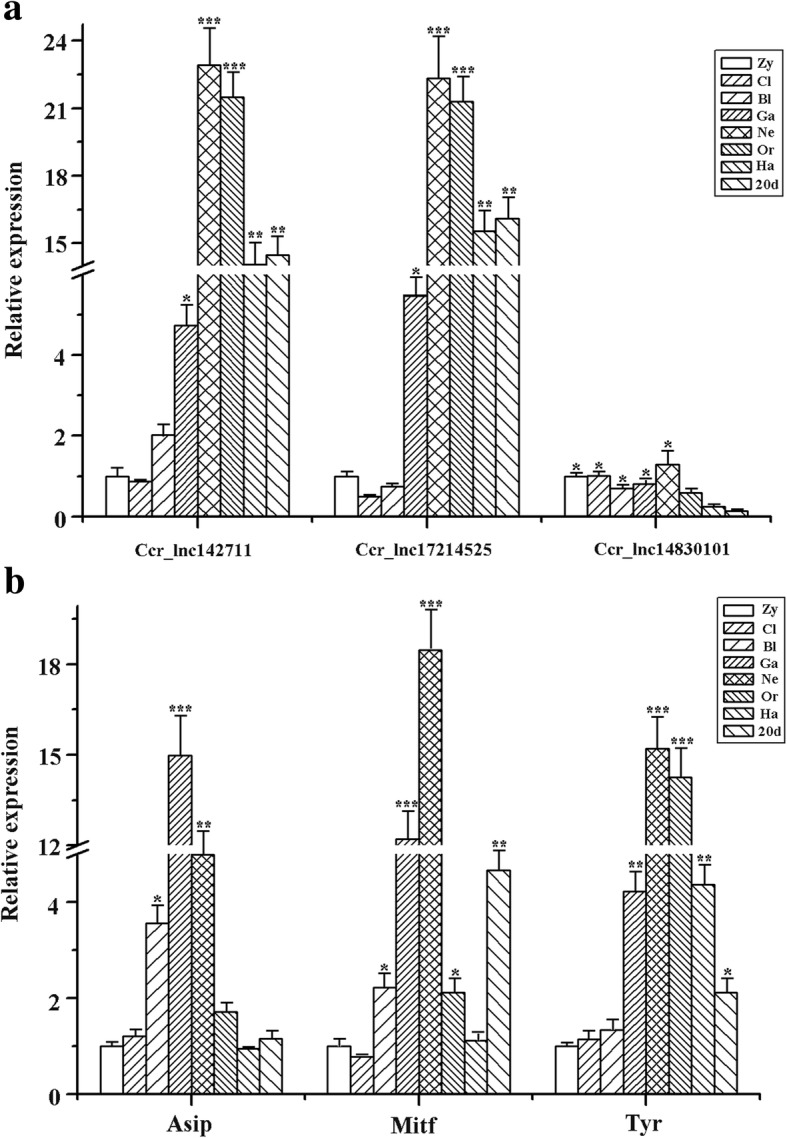
Overview of expression pattern of three lncRNAs (a) and three mRNAs (b) involved in melanogenesis pathway during the early stage of Koi carp. Zy, zygote; Cl, cleavage; BL, blastula; Ga, gastrula; Ne, neurula; Or, organogenesis; Ha, hatching; 20pdh, 20 days post-hatching.* p < 0.05, ** p < 0.01, *** p < 0.001
Discussion
Koi carp are among the most popular ornamental fish worldwide, the body color and skin pattern is closely correlated with market value [36]. Thus, the mechanism of skin color regulation has been investigated, including transcriptomic analysis of pigment-associated genes [37, 38]. In our previous study, we identified important miRNAs (e.g. miR-196a, miR-125b, miR-200b and miR-206) that influence pigmentation and differentiation in the three main skin colors [23]. Despite an abundance of literature on tissue-specific expression patterns and functions of mRNAs and miRNAs in fish, evidence for tissue-restricted expression of lncRNAs is limited. However, in plants and non-fish animals, evidence suggests that some lncRNAs display strict cell specificity and play a key role in development and differentiation of tissues [39, 40]. Therefore, in an effort to better understand the influence of lncRNAs on mRNA functions and related regulatory mechanisms in Koi carp, we elucidated lncRNA profiles of three different phenotypes involved in skin pigmentation and differentiation using Illumina sequencing technology.
In the current study, 446,614 putative transcripts were obtained, including 4252 known and 72,907 novel lncRNAs, tremendously enriching the pool of lncRNAs correlated with fish skin. Expression of lncRNAs can be tissue-specific, and differential expression is widespread in a variety of organisms [41–43]. To gain insight into the expression of skin color-related genes in Koi carp, we determined expression profiles, and identified 92 DE lncRNAs and 722 DE mRNAs through pairwise comparison. Interestingly, levels of tyr, pmela, pmelb and sex determining region Y-box 10 (sox10) were high in black skin compared with red and white skin, which implied that these genes contribute to black coloration. These expression trends and characteristics are similar to those in tilapia and other vertebrate species [44, 45]. We also identified some specific lncRNAs such as Ccr_lnc5622441 and Ccr_lnc765201 that were up-regulated in RS and BS groups compared to WS, while Ccr_lnc14074601 and Ccr_lnc2382951 were up-regulated in WS. However, more integrative experiments are needed to further explore their functional mechanisms related to skin color regulation. Verification by qRT-PCR confirmed the reliability of the RNA-seq data and the lncRNAs and mRNAs identified. Additionally, several previous studies support our results. For example, we found that expression of microphthalmia-associated transcription factor (mitf) was higher in BS than WS, and a previous study confirmed that mitf is a member of the basic helix-loop-helix leucine zipper (bHLH-Zip) protein family and directly regulates the differentiation of melanin cells by controlling the expression of tyrosine gene families [46, 47].
LncRNAs can function through cis-regulation of nearby protein-coding genes [48]. Only a few lncRNAs have been defined as cis-regulators, and most functionally annotated lncRNAs are trans-regulators [49]. In our study, DE lncRNAs were divided into two categories (cis or trans-regulatory genes) to explore potential target mRNAs. The results revealed that 70 lncRNAs corresponded to 107 protein-coding genes via cis regulation, and 79 lncRNAs corresponded to 41,625 protein-coding genes through trans regulation. Notably, Mitf and Wnt3a, both members of the Wnt family, were found to be regulated by lncRNAs both in cis (Ccr_lnc17821911) and in trans (Ccr_lnc125640361, Ccr_lnc1485701 and others) in the melanogenesis pathway. These findings indicate that lncRNAs are highly functionally conserved, similar to their target Wnt signaling protein [50], although their regulatory mechanisms need to be further investigated. In addition, a number of lncRNAs acting in trans were found to target protein-coding genes specifically expressed in melanocytes, including Tyr, Tyrp1, P450 and Sox10. For example, Ccr_lnc8963611 acts on both Tyr and Tyrp1, which evolved from a common ancestral tyrosinase gene [51, 52]. A third interesting observation is that some mRNAs (Mitfa, Slc7a11 and others) are regulated by multiple lncRNAs (e.g. Ccr_lnc8963611 and Ccr_lnc1485701), and a single lncRNA (Ccr_lnc5622421) can target many mRNAs (Mc1r and Tyrp1). This indicates the functional complexity of lncRNAs. Therefore, we screened some DE cis- and trans-acting lncRNAs that function on genes related to pigmentation. However, these putative connections and interactions are based on theoretical analysis, and experimental verification is required.
Some pathways related to pigmentation have been identified, including cAMP [53], melanogenesis [54], Wnt [55], SCF-KIT [56], Notch [57], FGF/MAPK/Ets [58], MITF-GPNMB [59], CREB/MITF/Tyrosinase [60] and protein kinase C signaling pathway [61]. However, information on the roles of lncRNAs in pigmentation and differentiation in fish remains scarce. Methods for lncRNA function prediction can correlate protein-coding genes and their related biological pathways [62]. In our present study, we analyzed these cis target genes of DE lncRNAs enriched in 91 KEGG pathways, and the trans target genes enriched in 355 KEGG pathways. Some key pathways associated with pigmentation are enriched, including Wnt, cAMP and melanoma signaling pathways, as well as tyrosine metabolism. This strongly indicates that these pathways play essential roles in determining the three different skin colors.
To gain insight into the functions of some lncRNAs and mRNAs in physiological processes, we further analyzed their temporal and spatial expression patterns. The results indicate that Ccr_lnc142711, Ccr_lnc17214525, Asip and Tyr strongly expressed in gastrula, neurula and organogenesis stages. LncRNAs expressed during blastula and gastrula stages might play important roles in cell fate decisions, differentiation and cell migration [63]. In addition, pigment cells are initially derived from the neural crest during gastrula stage [64, 65]. Indeed, recent large-scale knockdown analyses in mouse embryonic stem cells (ESCs) revealed key roles for lncRNAs in cell fate specification [66]. Therefore, we speculated that Ccr_lnc142711 and Ccr_lnc17214525 may be potential regulators of the pigmentation process.
Deeper molecular mechanistic research is clearly needed to elucidate the specific functions lncRNAs and their target genes. To this end, we found that Ccr_lnc142711 and Ccr_lnc148301 abundantly expressed in kidney, brain, blood, eye and gut, whereas Ccr_lnc17214525 abundantly expressed in white skin and eye tissues, indicating strict cell specificity for lncRNAs [39]. Skin pigmentation in fish is a complex process that involves numerous genetic factors [67]. Herein, it is found that expression of Asip is up-regulated in white skin, red skin, kidney, brain, eye, gonad and gut, while Mitf highly expressed in kidney, blood, eye and gut, and Tyr abundantly expressed in black skin, eye and muscle. The results are similar to some previous research [68–70], which suggest that expression of these genes is associated with skin pigmentation.
Conclusion
To our knowledge, this study provides the first lncRNA-mRNA integrated profiling analysis of differences in skin color in Koi carp. By comparing RNA-seq data from three pairwise groups, we identified significant DE lncRNAs and mRNAs, and explored potential cis and trans targets of lncRNAs. Functional enrichment and lncRNA-mRNA regulatory network analyses revealed novel lncRNAs and mRNAs associated with pigmentation and differences in skin color. Additionally, temporal and spatial expression patterns of lncRNAs and mRNAs revealed tissue specificity. Our results provide new insight into the molecular mechanisms underlying lncRNA-mediated pigmentation and differentiation in Koi carp. The numerous lncRNAs and mRNAs identified, and the accompanying de novo transcriptome data, provide valuable resources for future transcriptome studies investigating functions associated with skin color in fish.
Methods
Sample collection
Koi carp were obtained from the Qiting Pilot Research Station (Yixing, Jiangsu, China), affiliated to the FFRC. Animals (average weight: 400 ± 8 g) were raised at 24 ± 1 °C in 256 L tanks in a circulation water system for 1 week before experiments and fed twice daily with compound feed (Tech-bank Co., Ltd., Ningbo, China). Aeration was supplied constantly and a 12 -h light / dark photoperiod was employed.
Fish in the three experimental groups (black, white and red spots in one fish synchronous; Additional file 1: Figure S1) were tranquilized with 10–15 mg/L MS-222 buffered to pH 7.0–7.5, and three sets of skin tissues, black (BS), white (WS) and red (RS), were collected, immediately snap-frozen in liquid nitrogen and stored at − 80 °C until RNA isolation. After skin tissues sampling, fish were euthanized in buffered 300 mg/L Methyl methanesulfonate (MMS) and kidney, heart, eye, gill, gut, brain, blood, muscle, liver and gonad tissues were also collected and conserved at − 80 °C until use.
Samples from different developmental stages were collected at the aquaculture base. Brood fish were processed under hormone stimulation and mass spawning conditions. Fertilized eggs were hatched in cement tank with constant aeration at 24 ± 1 °C. Developmental stages were divided into zygote, cleavage, blastula, gastrula, neurula, organogenesis, hatching and 20 days post-hatching as described previously [24]. Samples from the same developmental stage were collected, immediately snap-frozen in liquid nitrogen and stored at − 80 °C until use.
RNA isolation, library preparation and sequencing
Total RNA was isolated using TRIzol reagent (Invitrogen, Carlsbad, CA, USA) according to the manufacture’s protocol, and genomic DNA was removed using DNase I (New England Biolabs). The concentration and integrity of RNA were estimated using a NanoDrop 2000 (Thermo Scientific, USA) and RNA quality was confirmed with an Agilent 2100 Bioanalyzer (Agilent Technologies, CA, USA).
Poly(A) libraries were prepared using Illumina TruSeq RNA Sample Preparation Kit v2 (NEB, Ipswich, MA, USA). Poly(A) RNA was purified with oligo dT magnetic beads, then fragmented with divalent cations followed by reverse transcription into cDNA and ligation of Illumina paired-end oligo adapters to cDNA fragments. Next, nine sequencing libraries were constructed and each library was loaded into one lane of the Illumina Hi-Seq X-ten for 150 bp paired-end sequencing.
Bioinformatics analysis
The pipeline for lncRNA analysis presented in (Additional file 1: Figure S2).
Quality control
FastQC (http://www.bioinformatics.babraham.ac.uk/projects/fastqc/) [25] was used to perform quality control of the sequencing data. Poor quality reads, including reads with adaptors, reads with > 10% unknown bases, and low-quality reads with > 50% bases with a quality value ≤5 were discarded during the initial filtering step.
Transcriptome assembly
Clean reads were first mapped onto the common carp (C. carpio) v3.0 reference genome (http://www.fishbrowser.org/database/Commoncarp_genome/) independently by TopHat v2.0.10 [26] with six mismatches prior to assembly. Clean reads were then de novo assembled into transcripts using a genome-guided method by Trinity v2.4.0 [27] with default parameters to reconstruct transcripts based on the actual read sequences. Finally, the obtained non-redundancy assembled transcripts were clustered using CD-HIT v4.6 [28] for downstream analysis.
Novel LncRNA prediction
Firstly, we used blat (https://genome.cshlp.org/content/12/4/656.short) to align assembled transcripts against the reference genome to identify locations of assembled transcripts with at least 90% sequence similarity. Since no lncRNA information was provided in C. carpio v3.0 genome annotations, transcripts similar to known lncRNAs in Danio rerio NONCODE v5 (cutoff E-value ≤1e-10) were assigned as putative lncRNAs.
In order to idnetify novel lncRNAs from the final assemblies, transcript locations were compared with reference genome annotation using Gffcompare (v0.10.1, https://ccb.jhu.edu/software/stringtie/gffcompare.shtml). We then followed the steps below to filter novel lncRNAs from the newly identified transcripts based on transformed locations:
Only ‘u’ category transcripts were considered to contain novel lncRNAs;
According to most studies, putative lncRNAs are arbitrarily defined as transcripts ≥200 nt in length with no protein-coding ability, hence transcripts < 200 nt were filtered [29];
Transcripts overlapping with known lncRNAs in Danio rerio were filtered;
More than 95% protein-coding genes have open reading frames (ORFs) > 100 amino acids [30]. We used TransDecoder version rel16JAN2014 (https://sourceforge.net/projects/transdecoder/) to identify putative ORFs in each transcript, and removed transcripts with putative ORFs > 300 bp;
We aligned the remaining transcripts to the NCBI non-redudant (Nr) protein database to eliminate transcripts similar to known proteins (cutoff E-value ≤1 × 10− 5);
Coding Potential Calculator version 0.9-r2 (http://www.mybiosoftware.com/cpc-0-9r2-assess-protein-coding-potential-transcripts.html) was utilized to estimate the coding potential of each transcript using the complete UniRef90 database with default parameters. Sequences with protein-coding-scores (CPC-score) < 0 were classified as novel lncRNAs.
Identification of differentially expressed lncRNAs and mRNAs
To analyze transcript abundance in a genome-free manner, RSEM v1.2.22 [31] was employed to estimate and quantify gene expression using an alignment-based method, yielding an expected read count for each protein and lncRNA gene. Gene expression was normalized using the fragments per kilobase of exon per million reads mapped (FPKM) method. Finally, edgeR v3.22.3 [32] was used to identify differentially expressed genes by pairwise comparisons. Differences were considered significant for FDR ≤0.05 and |log2 fold change (FC)| ≥1. Differential cluster analysis of genes and volcano plotting of differentially expressed lncRNAs and mRNAs were performed using the E Charts platform (http://www.ehbio.com/ImageGP/index.php/Home/Index/index.html).
Target gene prediction
The Cis role refers to the action of lncRNAs’ on neighboring target genes. We searched for coding genes within 10–100 kb upstream or downstream of lncRNAs.
The Trans role represents the influence of lncRNAs on other genes at the expression level. We calculated the expressed Pearson correlation coefficient between lncRNAs and corresponding coding genes using custom scripts (p < 0.05 and R ≥ 0.95). A regulatory network was then constructed and visualized by Cytoscape v3.6.1 [33], a standard tool for integrated analysis and visualization of biological networks.
GO and KEGG pathway analysis
To explore the functions of significant differentially expressed lncRNAs and mRNAs, and the corresponding target genes of differentially expressed lncRNAs, GO term and KEGG pathway enrichment analysis were conducted using the DAVID program v6.8 (https://david.ncifcrf.gov/) [34]. Significance was expressed as p-value, with a lower p-value indicating higher significance.
Quantitative real-time PCR assay
Total RNA from different tissues was extracted as described above, 0.5 μg was reverse-transcribed into first-strand cDNA using a PrimeScript RT Reagent Kit (TaKaRa, Japan), and qRT-PCR was performed on a CFX96 Touch Detection System (Bio-Rad, Hercules, CA, USA) using SYBR Premix Ex Taq II reagent (TaKaRa). All reactions were conducted in triplicate for each sample with an initial denaturation at 95 °C for 30 s, followed by 40 cycles at 95 °C for 5 s, and the optimized annealing temperature for 30 s. The relative expression levels of differentially expressed lncRNAs and mRNAs were normalized against glyceraldehydes-3-phosphate dehydrogenase (GAPDH) and β-actin using the 2-△△Ct method [35]. All primers (Table S1, Additional file 1) were designed using Primer Premier 5.
Statistical analysis
Sequencing data were analyzed as described above. All other data are presented as mean ± standard error of the mean (SEM) and were calculated by SPSS 22.0 (SPSS Inc., Chicago, IL, USA) using one-way analysis of variance (ANOVA) followed by Duncan tests (p < 0.05 = significant and p < 0.01 = highly significant).
Additional files
Figure S1. Photograph showing the three different skin color types in Koi carp. Table S1. Primers used for analysis of differentially expressed genes related to skin color in Koi carp. Figure S2. Pipeline for analysis of skin color-related lncRNAs by Illumina sequencing. (DOCX 260 kb)
Quality control results of nine representative samples. (XLSX 10 kb)
Known and novel lncRNAs identified in black, white and red skin samples from Koi carp. (XLSX 3809 kb)
Differentially expressed lncRNAs and mRNAs identified in the three different skin color groups. (XLSX 136 kb)
GO term and KEGG pathway enrichment analysis of significant differentially expressed mRNAs in the three skin color groups. (XLSX 304 kb)
Potential cis targets of lncRNAs with GO term and KEGG pathway enrichment analysis. (XLSX 51 kb)
Potential trans targets of lncRNAs with GO term and KEGG pathway enrichment analysis. (XLSX 28106 kb)
Expression profiles of three lncRNAs (A) and three mRNAs (B) involved in the melanogenesis pathway in different tissues of Koi carp. (DOCX 494 kb)
Acknowledgments
We would like to thank Nanjing Decode Genomics Biotechnology Co., Ltd. for assistance with bioinformatics analysis.
Abbreviations
- CAFS
Chinese Academy of Fishery Sciences
- cAMP
- cDNA
Complementary DNA
- CPC
Coding Potential Calculator
- FFRC
Freshwater Fisheries Research Center
- Fgf
Fibroblast growth factor
- GAPDH
Glycer-aldehyde-3-phosphate dehydrogenase
- GO
Gene Ontology
- KEGG
Kyoto Encyclopedia of Genes and Genomes
- LncRNAs
Long non-coding RNAs
- MAPK
Mitogen-activated protein kinase
- Mc1r
Melanocortin receptor 1
- Mitf
Microphthalmia-associated transcription factor
- NCBI
National Center for Biotechnology Information
- NcRNAs
Non-coding RNAs
- Notch
Notch signaling pathway
- Nr
Non-redudant
- ORFs
Open reading frames
- Pmela
Premelanosome protein a
- Pmelb
Premelanosome protein b
- QRT-PCR
Quantitative real-time PCR
- Silv
Silver locus protein homolog
- Sox10
Sex determining region Y-box 10
- sRNA-Seq
Small RNA sequencing
- Tyr
Tyrosinase
- Tyrp1
Tyrosine related protein-1
- Wnt
Wingless
Authors’ contributions
ZD designed and supervised the study. ML performed experiments and analyzed the transcriptome data. ZD, LW and WZ analyzed the transcriptome data. JF prepared tables and Figs. HY performed qRT-PCR experiments. ML wrote the manuscript. All authors read, reviewed and approved the manuscript for submission.
Funding
This study was supported by the Central Public Interest Scientific Institution Basal Research Fund, CAFS (NO.2019ZY22), the ‘333 Project’ Training Fund Project of Jiangsu Province (BRA2017083), and the Postgraduate Research and Practice Innovation Program of Jiangsu Province (KYCX18_0738). The funders had no role in study design, data collection, analysis, interpretation of data, or manuscript preparation.
Availability of data and materials
All raw transcriptome data reported in this article have been deposited in the NCBI and Sequence Read Archive (SRA) databases (https://www.ncbi.nlm.nih.gov) under accession numbers SRR8281645, SRR8281646, SRR8281647, SRR8281648, SRR8281649, SRR8281650, SRR8281651, SRR8281652 and SRR8281653. Sample metadata expression estimates can be found on the NCBI Gene Expression Omnibus under accession number GSE125039.
Ethics approval and consent to participate
This study was approved by the Bioethical Committee of Freshwater Fisheries Research Center (FFRC), Chinese Academy of Fishery Sciences (CAFS; BC 2013863, 9/2013). Efforts were made to minimize suffering as much as possible, and all animal and experimental procedures were carried out in accordance with the Guidelines for the Care and Use of Animals for Scientific Purposes set by the Ministry of Science and Technology, Beijing, China (No. 398, 2006).
Consent for publication
Not applicable.
Competing interests
The authors declare that they have no competing interests.
Footnotes
Publisher’s Note
Springer Nature remains neutral with regard to jurisdictional claims in published maps and institutional affiliations.
Contributor Information
Mingkun Luo, Email: mingkunluo@163.com.
Lanmei Wang, Email: wanglm@ffrc.cn.
Haoran Yin, Email: 1334733261@qq.com.
Wenbin Zhu, Email: zhuwb@ffrc.cn.
Jianjun Fu, Email: fujj@ffrc.cn.
Zaijie Dong, Phone: +86 51085558831, Email: dongzj@ffrc.cn.
References
- 1.Morris KV, Mattick JS. The rise of regulatory RNA. Nat Rev Genet. 2014;15(6):423–437. doi: 10.1038/nrg3722. [DOI] [PMC free article] [PubMed] [Google Scholar]
- 2.Ponting CP, Oliver PL, Reik W. Evolution and functions of long noncoding RNAs. Cell. 2009;136(4):629–641. doi: 10.1016/j.cell.2009.02.006. [DOI] [PubMed] [Google Scholar]
- 3.Shi XF, Sun M, Yao Y, et al. Long non-coding RNAs: a new frontier in the study of human diseases. Cancer Lett. 2013;339(2):159–166. doi: 10.1016/j.canlet.2013.06.013. [DOI] [PubMed] [Google Scholar]
- 4.Mercer TR, Dinger ME, Mattick JS. Long non-coding RNAs: insights into function. Nat Rev Genet. 2009;10(3):155–159. doi: 10.1038/nrg2521. [DOI] [PubMed] [Google Scholar]
- 5.Volders PJ, Verheggen K, Menschaert G, et al. An update on LNCipedia: a database for annotated human lncRNA sequences. Nucleic Acids Res. 2015;43:D174–D180. doi: 10.1093/nar/gku1060. [DOI] [PMC free article] [PubMed] [Google Scholar]
- 6.Gopalakrishnan K, Kumarasamy S, Mell B, et al. Genome-wide identification of long noncoding RNAs in rat models of cardiovascular and renal disease. Hypertension. 2015;65(1):200–210. doi: 10.1161/HYPERTENSIONAHA.114.04498. [DOI] [PMC free article] [PubMed] [Google Scholar]
- 7.Tarifeno Saldivia E, Valenzuela Miranda D, Gallardo Escarate C, et al. In the shadow: the emerging role of long non-coding RNAs in the immune response of Atlantic salmon. Dev Comp Immunol. 2017;73:193–205. doi: 10.1016/j.dci.2017.03.024. [DOI] [PubMed] [Google Scholar]
- 8.Kaushik K, Leonard VE, Shamsudheen KV, et al. Dynamic expression of long non-coding RNAs (lncRNAs) in adult zebrafish. PLoS One. 2013;8(12):e83616. doi: 10.1371/journal.pone.0083616. [DOI] [PMC free article] [PubMed] [Google Scholar]
- 9.Wan DC, Wang KC. Long noncoding RNA: significance and potential in skin biology. Csh Perspec Med. 2014;4:a015404. doi: 10.1101/cshperspect.a015404. [DOI] [PMC free article] [PubMed] [Google Scholar]
- 10.Jiang Yan J., Bikle Daniel D. LncRNA profiling reveals new mechanism for VDR protection against skin cancer formation. The Journal of Steroid Biochemistry and Molecular Biology. 2014;144:87–90. doi: 10.1016/j.jsbmb.2013.11.018. [DOI] [PubMed] [Google Scholar]
- 11.Ren HX, Wang GF, Zhou P, et al. Genome-wide analysis of long non-coding RNAs at early stage of skin pigmentation in goats (Capra hircus) BMC Genomics. 2016;17:67. doi: 10.1186/s12864-016-2365-3. [DOI] [PMC free article] [PubMed] [Google Scholar]
- 12.Weikard R, Hadlich F, Kuehn C. Identification of novel transcripts and noncoding RNAs in bovine skin by deep next generation sequencing. BMC Genomics. 2013;14(1):1. doi: 10.1186/1471-2164-14-789. [DOI] [PMC free article] [PubMed] [Google Scholar]
- 13.Damme PV, Appelbaum S, Hecht T. Sibling cannibalism in koi carp, Cyprinus carpio L. larvae and juveniles reared under controlled conditions. J Fish Biol. 2010;34(6):855–863. [Google Scholar]
- 14.Balon E. K. About the oldest domesticates among fishes. Journal of Fish Biology. 2004;65(s1):1–27. [Google Scholar]
- 15.Protas ME, Patel NH. Evolution of coloration patterns. Annu Rev of Cell Dev Bi. 2008;24(1):425–446. doi: 10.1146/annurev.cellbio.24.110707.175302. [DOI] [PubMed] [Google Scholar]
- 16.Aspengren S, Skold HN, Wallin M. Different strategies for color change. Cell Mol Life Sci. 2009;66(2):187–191. doi: 10.1007/s00018-008-8541-0. [DOI] [PMC free article] [PubMed] [Google Scholar]
- 17.Chistiakov DA, Voronova NV. Genetic evolution and diversity of common carp Cyprinus carpio L. Cent Eur J Biol. 2009;4(3):304–312. [Google Scholar]
- 18.Bar I, Kaddar E, Velan A, et al. Melanocortin receptor 1 and black pigmentation in the Japanese ornamental carp (Cyprinus carpio var. koi) Front in Genet. 2013;4:6. doi: 10.3389/fgene.2013.00006. [DOI] [PMC free article] [PubMed] [Google Scholar]
- 19.Liu JH, Wen S, Xiao YM, et al. Involvement of the Mitfa gene in the development of pigment cell in Japanese ornamental (koi) carp (Cyprinus carpio L.) Genet Mol Res. 2015;14(1):2775–2784. doi: 10.4238/2015.March.31.7. [DOI] [PubMed] [Google Scholar]
- 20.Jha P, Barat S, Nayak CR. A comparison of growth, survival rate and number of marketable koi carp produced under different management regimes in earthen ponds and concrete tanks. Aquacult Int. 2006;14(6):615–626. [Google Scholar]
- 21.Manas KM, Deepjyoti B, Nandeesha TL, et al. Effect of dietary natural carotenoid sources on color enhancement of koi carp, Cyprinus carpio L. Int J Fish Aquat Stud. 2017;5(4):340–345. [Google Scholar]
- 22.Xu P, Zhang X, Sun XW, et al. Genome sequence and genetic diversity of the common carp, Cyprinus carpio. Nat Genet. 2014;46(11):1212–1219. doi: 10.1038/ng.3098. [DOI] [PubMed] [Google Scholar]
- 23.Luo MK, Wang LM, Dong ZJ, et al. Identification and characterization of skin color microRNAs in koi carp (Cyprinus carpio L.) by Illumina sequencing. BMC Genomics. 2018;19:779. doi: 10.1186/s12864-018-5189-5. [DOI] [PMC free article] [PubMed] [Google Scholar]
- 24.Kimmel CB, Ballard WW, Kimmel SR, et al. Stages of embryonic development of the zebrafish. Dev Dyn. 1995;203(3):253–310. doi: 10.1002/aja.1002030302. [DOI] [PubMed] [Google Scholar]
- 25.Schmieder R, Edwards R. Quality control and preprocessing of metagenomic datasets. Bioinformatics. 2011;27(6):863–864. doi: 10.1093/bioinformatics/btr026. [DOI] [PMC free article] [PubMed] [Google Scholar]
- 26.Trapnell C, Pachter L, Salzberg SL. TopHat: discovering splice junctions with RNA-Seq. Bioinformatics. 2009;25(9):1105–1111. doi: 10.1093/bioinformatics/btp120. [DOI] [PMC free article] [PubMed] [Google Scholar]
- 27.Haas BJ, Papanicolaou A, Yassour M, et al. De novo transcript sequence reconstruction from RNA-seq using the trinity platform for reference generation and analysis. Nat Protoc. 2013;8(8):1494–1512. doi: 10.1038/nprot.2013.084. [DOI] [PMC free article] [PubMed] [Google Scholar]
- 28.Fu LM, Niu BF, Zhu ZW, et al. CD-HIT: accelerated for clustering the next- generation sequencing data. Bioinformatics. 2012;28(23):3150–3152. doi: 10.1093/bioinformatics/bts565. [DOI] [PMC free article] [PubMed] [Google Scholar]
- 29.Sun L, Zhang Z, Bailey TL, et al. Prediction of novel long non-coding RNAs based on RNA-seq data of mouse Klf1 knockout study. BMC Bioinformatics. 2012;13(1):331. doi: 10.1186/1471-2105-13-331. [DOI] [PMC free article] [PubMed] [Google Scholar]
- 30.Finn RD, Tate J, Mistry J, et al. The Pfam protein families database. Nucleic Acids Res. 2008;32(1):D138. doi: 10.1093/nar/gkh121. [DOI] [PMC free article] [PubMed] [Google Scholar]
- 31.Li B, Dewey CN. RSEM: accurate transcript quantification from RNA-Seq data with or without a reference genome. BMC Bioinformatics. 2011;12:323. doi: 10.1186/1471-2105-12-323. [DOI] [PMC free article] [PubMed] [Google Scholar]
- 32.Robinson MD, Mccarthy DJ, Smyth GK. edgeR: a Bioconductor package for differential expression analysis of digital gene expression data. Bioinformatics. 2010;26(1):139–140. doi: 10.1093/bioinformatics/btp616. [DOI] [PMC free article] [PubMed] [Google Scholar]
- 33.Shannon P, Markiel A, Ozier O, et al. Cytoscape: a software environment for integrated models of biomolecular interaction networks. Genome Res. 2003;13(11):2498–2504. doi: 10.1101/gr.1239303. [DOI] [PMC free article] [PubMed] [Google Scholar]
- 34.Huang DW, Sherman BT, Lempicki RA. Systematic and integrative analysis of large gene lists using DAVID bioinformatics resources. Nat Protoc. 2008;4(1):44–57. doi: 10.1038/nprot.2008.211. [DOI] [PubMed] [Google Scholar]
- 35.Livak KJ, Schmittgen TD. Analysis of relative gene expression data using real-time quantitative PCR and the 2 -△△CT method. Methods. 2001;25:402–408. doi: 10.1006/meth.2001.1262. [DOI] [PubMed] [Google Scholar]
- 36.Cieslak M, Reissmann M, Hofreiter M, et al. Colors of domestication. Biol Rev. 2011;86(4):885–899. doi: 10.1111/j.1469-185X.2011.00177.x. [DOI] [PubMed] [Google Scholar]
- 37.Li XM, Song YN, Xiao GB, et al. Gene expression variation of red-white skin coloration in common carp (Cyprinus carpio) Int J Mol Sci. 2015;16:21310–21319. doi: 10.3390/ijms160921310. [DOI] [PMC free article] [PubMed] [Google Scholar]
- 38.Li XZ, Zeng J, Zhang HT, et al. Ion torrent next-generation sequencing reveals the complete mitochondrial genome of koi carp (Cyprinus carpio, Cyprinidae) Mitochondrial DNA B. 2016;1(1):34–36. doi: 10.1080/23802359.2015.1137807. [DOI] [PMC free article] [PubMed] [Google Scholar]
- 39.Cabili MN, Trapnell C, Goff LA, et al. Integrative annotation of human large intergenic noncoding RNAs reveals global properties and specific subclasses. Genes Dev. 2011;25(18):1915–1927. doi: 10.1101/gad.17446611. [DOI] [PMC free article] [PubMed] [Google Scholar]
- 40.Li L, Eichten SR, Shimizu R, et al. Data from: genome-wide discovery and characterization of maize long non-coding RNAs. Genome Biol. 2014;15(2):R40. doi: 10.1186/gb-2014-15-2-r40. [DOI] [PMC free article] [PubMed] [Google Scholar]
- 41.Derrien T, Johnson R, Bussotti G, et al. The gencode v7 catalog of human long noncoding RNAs: analysis of their gene structure, evolution, and expression. Genome Res. 2012;22(9):1775–1789. doi: 10.1101/gr.132159.111. [DOI] [PMC free article] [PubMed] [Google Scholar]
- 42.Feagin JE, Stuart K. Differential expression of mitochondrial genes between life cycle stages of Trypanosoma brucei. P Natl Acad Sci Usa. 1985;82(10):3380–3384. doi: 10.1073/pnas.82.10.3380. [DOI] [PMC free article] [PubMed] [Google Scholar]
- 43.Miller C, Pavlova A, Sassoon DA. Differential expression patterns of Wnt genes in the murine female reproductive tract during development and the estrous cycle. Mech Develop. 1998;76(1–2):91–99. doi: 10.1016/s0925-4773(98)00112-9. [DOI] [PubMed] [Google Scholar]
- 44.Berson JF, Harper DC, Tenza D, et al. Pmel17 initiates premelanosome morphogenesis within multivesicular bodies. Mol Biol Cell. 2001;12(11):3451–3464. doi: 10.1091/mbc.12.11.3451. [DOI] [PMC free article] [PubMed] [Google Scholar]
- 45.Zhu W, Wang L, Dong Z, et al. Comparative transcriptome analysis identifies candidate genes related to skin color differentiation in red tilapia. Sci Rep-UK. 2016;6:31347. doi: 10.1038/srep31347. [DOI] [PMC free article] [PubMed] [Google Scholar]
- 46.Hodgkinson CA, Moore KJ, Nakayama A, et al. Mutations at the mouse microphthalmia locus are associated with defects in a gene encoding a novel basic-helix-loop-helix-zipper protein. Cell. 1993;74(2):395–404. doi: 10.1016/0092-8674(93)90429-t. [DOI] [PubMed] [Google Scholar]
- 47.Levy C, Khaled M, Fisher DE. MITF: master regulator of melanocyte development and melanoma oncogene. Trends Mol Med. 2006;12(9):406–414. doi: 10.1016/j.molmed.2006.07.008. [DOI] [PubMed] [Google Scholar]
- 48.Nagel D, Vincendeau M, Eitehuber AC, et al. Mechanisms and consequences of constitutive NF-kappaB activiation in B-cell lymphoid malignancies. Oncogene. 2014;33(50):5655–5665. doi: 10.1038/onc.2013.565. [DOI] [PubMed] [Google Scholar]
- 49.Young RM, Shaffer A, Phelan JD, et al. B-cell receptor signaling in diffuse large B-cell lymphoma. Semin Hematol. 2015;52(2):77–85. doi: 10.1053/j.seminhematol.2015.01.008. [DOI] [PMC free article] [PubMed] [Google Scholar]
- 50.Croce JC, Mcclay DR. Evolution of the Wnt pathways. Methods Mol Biol. 2008;469:3–18. doi: 10.1007/978-1-60327-469-2_1. [DOI] [PMC free article] [PubMed] [Google Scholar]
- 51.Oetting W, Stine OC, Townsend D, et al. Evolution of the tyrosinase related gene (TYRL) in primates. Pigment Cell Res. 1993;6(3):171–177. doi: 10.1111/j.1600-0749.1993.tb00597.x. [DOI] [PubMed] [Google Scholar]
- 52.Jackson IJ. Evolution and expression of tyrosinase-related proteins. Pigm Cell Melanoma R. 2010;7(4):241–242. doi: 10.1111/j.1600-0749.1994.tb00056.x. [DOI] [PubMed] [Google Scholar]
- 53.Englaro W, Rezzonico R, Durand M, et al. Mitogen-activated protein kinase pathway and AP-1 are activated during cAMP-induced melanogenesis in B-16 melanoma cells. J Biol Chem. 1995;270(41):24315–24320. doi: 10.1074/jbc.270.41.24315. [DOI] [PubMed] [Google Scholar]
- 54.Agar N, Young AR. Melanogenesis: a photoprotective response to DNA damage? Mutat Res. 2005;571(1–2):121–132. doi: 10.1016/j.mrfmmm.2004.11.016. [DOI] [PubMed] [Google Scholar]
- 55.Dorsky RI, Raible DW, Moon RT. Direct regulation of nacre, a zebrafish MITF homolog required for pigment cell formation, by the Wnt pathway. Gene Dev. 2000;14(2):158–162. [PMC free article] [PubMed] [Google Scholar]
- 56.Grichnik JM, Burch JA, Burchette J, et al. The SCF/KIT pathway plays a critical role in the control of normal human melanocyte homeostasis. J Dermatol Sci. 1998;16(2):233–238. doi: 10.1046/j.1523-1747.1998.00272.x. [DOI] [PubMed] [Google Scholar]
- 57.Schouwey K, Beermann F. The notch pathway: hair graying and pigment cell homeostasis. Histol Histopathol. 2008;23(5):609. doi: 10.14670/HH-23.609. [DOI] [PubMed] [Google Scholar]
- 58.Squarzoni P, Parveen F, Zanetti L, et al. FGF/MAPK/Ets signaling renders pigment cell precursors competent to respond to Wnt signal by directly controlling ci-Tcf transcription. Development. 2011;138(7):1421–1432. doi: 10.1242/dev.057323. [DOI] [PubMed] [Google Scholar]
- 59.Zhang P, Liu W, Yuan XY, et al. Endothelin-1 enhances the melanogenesis via MITF-GPNMB pathway. BMB Rep. 2013;46(7):364–369. doi: 10.5483/BMBRep.2013.46.7.250. [DOI] [PMC free article] [PubMed] [Google Scholar]
- 60.Chiang HM, Chien YC, Wu CH, et al. Hydroalcoholic extract of Rhodiola rosea L. (Crassulaceae) and its hydrolysate inhibit melanogenesis in B16F0 cells by regulating the CREB/MITF/tyrosinase pathway. Food Chem Toxicol. 2014;65(2):129–139. doi: 10.1016/j.fct.2013.12.032. [DOI] [PubMed] [Google Scholar]
- 61.Kishi H, Mishima HK, Yamashita U. Involvement of the protein kinase pathway in melanin synthesis by chick retinal pigment epithelial cells. Cell Biol Int. 2000;24(2):79–83. doi: 10.1006/cbir.1999.0467. [DOI] [PubMed] [Google Scholar]
- 62.Guttman M, Amit I, Garber M, et al. Chromatin signature reveals over a thousand highly conserved large non-coding RNAs in mammals. Nature. 2009;458(7235):223–227. doi: 10.1038/nature07672. [DOI] [PMC free article] [PubMed] [Google Scholar]
- 63.Hung T, Wang Y, Lin MF, et al. Extensive and coordinated transcription of noncoding RNAs within cell-cycle promoters. Nat Genet. 2011;43:621–629. doi: 10.1038/ng.848. [DOI] [PMC free article] [PubMed] [Google Scholar]
- 64.Parichy DM. Evolution of danio pigment pattern development. Heredity. 2006;97(3):200–210. doi: 10.1038/sj.hdy.6800867. [DOI] [PubMed] [Google Scholar]
- 65.Betancur P, Bronner FM, Sauka ST. Assembling neural crest regulatory circuits into a gene regulatory network. Annu Rev Cell Dev Biol. 2010;26:581–603. doi: 10.1146/annurev.cellbio.042308.113245. [DOI] [PMC free article] [PubMed] [Google Scholar]
- 66.Guttman M, Donaghey J, Carey BW, et al. LincRNAs act in the circuitry controlling pluripotency and differentiation. Nature. 2011;477:295–300. doi: 10.1038/nature10398. [DOI] [PMC free article] [PubMed] [Google Scholar]
- 67.Colihueque N. Genetics of salmonid skin pigmentation: clues and prospects for improving the external appearance of farmed salmonids. Rev Fish Biol Fish. 2010;20(1):71–86. [Google Scholar]
- 68.Johnson SL, Nguyen EM, Lister JA. Mitfa is required at multiple stages of melanocytes differentiation but not to establish the melanocytes stem cell. Dev Biol. 2011;350(2):405–413. doi: 10.1016/j.ydbio.2010.12.004. [DOI] [PMC free article] [PubMed] [Google Scholar]
- 69.Kelsh RN. Genetics and evolution of pigment patterns in fish. Pigment Cell Res. 2004;17:326–336. doi: 10.1111/j.1600-0749.2004.00174.x. [DOI] [PubMed] [Google Scholar]
- 70.Manceau M, Domingues VS, Mallarino R, et al. The developmental role of Agouti in color pattern evolution. Science. 2011;331(6020):1062–1065. doi: 10.1126/science.1200684. [DOI] [PubMed] [Google Scholar]
Associated Data
This section collects any data citations, data availability statements, or supplementary materials included in this article.
Supplementary Materials
Figure S1. Photograph showing the three different skin color types in Koi carp. Table S1. Primers used for analysis of differentially expressed genes related to skin color in Koi carp. Figure S2. Pipeline for analysis of skin color-related lncRNAs by Illumina sequencing. (DOCX 260 kb)
Quality control results of nine representative samples. (XLSX 10 kb)
Known and novel lncRNAs identified in black, white and red skin samples from Koi carp. (XLSX 3809 kb)
Differentially expressed lncRNAs and mRNAs identified in the three different skin color groups. (XLSX 136 kb)
GO term and KEGG pathway enrichment analysis of significant differentially expressed mRNAs in the three skin color groups. (XLSX 304 kb)
Potential cis targets of lncRNAs with GO term and KEGG pathway enrichment analysis. (XLSX 51 kb)
Potential trans targets of lncRNAs with GO term and KEGG pathway enrichment analysis. (XLSX 28106 kb)
Expression profiles of three lncRNAs (A) and three mRNAs (B) involved in the melanogenesis pathway in different tissues of Koi carp. (DOCX 494 kb)
Data Availability Statement
All raw transcriptome data reported in this article have been deposited in the NCBI and Sequence Read Archive (SRA) databases (https://www.ncbi.nlm.nih.gov) under accession numbers SRR8281645, SRR8281646, SRR8281647, SRR8281648, SRR8281649, SRR8281650, SRR8281651, SRR8281652 and SRR8281653. Sample metadata expression estimates can be found on the NCBI Gene Expression Omnibus under accession number GSE125039.


