

Abstract
Crowding of the subcellular environment by macromolecules is thought to promote protein aggregation and phase separation. A challenge is how to parameterize the degree of crowding of the cell interior or artificial solutions that is relevant to these reactions. Here I review colloid osmotic pressure as a crowding metric. This pressure is generated by solutions of macromolecules in contact with pores that are permeable to water and ions but not macromolecules. It generates depletion forces that push macromolecules together in crowded solutions and thus promotes aggregation and phase separation. I discuss measurements of colloid osmotic pressure inside cells using the nucleus, the cytoplasmic gel, and fluorescence resonant energy transfer (FRET) biosensors as osmometers, which return a range of values from 1 to 20 kPa. I argue for a low value, 1–2 kPa, in frog eggs and perhaps more generally. This value is close to the linear range on concentration–pressure curves and is thus not crowded from an osmotic perspective. I discuss the implications of a low crowding pressure inside cells for phase separation biology, buffer design, and proteome evolution. I also discuss a pressure–tension model for nuclear shape, where colloid osmotic pressure generated by nuclear protein import inflates the nucleus.
INTRODUCTION
The old concept that the interior of living cells is “crowded” (Luby-Phelps et al., 1986) has taken on an increased urgency in recent years with the emergence of phase separation and membrane-free compartments as concepts in subcellular organization (Hyman et al., 2014). The phase separation field exploded following the pioneering observation that Caenorhabditis elegans P granules are phase-separated liquid droplets (Brangwynne et al., 2009). Many proteins and RNAs are now now known to partition into phase-separated droplets in the cytoplasm or nucleus, with functional implications that are under intense examination. Phase separation is a form of macromolecular aggregation that is distinguished from more conventional solid phase aggregation processes such as cytoskeleton filament polymerization by the liquid nature of the aggregated phase. It is thought to be promoted in vivo by subcellular crowding, but it has been unclear how to quantify this effect. In vitro reconstitutions of phase separation reactions often make use of crowding agents, usually neutral polymers, such as poly(ethylene glycol) (PEG) or dextran, to enhance aggregation (Alberti et al., 2018). This leads to important practical questions: how much polymer should be added to a reconstituted reaction to mimic the degree of crowding in cytoplasm or nucleoplasm, how do different crowding agents compare, and what parameter best quantifies the crowding activity of a buffer? Conversely, physical cell biologists are interested in measurement and parameterization of crowding inside living cells and in exploring relationships among crowding, organization, and function.
The degree of crowding in the cytoplasm and nucleus can be parameterized and measured in many ways, including total macromolecule concentration, volume occupancy by macromolecules, effective viscosity and effective pore size as measured by diffusion of different sized probes, or by water transport. Each of these metrics has value depending on the question and system. Here I focus on a metric that may be less familiar to cell biologists, colloid osmotic pressure, also called oncotic pressure. As I will explain below, colloid osmotic pressure quantifies the degree to which a solution generates depletion forces that push macromolecules together. This makes it a natural parameter for quantifying the kind of crowding that promotes aggregation reactions. I will draw a sharp distinction between the tendency of a crowding agent to push molecules together, which is independent of its chemical structure, and its tendency to promote demixing, which depends on bonding interactions and is thus structure specific.
The idea that colloid osmotic pressure, and the depletion forces it generates, are a useful metric of the tendency of the subcellular environment to promote protein aggregation reactions has been discussed before (Parsegian et al., 2000; Rand et al., 2000; Marenduzzo et al., 2006). This view of crowding may be deemed oversimplistic and inaccurate by experts in the physics of complex solutions, who might prefer formalisms based on excluded volume effects or direct molecular simulations (Rivas and Minton, 2018). Such critiques are valid, but I feel an osmotic perspective has multiple satisfying features that make up for possible lack of precision. It emphasizes the ability of crowding to perform mechanical work such as inflating the nucleus, provides a single metric applicable to all crowding agents, and suggests new measurement methods. It also links modern quantitative cell biology to pioneering 1890s physiology, 1920s biochemistry, and 1950s biophysics.
COLLOID OSMOTIC PRESSURE (P)
The concept of colloid osmotic pressure, which we will refer to as Π, dates back to Starling’s pioneering investigation of the forces that draw water back into blood capillaries from interstitial fluid and thus oppose the water-expelling effect of hydrostatic pressure from the heart (Starling, 1896). Starling built an osmometer whose membrane was made of a biological sheet (peritoneal membrane) that was permeable to water and ions but not to proteins—roughly equivalent to a modern dialysis membrane. He then measured the osmotic pressure when serum (the liquid fraction of blood after clotting) was placed on one side of the membrane and a reference solution with the same salt concentration on the other (Figure 1A). Human plasma (the liquid fraction of unclotted blood) and serum contain ∼7% protein, mostly albumin. In the Starling assay, serum generated a colloid osmotic pressure of ∼4 kPa, which is now usually called the “oncotic pressure.” Physical chemists later measured the colloid osmotic pressure of proteins and diverse polymers, including the water-soluble polymers now used as crowding agents, and developed theories to explain concentration–pressure relationships.
FIGURE 1:

Colloid osmotic pressure (Π) and depletion forces. (A) Discovery of colloid osmotic pressure. The diagram conceptually illustrates Starling’s colloid osmometer, where the membrane was a stretched piece of peritoneal membrane and the macromolecule solution was blood plasma (Starling, 1896). The effective pore size depends on the diameter of the holes in the membrane, which permit free exchange of water and ions but not proteins. (B) Illustration of Asakura and Oosawa’s depletion force theory (Asakura and Oosawa, 1954). Two plates are immersed in a solution of macromolecule. When the plates approach closer than the hydrodynamic radius of the macromolecule, it is depleted (or excluded). Because there is now pure solvent (plus ions) between the plates, the solution outside the depleted region exerts a force per unit area which is given by the colloid osmotic pressure Π. The effective pore size is the distance between the plates when the depletion force starts to act. Depletion forces are related to “excluded volume effects,” although conceptually different formalisms are used to describe them (Rivas and Minton, 2018). (C) Compression of aligned DNA helices by PEG, as measured by x-ray diffraction (Podgornik et al., 1995). This is a practical implementation of Asakura and Oosawa’s theory. The effective pore size depends on the spaces in the lattice. (D) Phase separation of a disordered protein or RNA promoted by a crowding agent. The circles represent sites of weak, cohesive bonding. The effective pore size depends on the gaps between the macromolecules in the condensed phase. Note that phase separation involves demixing as well as compression, and the physics of the two processes are distinct (see the text).
Ordinary osmotic pressure, which we will refer to as P, is measured across a membrane that is permeable to water but not solutes. It is mostly caused by ions and small metabolites in biology. Its magnitude increases linearly with concentration up to fairly high values according to the van’t Hoff equation P = cRT, where c is the molal (mols/kg) concentration of dissociated species, R the gas constant, and T the absolute temperature. Ordinary osmotic pressure does not contribute to crowding because ions and metabolites are not excluded from protein condensates, so they do not exert depletion forces (discussed below).
Colloid osmotic pressure is more complicated, especially in concentrated solutions where macromolecules start to interact. Both empirically and theoretically, the colloid osmotic pressure of macromolecule solutions can be fitted to the formula Π = cRT(1 + αc + βc2…), where 1,α,β… are termed virial coefficients (Scatchard, 1946; Vink, 1971; Eisenberg, 1976). In dilute solution, where the molecules are far apart, this formula converges to the van’t Hoff equation. In the dilute regime (Figure 2B1), one molecule of a polymer generates the same osmotic pressure as one molecule of an ion, which can be hard for a biochemist like me to conceptualize. When the concentration rises to the point that polymers start to touch each other (Figure 2B2), the second and third virial coefficients become significant, and dependence of colloid osmotic pressure on concentration starts to rise in a highly nonlinear manner. This nonlinearity becomes significant at fairly low concentrations, 2% or less for high-molecular-weight PEGs, ficolls, and dextrans, because each unstructured molecule occupies a large volume. It also makes these polymers powerful osmolytes at high concentrations (Vink, 1971; Money, 1989).
FIGURE 2:

Effect of solute size and complex formation on osmotic and crowding activities. (A) Ions and small molecules exert osmotic pressure proportional to their concentration according to the van’t Hoff equation in both dilute and concentrated regimes. They no not exert depletion forces or crowding activity because they are smaller than the effective pore size of protein and nucleic acid aggregates. (B) Macromolecules exert colloid osmotic pressure according to the linear van’t Hoff equation in the dilute regime (B1). However, they become crowded at fairly low concentration due to their large size (B2). Once crowded, osmotic pressure begins to increase as a second or third power of concentration due to contact between molecules. Unstructured polymers like PEG or intrinsically disordered proteins become crowded at lower concentrations than globular proteins because of their less compact architecture. (C) Complex formation decreases osmotic and crowding activities of macromolecules and may account for a relatively low colloid osmotic pressures inside cells. The boxes contain as many monomers as in B but packaged into tetramers.
The osmotic pressure of protein and nucleic acid solutions is more complex because they are polyelectrolytes whose dissociated counterions contribute to their ordinary osmotic pressure. However, the contribution of counterions to colloid osmotic pressure decreases with total salt concentration and become negligible at physiological ionic strength (Adair, 1928; Scatchard, 1946; Eisenberg, 1976). This allowed early biochemists to determine protein molecular weights by measuring colloid osmotic pressure as a function of concentration and extrapolating to the dilute regime (Adair, 1928). At high concentration proteins start to exhibit nonlinear increase in pressure with concentration in a manner similar to neutral macromolecules, with virial coefficients that depend primarily on contact interactions, not counterions (Scatchard, 1946; Eisenberg, 1976). We can thus ignore protein counterions in a discussion of crowding. More important questions for considering the crowding effect of proteins are 1) whether they are monomeric versus in complexes, which changes their molal concentration, and 2) folded versus disordered, which changes the concentration at which they start to interact.
DEPLETION FORCES AND EXCLUDED VOLUME EFFECTS
The concept of colloid osmotic pressure is closely related to that of depletion forces. In an influential 1954 theory paper, Asakura and Oosawa proposed that large bodies immersed in a solution of macromolecules will experience an attractive force when they are close together (Asakura and Oosawa, 1954). This is now called the depletion force. Its origin is steric depletion of the macromolecule solute between the bodies when the distance between them is less than the hydrodynamic radius of the solute (Figure 1B). Below this distance, the liquid between the bodies becomes pure solvent. The difference in solute concentration in bulk solution versus between the bodies generates an osmotic pressure difference that pushes the bodies together. In effect, the closely separated plates in Figure 1B act like the pores of the colloid osmometer in Figure 1A. Asakura and Oosawa showed that the magnitude of the depletion force is given by the colloid osmotic pressure and pointed out that this same pressure will promote macromolecule aggregation inside cells.
The space between the plates in Figure 1B when they are close together can also thought of as an “excluded volume” whose effects on protein aggregation equilibria can be calculated using thermodynamic formulae that are conceptually different from those used to calculate depletion forces (Eisenberg, 1976). Minton and colleagues argued that excluded volume formalism is more accurate and useful in practice for calculating the effects of macromolecular crowding on protein equilibria, though it converges with depletion force formalism in dilute regimes (Rivas and Minton, 2018). Using excluded volume formalism, it is possible to integrate crowding effects with cohesive forces to provide a full energetic picture of a protein aggregation reaction (Hall and Minton, 2002; Minton, 2013). However, excluded volume formalism tends to obscure the conceptual connection between crowding and mechanical forces and does not provide a single crowding metric that can be used, for example, in buffer design.
The mechanical compression action of colloidal osmotic pressure on macromolecules is well illustrated by experiments of Parsegian and colleagues, who treated aligned DNA fibers with PEG solutions (Podgornik et al., 1995). Increasing the colloidal osmotic pressure of the test solution decreased the distance between helices, as measured by x-ray diffraction (Figure 1C). This experiment can be considered a direct implementation of Asakura and Oosawa’s thought experiment (Figure 1B). The PEG is too big to enter the packed DNA aggregates, while water and ions can. Thus, the PEG generates an osmotic pressure that compresses the DNA helices, and the helices serve as a kind of molecular osmometer.
Crowding also drives protein/RNA phase separation (Figure 1D) and protein aggregation reactions more generally. Like Parsegian’s DNA aggregates, condensed aggregates of protein and RNA contains gaps that are accessible to water and ions but not to macromolecule solutes. Depletion of the macromolecule solute inside the aggregate causes the bulk solution to exert a compressive osmotic pressure that promotes aggregation and opposes disaggregation.
DEMIXING
In phase separation reactions, the crowding agent and the test macromolecule(s) have to demix for depletion forces to act, and it is not obvious why this should occur. For example, in Parsegian’s DNA compression experiments (Figure 1C) PEG demixed from DNA, so it promoted both phase separation and helix compaction. Dextran did not demix, so it only compressed the DNA when separated from it by a dialysis membrane (Podgornik et al., 1995). The tendency of two polymers in solution to demix depends on the magnitude of the bond energies within each polymer type, and between them, and on the entropic cost of demixing. These bond energies depend on the detailed chemical structure of both the test biomolecule and the bulk crowing agent. PEG tends to demix from DNA, presumably because it is chemically dissimilar, while dextran does not. There are few published data that quantitatively compare the effect of different polymers on phase separation reactions, but we can gain some relevant information from a study if the compressive effect of different neutral polymers on an intrinsically disordered polypeptide using single-molecule fluorescence assays (Soranno et al., 2014). All polymers tested compressed the polypeptide, showing that their crowding action was general. However, PEG was more effective than more hydrophilic polymers when compared at a given volume fraction. These data were interpreted as PEG being the “least compatible” polymer, implying its bonding interactions with the test protein were least favorable. This study is consistent with the idea that PEG might promote demixing of a protein system more efficiently than dextran at a given degree of crowding because its bonding interactions with proteins are less favorable. Because demixing and crowding are different, cells could, in principle, tune their interiors to modulate them independently. For example, cohesive Pi–cation interactions between aromatic residues and arginines play a key role in phase separation of FUS protein (Wang et al., 2018). If cells accumulated a small metabolite that antagonized this interaction, then this would decrease phase separation of FUS-like proteins without changing crowding or aggregation reactions driven by different types of bonds, such as microtubule polymerization.
PORE SIZE
The concept of a pore size is central to the physics of osmolarity and depletion forces. This length scale determines which components of a solution exert osmotic pressure and, conversely, how a particular aggregating system will respond. In a membrane osmometer, the pore size is simply the radius of the holes in the membrane that separates the test solutions (Figure 1A). In Asakura and Oosawa’s theory, the equivalent of the pore size is the distance between the plates when they start to exclude the macromolecule solute (Figure 1B). In Parsegian’s DNA compression experiment it is the gaps between DNA molecules (Figure 1C). In phase separation reactions are the gaps in the condensed phase (Figure 1D). The related length scale for the polymer solutes that generate colloidal osmotic pressure is their hydrodynamic radius. Solutes with hydrodynamic diameters larger than the pore size of the responding system promote crowding, smaller ones do not. Complexities arise when the crowding polymer is itself compressible, so its radius decreases with crowding. These become important in highly crowded regimes and have inspired extensive theoretical work (Rivas and Minton, 2018).
COLLOID OSMOTIC PERSPECTIVE ON SUBCELLULAR CROWDING
Osmotic pressure provides a natural parameterization of subcellular crowding because it quantifies the tendency to push macromolecules together though depletion forces (Figure 1, B–D). It also provides a natural framework for addressing whether a solution of proteins should be considered crowded versus dilute. In dilute solutions, proteins exert a colloid osmotic pressure close to the van’t Hoff expectation. As their concentrations increase, and they start to interact, the second and third virial coefficients in the equation Π = cRT(1 + αc + βc2…) become significant (Scatchard, 1946; Eisenberg, 1976; Jin et al., 2006). Thus deviation from linear osmotic behavior is a signature of crowding at the protein length scale. It occurs at lower concentrations for larger, and less compact, molecules, simply because they occupy more volume and start to touch each other at lower concentrations.
An osmotic perspective also explains an important, and possibly counterintuitive, concept that assembly of proteins and nucleic acids into large complexes decreases subcellular crowding (Figure 2C). Take ribosomes as an example. Eukaryotic ribosomes are built from 82 proteins and four RNAs. In dilute solution, assembly of these subunits into a single particle reduces their osmotic pressure by a factor of 86, corresponding to a huge decrease in their contribution to depletion forces and crowding. Assembly of metabolic enzymes into dimers and tetramers has the same effect. Below, I argue that this aggregation is the reason the interior of growing cells is not very crowded. Certain specialized cells contain very high concentration of soluble proteins that do not aggregate into complexes, notably hemoglobin in erythrocytes and crystallins in eye lens cells. As a result, the cytoplasm in these cells has an unusually high colloid osmotic pressure (Dick, 1959; Magid et al., 1992). These cells do not have to execute rapid, crowding-sensitive macromolecule assembly–disassembly reactions that are essential in growing and motile cells, so a higher degree of crowding can be tolerated.
MEASUREMENT OF COLLOID OSMOTIC PRESSURE INSIDE CELLS
Measuring the colloid osmotic pressure of the cytoplasm and nucleoplasm of living cells is challenging. It requires either accurate reconstitution of the cytoplasm outside the cell or subcellular osmometers whose pore sizes resemble the gaps in macromolecule aggregates, that is, in the low-nanometer range. I describe several such osmometers below and the values they report.
Membrane osmometers conceptually similar to Starling’s design were used to infer the colloid osmotic pressure inside erythrocytes, whose cytoplasm is atypical but still instructive. Because hemoglobin is by far the most abundant protein inside erythrocytes, the in vivo colloid osmotic pressure can be estimated by pure protein osmometry (Adair, 1928). The concentration of hemoglobin in human erythrocytes is ∼5 mM, which corresponds to ∼34% wt/vol and given a partial specific volume of 0.75, ∼25% volume occupancy and a colloid osmotic pressure of ∼40 kPa (Dick, 1959). This value is approximately twofold higher than expected for dilute behavior of hemoglobin solution due to physical interaction between hemoglobin molecules, so there is a clear osmotic signature of crowding, albeit not a very strong one.
In the more typical cytoplasm of a frog oocyte, Harding and Feldherr took the creative approach of using the cell nucleus as a colloid osmometer (Harding and Feldherr, 1959). The nuclear envelope consists of a double lipid bilayer perforated by nuclear pores that are filled with a high concentration of phenylalanine-glycine-repeat peptides that interact to form a selective barrier (Schmidt and Görlich, 2016). As a result, the nuclear envelope is freely permeable to water, ion, and metabolites but not to proteins larger than ∼30 kDa, unless their diffusion through pores is facilitated by transporters in the importin/exportin family. These permeability properties make the nucleus an ideal osmometer for measuring colloidal osmotic pressure with a pore size in the 2- to 3-nm range, which is relevant for protein aggregation biology. Frog oocytes are huge, easily injected cells with huge, spherical nuclei. They are otherwise fairly typical in terms of metabolism and cell biology and provide a reasonable model of growing vertebrate somatic cells. Solutions of polyvinyl pyrrolidone (PVP) or albumin dissolved in physiological salt were injected into the cytoplasm and rapid changes in nuclear volume estimated using microscopy (Figure 2A). Solutions with high colloid osmotic pressure (2% PVP and greater) caused the nucleus to shrink, and low (0.5% PVP) caused it to swell. The isotonic concentration was 1–1.5% for both PVP and bovine serum albumin (BSA) (Figure 3A). Using published calibration curves (Vink, 1971), or simply the van’t Hoff equation since these are dilute solutions, these correspond to a colloid osmotic pressure in the oocyte cytoplasm of around 1 kPa.
FIGURE 3:

Osmometers for measurement of colloid osmotic pressure inside cells. (A) The cell nucleus as an osmometer (Harding and Feldherr, 1959). The cytoplasm of frog (Xenopus) oocytes was injected with a test solution containing isotonic salt and a variable concentration of PVP or BSA. If the test solution had a colloid osmotic pressure lower than that of cytoplasm, then the nucleus swelled; if higher, then it shrank. The pore size is governed by the molecular weight cut-off of nuclear pores. (B) Axoplasm extruded from the squid giant axon as a gel osmomoter (Spyropoulos, 1979). The axoplasmic gel shrinks if the ficoll test solution has a colloid osmotic pressure greater than the gel. The pore size depends on the physical properties of the gel. (C) FRET-based molecular osmometer (Liu et al., 2017). Increased colloid osmotic pressure causes the two fluorescent proteins to move closer together on average, leading to increased FRET. The pore size and dynamic range depend on the dimensions and molecular dynamics of the sensor and can be tuned by the structure of the arms. Versions of this sensor published so far had midpoints at considerably higher pressures than the inside of cells.
Colloid osmotic pressure can be measured by calibrated shrinkage of a gel whose pores are smaller than a test osmolytes (Ogston and Wells, 1970). Thus, the cytoplasmic gel itself can serve as an osmometer. Cytoplasm extruded from the squid giant axon, which is called axoplasm, has an unusually high degree of elastic gel organization thanks to abundant cytoskeleton fibers. (Spyropoulos, 1979) challenged extruded squid axoplasm with solutions of 400-kDa ficoll dissolved in salt solutions. Axoplasm shrank rapidly in response to bathing in higher ficoll concentrations (Figure 3B), indicating that the polymer does not rapidly diffuse into the axoplasm. Instead, water and ions leave in response to the difference in colloidal osmotic pressure, causing the gel to shrink. After calibrating the osmotic pressure of the ficoll solutions the colloid osmotic pressure of axoplasm was estimated at around 1 kPa, on the low end of the challenge solutions. It is not clear how much of the soluble components of axoplasm were retained in these experiments, so this low value must be interpreted with caution.
A modern approach to measurement of subcellular physiology is genetically encoded optical biosensors. Their advantages include the convenience of genetic encoding, subcellular targeting using appropriate localization tags, and the possibility of tuning dynamic range and effective pore size and by molecular design. Boersma and colleagues reported an elegant family of crowding biosensors that used spectral fluorescence resonant energy transfer (FRET) to read out the distance between donor and acceptor fluorescent proteins within a single, compressible polypeptide (Boersma et al., 2015; Liu et al., 2017). These were discussed as sensors of excluded volume, but they can also be viewed as molecular osmometers sensitive to depletion forces. A version of this probe with α-helical arms was most sensitive to crowding in living cells (Figure 3C). These sensors were calibrated in vitro using PEG and ficoll solutions. High concentrations of PEG were required to maximally compress the probe, but the α-helix containing versions were sensitive to in vivo degrees of crowding after calibration with ficoll. The FRET signals in unperturbed Escherichia coli and cultured human cell cytoplasm reported crowding equivalent to 19–20% wt/wt 70 kDa ficoll, much higher than the ∼1 kPa estimated in the frog oocyte. This large discordancy is discussed more below.
Holt and colleagues developed a different kind of genetically encoded crowding sensor called “GEMs” (genetically encoded multimeric nanoparticles; Delarue et al., 2018). These are icosahedral fluorescent proteins oligomers 20 or 40 nm in diameter that are bright enough that individual particles can be tracked as they diffuse through cytoplasm. Twenty-nanometer GEMs underwent ordinary diffusion inside yeast cells, while 40-nm GEMs exhibited restricted or “subdiffusive” motion. This size dependence of free diffusion is consistent with older reports (Luby-Phelps et al., 1986) and illustrates the importance of considering length scales when discussing crowding. GEMs are clearly useful probes of subcellular crowing, but they differ from true colloid osmometers in two important ways: they report a kinetic measurement while osmotic pressure is an equilibrium parameter, and the pore size measured by 40-nm GEMs is ∼10× larger than the colloid osmotic length scale. Given the 3- to 10-nm size of most proteins, measurement of crowding at the 40-nm length scale does not directly measure compressive forces that may contribute to phase separation. That said, compression at different length scales may correlate following physiological perturbation. For example, hypertonic stress removes water from cells and causes crowding at the length scales measured by both GEMs (∼40 nM) and molecular osmometers (∼2–5 nm). It also promotes cytoplasmic aggregation of FUS, perhaps due to enhanced phase separation (Sama et al., 2013). Thus, GEM tracking data are potentially relevant to phase separation biology. An interesting, unanswered question is whether physiological stimuli that increase GEM-measured crowding by increasing ribosome concentration (Delarue et al., 2018) also promote phase separation. Ribosomes occupy a significant fraction of the volume of cytoplasm but are not very osmotically active due to their high molecular weight, so it is difficult to make a prediction.
IS THE CYTOPLASM CROWDED AT THE COLLOID OSMOTIC LENGTH SCALE?
Published estimates for growing cells vary widely, from approximately 1 kPa in frog oocytes using the nucleus as an osmometer to at least 20-fold higher in bacteria and tissue culture cells using FRET-based molecular osmometers. The source of this large discrepancy is not clear. Perhaps frog oocytes are unusually uncrowded, though their biochemistry is similar to human somatic cells. Oocyte nuclear pores may have an effective pore size larger than standard literature values (Wühr et al., 2015), which would cause the nucleus to report lower pressure. The published FRET biosensors operate at the low end of their dynamic range in unperturbed cells which might lead to measurement inaccuracy. More sensitive versions, with midpoints nearer physiological values, might report lower pressures. The FRET biosensor approach is very promising, but it also revealed the complexity of measuring crowding, since different probes yielded significantly different values (Liu et al., 2017).
I currently prefer the lower pressure estimate from the nuclear osmometer experiment (Figure 2A), in part because the experiment is so simple and in part because cytoskeleton biochemistry points towards lower values. Microtubule polymerization dynamics are sensitive to colloid osmotic pressure as expected for any macromolecule aggregation reaction. Addition of 20% 70-kDa ficoll to tubulin (the concentration whose crowding was similar to cytoplasm as reported using FRET probes) (Liu et al., 2017) completely overcame the kinetic barrier to nucleation and caused immediate, aberrant polymerization (Schummel et al., 2017). Given their dynamic behavior, it is unlikely microtubules experience this degree of crowding inside cells. Protein dissociation from any aggregate has to do work against the depletion force, so crowding slows dissociation as well as shifting equilibria towards aggregation. The need for rapid protein dissociation reactions, for example, during protein synthesis, probably limits acceptable colloid osmotic pressures in growing cells to fairly low values.
If we provisionally accept the lower published estimates colloid osmotic pressure inside cells, around 1–2 kPa, then how should we think about this magnitude? This is the pressure generated by ∼1.5% 40-kDa PVP or BSA, which is low compared with the concentration of crowding agents typically added to reconstituted phase separation reactions. A natural biological comparison is with the conventional osmotic pressure across the plasma membrane of cells exposed to a low osmolality environment. This value is around ∼700 kPa in human cells, far higher than all the values discussed for the colloid component. Ions and small molecule solutes thus dominate conventional osmolarity. Another biological comparison is with blood plasma, where the colloidal osmotic pressure is ∼4 kPa. A lower colloid osmotic pressure in cytoplasm than plasma is surprising since the protein concentration in cells can be up to ∼20% wt/vol, while in plasma it is only 7%. Below I argue the low pressure inside cells is due to complex assembly. Plasma is physiologically adapted to generate a high colloid osmotic pressure to retain water in blood, which requires that albumin and other abundant proteins be nonaggregated so they can generate maximal osmotic pressure.
A different way to think about a crowding pressure in the range of 1–2 kPa is to ask whether this corresponds to a dilute or concentrated regime for proteins as inferred by osmometry. This value is in, or close to, the linear regime of concentration–pressure curves for most globular proteins (Jin et al., 2006), so there is little osmotic signature of crowding. We can take this discussion further for frog eggs, where the concentration of almost all proteins was estimated using mass spectrometry (Wühr et al., 2014). The total polypeptide concentration was estimated at 2.5 mM. Absolute calibration was based on published values for multiple individual proteins mostly measured in concentrated egg extracts rather than intact eggs, so the 2.5 mM value might need a small upward correction to account for dilution during extract preparation but certainly less than 1.5-fold. The average polypeptide molecular weight in frog eggs was 60 kDa, but the number average was 40 kDa, reflecting higher abundance of smaller polypeptides. This corresponds to ∼95 mg/ml or ∼7% volume occupancy assuming a partial specific volume of 0.75, which is typical for globular proteins. This value would be higher is a substantial fraction of the proteome was unfolded, and I am neglecting RNA. A 2.5 mM protein would exert a colloid osmotic pressure of ∼6 kPa if all polypeptides were soluble and monomeric and the solution was in the linear, van’t Hoff regime. The pressure would be higher in reality, since this would be a crowded solution. However, we know that many polypeptides either assemble into complexes or are sequestered inside membrane-bound organelles, both of which decrease number concentration and colloid osmotic pressure (Figure 2C). Native molecular weight was measured for a few thousand proteins in frog eggs using ultrafiltration, and, as expected, most abundant proteins exhibited native molecular weights larger than their polypeptide molecular weight, in many cases much larger (Wühr et al., 2015). Soluble proteins exhibited native molecular weights in undiluted egg extract that were as expected from their dilute solution behavior, so there was no evidence for supercomplexes. Assembly of abundant proteins into complexes, and sequestration inside organelles, likely explains why the approximately 1- to 2-kPa colloid osmotic pressure in frog oocytes (Harding and Feldherr, 1959) is much lower than that predicted if all the 2.5 mM polypeptide was in the form of soluble monomers.
MODELING PHYSIOLOGICAL CROWDING IN RECONSTITUTED SYSTEMS
Crowding agents provide an important tuning parameter in buffer systems for in vitro investigation of phase separation and other macromolecular assembly reactions. At least three properties of the crowding polymer are important.
Colloid osmotic pressure
This parameter tunes the strength of the depletion forces that promote protein and RNA aggregation. It is important to remember that the relationship between the concentration of a crowding agent and the pressure it generates becomes highly nonlinear once the solution leaves the dilute regime (Figure 2B). Calibration curves have been published for many polymers, although they tend to emphasize the high pressure range (Vink, 1971; Spyropoulos, 1979; Money, 1989; Jin et al., 2006). It is currently difficult to recommend a specific colloid osmotic pressure value to mimic the inside of cells in reconstitution studies, which give discordant estimates in the literature. As discussed above, I favor a low value, around 1–2 kPa, which corresponds to 1–2% wt/vol of 40-kDa PVP or serum albumin, and to even lower concentrations of PEG, depending on molecular weight. Use of PEG at concentrations that generate much higher pressures may be justified to mimic particular regulatory states of an aggregating system. However, caution is warranted in interpreting phase separation data collected at colloidal osmotic pressures much higher than physiological. Almost any protein will aggregate if the colloid osmotic pressure is sufficiently high.
Hydrodynamic radius
Comparing the effect of polymers of different hydrodynamic radius on a phase separation reaction probes the effective pore size, provided the osmotic pressure and polymer chemistry are kept constant. Hydrodynamic radii for different PEGs have been published (Lee et al., 2008).
Polymer chemistry
This controls demixing and is less subject to fundamental physical description. PEG is often chosen for phase separation experiments, likely because its chemical structure is different enough from proteins and nucleic acids that it tends to promote demixing. PEG lacks hydrogen bond donors except at its ends and has a dielectric constant of ∼10, making it quite hydrophobic. Dextran is more hydrophilic and can also be used to promote phase separation reactions of proteins. Given that dextran is more “compatible” with disordered proteins than PEG (Soranno et al., 2014), it may promote demixing less but perhaps be more physiological in that respect. Proteins are more physiological crowding agents, and concentration–pressures curves that span the physiological range have been reported for multiple globular proteins (Jin et al., 2006). However, crowding with a single protein runs the risk of electrostatic and biospecific interactions.
CONCLUSIONS AND FUTURE DIRECTIONS
The questions of precisely how crowded the cytoplasm and nucleoplasm are, and how crowding affects subcellular organization and biochemistry, have long been debated. These questions have multiple answers depending on the cell type, physiological state, crowding metric, and biology under consideration. Colloid osmotic pressure provides a simple metric of the kind of crowding that drives macromolecule aggregation through depletion forces. On the basis of data from frog oocytes and eggs, I currently favor a model where the nucleoplasm has a higher colloid osmotic pressure than the cytoplasm, but the value in both compartments is fairly low, around 1–2 kPa. If correct, then this low value means that the interior of cells is in the dilute regime as inferred by osmometry. It implies weak depletion forces, which can explain why protein assembly–disassembly reactions, such as microtubule polymerization dynamics, exhibit similar rate constants in dilute solution and inside cells; 1–2 kPa is likely too low a value to be an important driver of phase separation in vivo and suggests that the cohesive energies that drive demixing are instead the dominant factor. In this view, phase separation occurs because relevant proteins and nucleic acids are pulled together by favorable bonding within the aggregated phase, much more than pushed together by depletion forces from crowding outside the phase. This is not the case in reconstituted systems, where neutral polymers clearly promote crowding, especially at high concentrations, and crowding may dominate over chemistry-specific effects (Soranno et al., 2014).
It is currently uncertain precisely how cells achieve a low degree of colloid osmotic crowding given high total volume occupancy by proteins from bulk measurements (Dill et al., 2011). As discussed above for frog eggs, the answer likely comes from packaging proteins, RNAs, and storage polymers into compact assemblies with high mass and low colloid osmotic activity, such as ribosomes and glycogen granules. Growing microorganisms like E. coli and yeast might be more crowded, but much of their dry mass is ribosomes, which have intrinsically low osmotic and crowding activities due to their high molecular weight. I suspect that the interior of cells is shaped by a trade-off between two competing constraints that operate on both physiological and evolutionary timescales: 1) minimization of colloid osmotic pressure to allow fast protein dissociation reactions needed for macromolecule biochemistry and 2) maximization of total protein concentrations to facilitate fast metabolism and growth. On short timescales, cells presumably measure and adjust crowding to an optimum in this trade-off. On long timescales, the same trade-off likely shapes the evolution of the proteome, for example, to promote evolution of homo-oligomeric assembly states of abundant enzymes to reduce their crowding activity (Figure 2C). This proposed trade-off is similar to an argument made by Dill and colleagues, though they emphasized the unacceptably high viscosity that would result if the cytoplasm was too crowded (Dill et al., 2011).
Colloid osmotic pressure may do its most significant work inside cells at length scales larger than molecular. The nuclear osmometer experiment (Harding and Feldherr, 1959) suggests that the spherical shape of the nucleus is due to higher colloid osmotic pressure in the nucleoplasm compared with cytoplasm, balanced by a surface tension that minimizes the surface area of the nuclear envelope (Figure 4). Similar models have been proposed more recently (Finan and Guilak, 2010), and the pressure difference was recently estimated as approximately 1 kPa (Kim et al., 2016). The rate of nucleus growth is controlled by the rate of import of nuclear proteins with nuclear localization sequence (NLS) tags (Levy and Heald, 2010), so NLS proteins are likely to be the macromolecule osmolytes that inflate the nucleus (Figure 4). Surface tension in the nuclear envelope has been little studied, though it is known to regulate inflammatory signaling in epithelia (Enyedi et al., 2016). As nuclei inflate through guanosine triphosphate (GTP)-powered import of NLS proteins, tension may distribute between the lipid bilayers of the envelope itself and the much stronger nuclear lamina, which provides an elastic internal shell (Kim et al., 2016). The lamina is needed for rapid growth and physical stability of nuclei but not for a spherical shape (Newport et al., 1990). Thus, surface tension in the lipid bilayers of the envelope is likely to be the fundamental architect of the spherical shape, while lamina attachment consolidates and stabilizes that shape. A pressure–tension view of nucleus mechanics is worthy of further study and might help us understand not only normal nuclei but the diverse variant morphologies seen in specific cell types and disease states.
FIGURE 4:
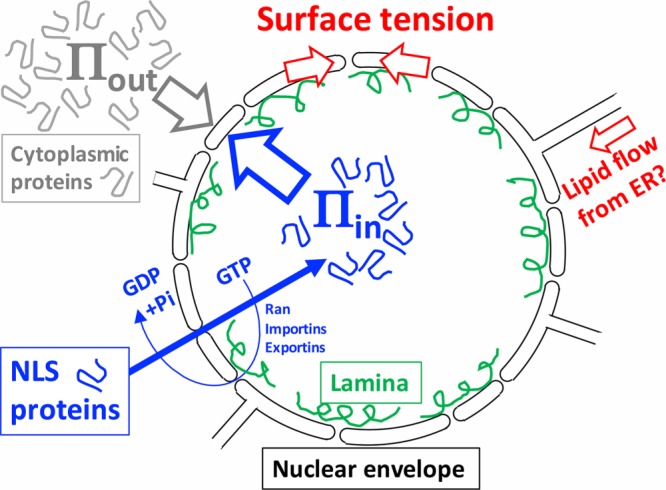
Osmotic model for nuclear morphology. The nuclear envelope (black lines) is a double lipid bilayer perforated by nuclear pores whose outer membrane is contiguous with the endoplasmic reticulum (ER). NLS protein are imported though nuclear pores (gaps) by an energy-coupled, facilitated diffusion process based on Ran, importins, and exportins (also called karyopherins) (blue arrows and text) (Schmidt and Görlich, 2016). We hypothesize the spherical shape is generated by a higher colloid osmotic pressure inside vs. outside (Πin > Πout) opposed by a surface tension (red arrows). Cytoplasmic crowding contributes to Πout and nuclear crowding to Πin. Surface tension is distributed between the lipid bilayers of the nuclear envelope and the nuclear lamina (green), which is a dynamic network of intermediate filaments. Membrane connections between the nuclear envelope and the ER allow lipid flow, which may regulate tension and allow nuclear growth (red arrow). Inflation of the nucleus by Πin is an example of colloid osmotic pressure performing mechanical work inside the cell. This model was inspired by observations in Xenopus egg extract. Similar models have been proposed to account for the response of tissue culture cell nuclei to osmotic and mechanical perturbations (Finan and Guilak, 2010; Kim et al., 2016).
Finally, there is a need to develop more sensitive subcellular osmometers, both genetically encoded biosensors with midpoints in the physiological range and macroscopic devices. These would help establish definitive physiological values of colloid osmotic pressure for reconstitution experiments and enable studies of how crowding inside cells is regulated as a function of subcellular location and physiological inputs. If future comparisons between molecular and macroscopic osmometers continue to yield divergent pressure values, then a possible explanation could be interesting structuring of the cell on the low-nanometer scale.
Acknowledgments
This article was prompted by lively discussions at the Marine Biological Laboratory (MBL) Physiology Course, Woods Hole, MA. I particularly thank Annie Pipathsouk (University of California, San Franscico) and Charlotte Strandkvist (Harvard Medical School) for experimental work in frog egg extract; James Pelletier (MIT), Tony Hyman (MPI Dresden), and Rob Phillips (Cal. Tech.) for discussions; and Nikon for microscopy support at MBL. T.J.M. is supported by National Institute of General Medical Sciences 39565.
Abbreviations used:
- BSA
bovine serum albumin
- FG
phenylalanine-glycine
- FRET
fluorescence resonant energy transfer
- GEMs
genetically encoded multimeric nanoparticles
- GTP
guanosine triphosphate
- NLS
nuclear localization sequence
- Π
colloid osmotic pressure
- P
conventional osmotic pressure
- PEG
poly(ethylene glycol)
- PVP
poly(vinyl pyrrolidone)
Footnotes
REFERENCES
- Adair GS. (1928). A theory of partial osmotic pressures and membrane equilibria, with special reference to the application of Dalton’s Law to hæmoglobin solutions in the presence of salts. Proc R Soc Lond A , 573–603. [Google Scholar]
- Alberti S, Saha S, Woodruff JB, Franzmann TM, Wang J, Hyman AA. (2018). A user’s guide for phase separation assays with purified proteins. J Mol Biol , 4806–4820. [DOI] [PMC free article] [PubMed] [Google Scholar]
- Asakura S, Oosawa F. (1954). On interaction between two bodies immersed in a solution of macromolecules. J Chem Phys , 1255–1256. [Google Scholar]
- Boersma AJ, Zuhorn IS, Poolman B. (2015). A sensor for quantification of macromolecular crowding in living cells. Nat Methods , 227–229, 1 p following 229. [DOI] [PubMed] [Google Scholar]
- Brangwynne CP, Eckmann CR, Courson DS, Rybarska A, Hoege C, Gharakhani J, Jülicher F, Hyman AA. (2009). Germline P granules are liquid droplets that localize by controlled dissolution/condensation. Science , 1729–1732. [DOI] [PubMed] [Google Scholar]
- Delarue M, Brittingham GP, Pfeffer S, Surovtsev IV, Pinglay S, Kennedy KJ, Schaffer M, Gutierrez JI, Sang D, Poterewicz G, et al. (2018). mTORC1 controls phase separation and the biophysical properties of the cytoplasm by tuning crowding. Cell , 338–349. e20. [DOI] [PMC free article] [PubMed] [Google Scholar]
- Dick DA. (1959). Osmotic properties of living cells. Int Rev Cytol , 387–448. [DOI] [PubMed] [Google Scholar]
- Dill KA, Ghosh K, Schmit JD. (2011). Physical limits of cells and proteomes. Proc Natl Acad Sci USA , 17876–17882. [DOI] [PMC free article] [PubMed] [Google Scholar]
- Eisenberg H. (1976). Biological Macromolecules and Polyelectrolytes in Solution, Oxford, UK: Clarendon Press. [Google Scholar]
- Enyedi B, Jelcic M, Niethammer P. (2016). The cell nucleus serves as a mechanotransducer of tissue damage-induced inflammation. Cell , 1160–1170. [DOI] [PMC free article] [PubMed] [Google Scholar]
- Finan JD, Guilak F. (2010). The effects of osmotic stress on the structure and function of the cell nucleus. J Cell Biochem , 460–467. [DOI] [PMC free article] [PubMed] [Google Scholar]
- Hall D, Minton AP. (2002). Effects of inert volume-excluding macromolecules on protein fiber formation. I. Equilibrium models. Biophys Chem , 93–104. [DOI] [PubMed] [Google Scholar]
- Harding CV, Feldherr C. (1959). Semipermeability of the nuclear membrane in the intact cell. J Gen Physiol , 1155–1165. [DOI] [PMC free article] [PubMed] [Google Scholar]
- Hyman AA, Weber CA, Jülicher F. (2014). Liquid-liquid phase separation in biology. Annu Rev Cell Dev Biol , 39–58. [DOI] [PubMed] [Google Scholar]
- Jin L, Yu Y-X, Gao G-H. (2006). A molecular-thermodynamic model for the interactions between globular proteins in aqueous solutions: applications to bovine serum albumin (BSA), lysozyme, alpha-chymotrypsin, and immuno-gamma-globulins (IgG) solutions. J Colloid Interface Sci , 77–83. [DOI] [PubMed] [Google Scholar]
- Kim D-H, Li B, Si F, Phillip JM, Wirtz D, Sun SX. (2016). Volume regulation and shape bifurcation in the cell nucleus. J Cell Sci , 457. [DOI] [PMC free article] [PubMed] [Google Scholar]
- Lee H, Venable RM, Mackerell AD, Pastor RW. (2008). Molecular dynamics studies of polyethylene oxide and polyethylene glycol: hydrodynamic radius and shape anisotropy. Biophys J , 1590–1599. [DOI] [PMC free article] [PubMed] [Google Scholar]
- Levy DL, Heald R. (2010). Nuclear size is regulated by importin α and Ntf2 in Xenopus. Cell , 288–298. [DOI] [PMC free article] [PubMed] [Google Scholar]
- Liu B, Åberg C, van Eerden FJ, Marrink SJ, Poolman B, Boersma AJ. (2017). Design and properties of genetically encoded probes for sensing macromolecular crowding. Biophys J , 1929–1939. [DOI] [PMC free article] [PubMed] [Google Scholar]
- Luby-Phelps K, Taylor DL, Lanni F. (1986). Probing the structure of cytoplasm. J Cell Biol , 2015–2022. [DOI] [PMC free article] [PubMed] [Google Scholar]
- Magid AD, Kenworthy AK, McIntosh TJ. (1992). Colloid osmotic pressure of steer crystallins: implications for the origin of the refractive index gradient and transparency of the lens. Exp Eye Res , 615–627. [DOI] [PubMed] [Google Scholar]
- Marenduzzo D, Finan K, Cook PR. (2006). The depletion attraction: an underappreciated force driving cellular organization. J Cell Biol , 681–686. [DOI] [PMC free article] [PubMed] [Google Scholar]
- Minton AP. (2013). Quantitative assessment of the relative contributions of steric repulsion and chemical interactions to macromolecular crowding. Biopolymers , 239–244. [DOI] [PMC free article] [PubMed] [Google Scholar]
- Money NP. (1989). Osmotic pressure of aqueous polyethylene glycols: relationship between molecular weight and vapor pressure deficit. Plant Physiol , 766–769. [DOI] [PMC free article] [PubMed] [Google Scholar]
- Newport JW, Wilson KL, Dunphy WG. (1990). A lamin-independent pathway for nuclear envelope assembly. J Cell Biol , 2247–2259. [DOI] [PMC free article] [PubMed] [Google Scholar]
- Ogston AG, Wells JD. (1970). Osmometry with single sephadex beads. Biochem J , 67–73. [DOI] [PMC free article] [PubMed] [Google Scholar]
- Parsegian VA, Rand RP, Rau DC. (2000). Osmotic stress, crowding, preferential hydration, and binding: A comparison of perspectives. Proc Natl Acad Sci USA , 3987–3992. [DOI] [PMC free article] [PubMed] [Google Scholar]
- Podgornik R, Strey HH, Rau DC, Parsegian VA. (1995). Watching molecules crowd: DNA double helices under osmotic stress. Biophys Chem , 111–121. [DOI] [PubMed] [Google Scholar]
- Rand RP, Parsegian VA, Rau DC. (2000). Intracellular osmotic action. Cell Mol Life Sci , 1018–1032. [DOI] [PMC free article] [PubMed] [Google Scholar]
- Rivas G, Minton AP. (2018). Toward an understanding of biochemical equilibria within living cells. Biophys Rev , 241–253. [DOI] [PMC free article] [PubMed] [Google Scholar]
- Sama RRK, Ward CL, Kaushansky LJ, Lemay N, Ishigaki S, Urano F, Bosco DA. (2013). FUS/TLS assembles into stress granules and is a prosurvival factor during hyperosmolar stress. J Cell Physiol , 2222–2231. [DOI] [PMC free article] [PubMed] [Google Scholar]
- Scatchard G. (1946). Physical chemistry of protein solutions; derivation of the equations for the osmotic pressure. J Am Chem Soc , 2315–2319. [DOI] [PubMed] [Google Scholar]
- Schmidt HB, Görlich D. (2016). Transport selectivity of nuclear pores, phase separation, and membraneless organelles. Trends Biochem Sci , 46–61. [DOI] [PubMed] [Google Scholar]
- Schummel PH, Gao M, Winter R. (2017). Modulation of the polymerization Kinetics of α/β-tubulin by osmolytes and macromolecular crowding. Chemphyschem Eur J Chem Phys Phys Chem , 189–197. [DOI] [PubMed] [Google Scholar]
- Soranno A, Koenig I, Borgia MB, Hofmann H, Zosel F, Nettels D, Schuler B. (2014). Single-molecule spectroscopy reveals polymer effects of disordered proteins in crowded environments. Proc Natl Acad Sci USA , 4874–4879. [DOI] [PMC free article] [PubMed] [Google Scholar]
- Spyropoulos CS. (1979). Cytoplasmic gel and water relations of axon. J Membr Biol , 195–238. [DOI] [PubMed] [Google Scholar]
- Starling EH. (1896). On the absorption of fluids from the connective tissue spaces. J Physiol , 312–326. [DOI] [PMC free article] [PubMed] [Google Scholar]
- Vink H. (1971). Precision measurements of osmotic pressure in concentrated polymer solutions. Eur Polym J , 1411–1419. [Google Scholar]
- Wang J, Choi J-M, Holehouse AS, Lee HO, Zhang X, Jahnel M, Maharana S, Lemaitre R, Pozniakovsky A, Drechsel D, et al. (2018). A molecular grammar governing the driving forces for phase separation of prion-like RNA binding proteins. Cell , 688–699. e16. [DOI] [PMC free article] [PubMed] [Google Scholar]
- Wühr M, Freeman RM, Presler M, Horb ME, Peshkin L, Gygi SP, Kirschner MW. (2014). Deep proteomics of the Xenopus laevis egg using an mRNA-derived reference database. Curr Biol , 1467–1475. [DOI] [PMC free article] [PubMed] [Google Scholar]
- Wühr M, Güttler T, Peshkin L, McAlister GC, Sonnett M, Ishihara K, Groen AC, Presler M, Erickson BK, Mitchison TJ, et al. (2015). The nuclear proteome of a vertebrate. Curr Biol , 2663–2671. [DOI] [PMC free article] [PubMed] [Google Scholar]