

Abstract
The nucleolus is a membraneless organelle of the nucleus and the site of rRNA synthesis, maturation, and assembly into preribosomal particles. The nucleolus, organized around arrays of rRNA genes (rDNA), dissolves during prophase of mitosis in metazoans, when rDNA transcription ceases, and reforms in telophase, when rDNA transcription resumes. No such dissolution and reformation cycle exists in budding yeast, and the precise course of nucleolar segregation remains unclear. By quantitative live-cell imaging, we observed that the yeast nucleolus is reorganized in its protein composition during mitosis. Daughter cells received equal shares of preinitiation factors, which bind the RNA polymerase I promoter and the rDNA binding barrier protein Fob1, but only about one-third of RNA polymerase I and the processing factors Nop56 and Nsr1. The distribution bias was diminished in nonpolar chromosome segregation events observable in dyn1 mutants. Unequal distribution, however, was enhanced by defects in RNA polymerase I, suggesting that rDNA transcription supports nucleolar segregation. Indeed, quantification of pre-rRNA levels indicated ongoing rDNA transcription in yeast mitosis. These data, together with photobleaching experiments to measure nucleolar protein dynamics in anaphase, consolidate a model that explains the differential partitioning of nucleolar components in budding yeast mitosis.
INTRODUCTION
The nucleolus, a prominent subcompartment of the nucleus, forms around arrays of rRNA genes (rDNA), which are therefore called nucleolar organizer regions (NORs) (Boisvert et al., 2007; Taddei et al., 2010; McStay, 2016). In humans, such rDNA arrays are found on five acrocentric chromosomes, while there is a single rDNA array of around 150 gene repeats on chromosome XII in the budding yeast Saccharomyces cerevisiae. The main function of the nucleolus is to supply cells with the large number of ribosomes needed for growth and proliferation. To this end, the rDNA locus is transcribed by RNA polymerase I (pol I) into a rRNA precursor molecule, which is processed, modified, and assembled with ribosomal proteins to form small and large preribosome particles, which are further matured on their way from the nucleolus to the cytoplasm (Kressler et al., 2010; Woolford and Baserga, 2013).
In addition to providing cells with ribosomes, pol I activity is of major relevance to the architecture of the nucleolus. Studies in yeast and also synthetic biology in higher eukaryotes suggest that rRNA synthesis is the essential process triggering assembly of the nucleolus by self-organization (Oakes, Johzuka, et al., 2006; Grob et al., 2014). Preinitiation factors bind to different promoter elements upstream of the budding yeast 35S rRNA gene, and under favorable nutrient conditions, the pol I holoenzyme is recruited to the promoter in an Rrn3-dependent manner and transcription of the 35S rRNA gene is initiated (Schneider, 2012; Claypool, French, et al., 2004). Synthesized pre-rRNA likely acts as a seed recruiting numerous processing factors (Grob and McStay, 2014) and many processing steps occur cotranscriptionally (Tschochner and Hurt, 2003; Koš and Tollervey, 2010; Albert et al., 2012). This can be seen in electron and cryo–electron microscopy as so-called Miller trees representing transcribed rDNA with emerging transcripts that contain processing complexes as terminal knobs (Miller and Beatty, 1969; Barandun, Hunziker, and Klinge, 2018). Therefore, pol I activity provides a transient physical link between rDNA and rRNA processing factors.
During cell division in metazoans, the nucleolus dissolves temporarily (Hernandez-Verdun, 2011; Mangan et al., 2017). At the beginning of mitosis, transcription by pol I ceases and the dense fibrillar and granular components of nucleoli disassemble as they relocate to the chromosome periphery. Following chromosome segregation in anaphase, transcription by pol I resumes and nucleoli reassemble at NORs. However, there are also factors that stay associated with rDNA during anaphase, such as the high-mobility group protein UBF, which establishes a bookmark for the recruitment of the pol I transcription machinery and the reassembly of nucleoli in telophase (Grob and McStay, 2014).
In contrast to higher eukaryotes, the budding yeast nucleolus is thought to stay assembled during the course of mitosis (Fuchs and Loidl, 2004; Sirri et al., 2008). The single budding yeast rDNA array is segregated equally between the mother and daughter cell in mitosis. However, like cell and nuclear division, the geometry of chromosome segregation in budding yeast is highly polar (Jorgensen et al., 2007; Renshaw et al., 2010). At the onset of anaphase, cohesin is not completely inactivated across chromosome arms and sister chromatids remain linked also by catenation (Titos et al., 2014). This leads to a zipperlike segregation of chromosomes, in which the chromatids transmitted from the mother to the daughter cell undergo pronounced stretching and subsequent condensin-dependent recoiling events that progress from centromere to telomere. In addition to residual cohesin and catenation applying to chromosome segregation in general, pol I activity is known to establish linkages between sister rDNA-arrays in budding yeast mitosis (Machin et al., 2006; Tomson et al., 2006). Under particular conditions, where rDNA segregation is impeded, switching off pol I activity can abrogate segregation defects. In more detail, cleavage of cohesin by separase is sufficient for segregation of most chromosomes (Uhlmann et al., 2000), but in the case of the rDNA locus activity of the phosphatase, Cdc14 is an additional requirement for segregation (Granot and Snyder, 1991; Sullivan et al., 2004; Torres-Rosell, Machin, et al., 2004). Cdc14 is released from the nucleolus during anaphase (Shou et al., 1999; Visintin et al., 1999) and may contribute to rDNA segregation via multiple pathways. Recruitment of condensin to rDNA depends on Cdc14 activity (D’Amours et al., 2004), and the phosphatase also enhances the integrity of the mitotic spindle by dephosphorylation of the microtubule-bundling protein Ase1 (Khmelinskii, Lawrence, et al., 2007). The process of rDNA segregation in budding yeast has been the subject of several studies. However, it is still unknown how the proteinaceous components of the nucleolus segregate during mitosis.
RESULTS
To study how the nucleolus divides during mitosis in budding yeast, we followed various green fluorescent protein (GFP)-fused nucleolar proteins by spinning-disk confocal fluorescence microscopy. The GFP fusions were made by tagging endogenous gene copies to maintain physiological expression levels. All GFP-fused nucleolar proteins produced the characteristic crescent-shaped subnuclear fluorescence signal in interphase and supported wild-type rates of cell growth (Supplemental Figure 1, A and B), indicating functionality of the constructs. Integrity of the fusion proteins was confirmed by Western blot analysis (Supplemental Figure 1C). For live-cell imaging, cells were overlaid with an agar pad of synthetic-complete dextrose (SD) medium to provide a constant supply of nutrients, and z-stacks were taken at 2 min intervals. Under microscopy conditions, cells continued to divide at rates comparable to that of unperturbed growth in liquid medium (Supplemental Figure 2). In addition to visualizing nucleolar proteins during mitosis, we also determined the amount passed on to the nucleolus of the daughter cell. To this end, we quantified signals in the mother and daughter cell nuclei for three time points after complete signal segregation in typically 10 or more cells. The median and interquartile range (IQR) were used as measures of center and spread, respectively.
To validate the experimental setup, we analyzed a yeast strain that carried a GFP-fused gene copy of histone H2A (HTA2-GFP) and coexpressed a nuclear localization sequence–fused version of mCherry (mCherry-NLS; Arnold, Höckner, and Seufert, 2015). This allowed us to follow the mitotic segregation of chromatin and nucleoplasm in parallel. Previous work had indicated that the yeast cell nucleus divides asymmetrically (Jorgensen et al., 2007). Consistent with this, we observed that the nucleoplasmic marker protein segregated asymmetrically, with daughter cells receiving 37.7% (IQR = 3.3) of the total mCherry-NLS signal (Figure 1). A similar value was obtained in measurements of the nuclear volume (Supplemental Figure 3A). In contrast, H2A-GFP segregated almost equally, with daughter cells receiving 46.3% (IQR = 1.3) of the signal (Figure 1). The minor deviation from the expected equal distribution might be caused by a small fraction of H2A-GFP not being incorporated into chromatin. Unlike the uniform signal concentration of mCherry-NLS, the H2A-GFP signal was significantly more concentrated in daughter cells (Supplemental Figure 3B), suggesting that total chromatin is hypercondensed in yeast daughter cells in telophase. Consistent with this observation, previous work reported hypercondensation of chromosome arms segregated to daughter cells in yeast mitosis (Neurohr, Naegeli, et al., 2011). Together, these results indicate that the experimental setup is suitable for quantitative measurements under physiological conditions.
FIGURE 1:

Differential segregation of nucleoplasm and chromatin. Fluorescence microscopy of the nucleoplasmic protein mCherry-NLS and the endogenous histone H2A-GFP in the course of mitosis. t = 0 is the first point in time with completely segregated mother and daughter signals in the GFP-channel. Scale bar, 5 µm. The box plot illustrates the percentage of the total nuclear signal inherited by daughter cells (n = 12; ***p < 0.001).
Differential segregation of nucleolar proteins
Transcription of the rRNA genes by RNA polymerase I (pol I) is a major biosynthetic activity in the nucleolus (Warner, 1999; Woolford and Baserga, 2013). To follow pol I during mitosis, we fused GFP to Rpa190 and Rpa135, the two largest pol I-subunits which together form the catalytic center in the core of the holoenzyme (Neyer, Kunz, et al., 2016; Tafur et al., 2016). GFP was also fused to the Rpa43 subunit, which localizes to the polymerase stalk and serves to facilitate promoter recruitment of pol I (Peyroche et al., 2000; Kuhn et al., 2007). In addition to the characteristic crescent-shaped structures in preanaphase cells, Rpa190-GFP, Rpa135-GFP, and Rpa43-GFP gave rise to various elongated signals during chromosome segregation, which is known to involve stretching and recoiling of chromosomes (Harrison et al., 2009; Renshaw et al., 2010). Covisualization of the nucleoplasmic marker protein mCherry-NLS indicated that pol I remained localized to distinct subnuclear structures throughout anaphase (Figure 2, A–C). Nucleoplasmic pools of GFP-tagged pol I subunits were comparably low in interphase and anaphase cells, as indicated by line intensity plots (Supplemental Figure 4). Together, these data suggest that pol I remains associated with the rDNA locus during mitosis. Interestingly, quantification of the GFP signals revealed that pol I split unequally between the mother and daughter cell nucleoli, as the daughter cell nucleolus contained on the average only 35% of the total signal (Rpa190-GFP: 37.2% IQR = 4.1; Rpa135-GFP: 33.3% IQR = 4.1; Rpa43-GFP: 35.5% IQR = 5.5; Figure 2).
FIGURE 2:
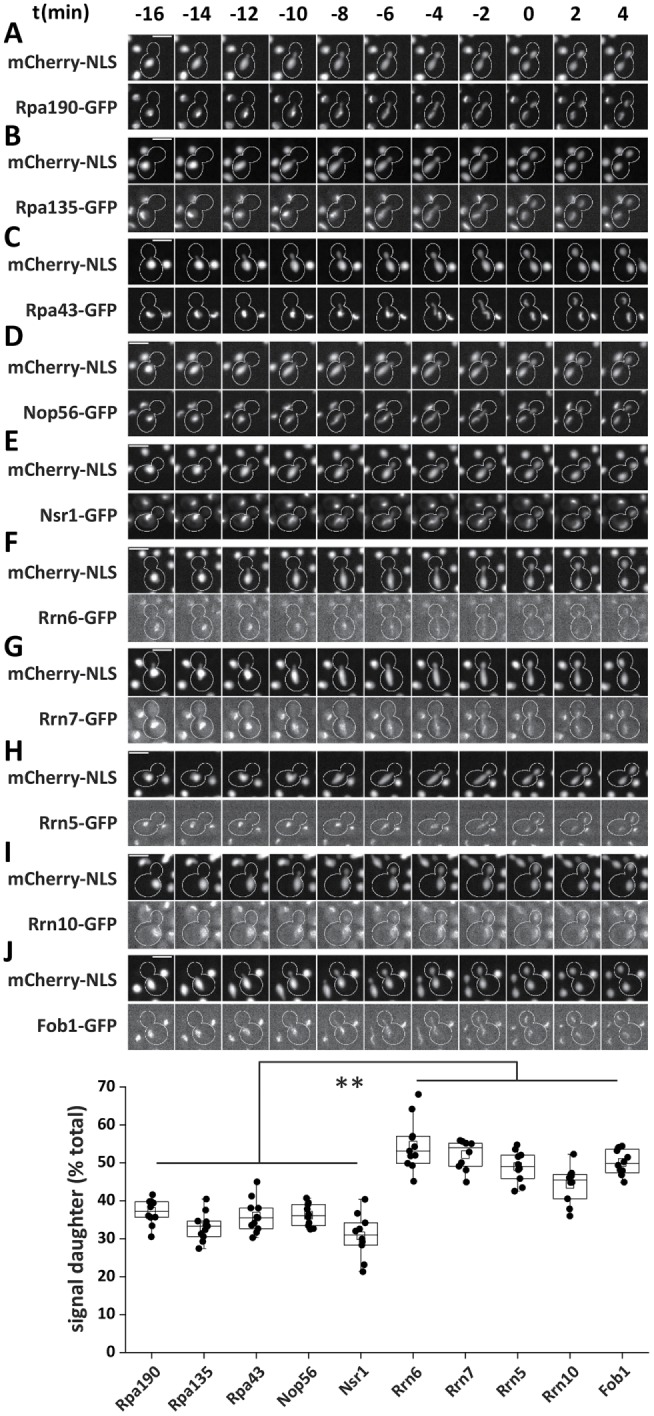
Differential segregation of nucleolar proteins. (A–J) Fluorescence microscopy showing colocalization of mCherry-NLS with endogenous (A) Rpa190-GFP, (B) Rpa135-GFP, (C) Rpa43-GFP, (D) Nop56-GFP, (E) Nsr1-GFP, (F) Rrn6-GFP, (G) Rrn7-GFP, (H) Rrn5-GFP, (I) Rrn10-GFP, and (J) Fob1-GFP in the course of mitosis. t = 0 is the first point in time with completely segregated mother and daughter signals in the GFP channel. Scale bars, 5 µm. The box plot illustrates the percentage of total nuclear signal inherited by daughter cells (from left to right: n = 12, 11, 11, 10, 10, 11, 10, 10, 10, 12; **p < 0.01).
During its synthesis, the nascent pre-rRNA is bound at its 5´-portion by the small subunit (SSU) processome, a large ribonucleoprotein complex needed for pre-rRNA maturation (Dragon et al., 2002; Barandun, Chaker-Margot, Hunziker, et al., 2017; Barandun, Hunziker, and Klinge, 2018). To follow this particle, we fused GFP to the Nop56 subunit of the U3 small nucleolar ribonucleoprotein particle (snoRNP), a subcomplex of the SSU processome (Lafontaine and Tollervey, 2000). GFP was also fused to the yeast orthologue of human nucleolin, Nsr1, a ribosome biogenesis factor that is not part of the SSU processome (Kondo and Inouye, 1992; Chaker-Margot et al., 2017). Like the pol I subunits, Nop56-GFP and Nsr1-GFP localized to elongated subnuclear structures during chromosome segregation indicating persistent rDNA association in mitosis (Figure 2, D and E). And again, there was an obvious segregation bias with daughter nucleoli obtaining 36.1% (IQR = 5.6) and 31.0% (IQR = 5.9) of the total Nop56-GFP and Nsr1-GFP signal, respectively (Figure 2). Consistent with these data, unequal mitotic segregation of Nop56 has been observed before (Menendez-Benito et al., 2013). Thus, in addition to pol I, components of the pre-rRNA processing machinery partition unequally during mitosis.
Various initiation factors associated with the rDNA promoter region are required for the onset of transcription by pol I. These include the core factor (CF), subunits of which interact with Rrn3, the TATA-binding protein (TBP), and the upstream activating factor (UAF; Knutson et al., 2014). To visualize the core factor, the CF-subunits Rrn6 and Rrn7 were fused to GFP. Consistent with their low abundance (Ghaemmaghami et al., 2003), Rrn6-GFP and Rrn7-GFP generated weak fluorescence signals, but characteristic rDNA structures were observed throughout anaphase (Figure 2, F and G). In contrast to pol I and rRNA biogenesis factors, however, these CF subunits segregated equally between the nucleoli of mother and daughter cells (Figure 2). Signal quantification indicated that daughter cells received 53.1% (IQR = 7.1) of Rrn6-GFP and 54.0% (IQR = 6.0) of Rrn7-GFP. In addition to CF-subunits, we also analyzed the UAF subunits Rrn5 and Rrn10 (Keys, Lee, et al., 1996). Again, typical rDNA structures were seen during chromosome segregation in anaphase (Figure 2, H and I) and the fluorescence signals of Rrn5-GFP (49.1%; IQR = 6.2) segregated symmetrically or almost symmetrically in the case of Rrn10-GFP (45.5%; IQR = 6.4; Figure 2). Thus, unlike components of the pol I holoenzyme and rRNA processing machineries, the promoter-associated CF and UAF components partitioned equally between the mother and daughter cell nucleoli.
Finally, we checked the rDNA binding protein Fob1, which has no direct role in rDNA transcription. Fob1 binds to replication fork barrier sites present in a nontranscribed spacer region of the rDNA locus. There, Fob1 blocks replication in a polar manner to prevent collisions of the replication and transcription machinery and thereby supports integrity of the rDNA locus (Kobayashi, 2003; Mohanty and Bastia, 2004). During anaphase, Fob1-GFP localized to typical nucleolar structures and visualized the stretching and recoiling of the rDNA locus (Figure 2J). Signal quantification in time-lapse series revealed that Fob1-GFP segregated equally during nuclear division (Figure 2). Nucleoli of daughter cells contained 49.8% (IQR = 6.2) of the total Fob1-GFP signal. Thus, Fob1-GFP resembles the rDNA promoter-associated CF and UAF components in its equal partitioning between the nucleoli of mother and daughter cells.
Together, these data suggest that during chromosome segregation in budding yeast mitosis the nucleolus persists, but its composition is rearranged with the daughter cell nucleolus receiving a smaller portion of the rDNA transcription and processing machineries, but an equal share of rDNA-associated factors.
Low mobility of nucleolar proteins in anaphase
Because pol I subunits and rRNA processing factors showed a mitotic segregation bias quantitatively similar to the unequal segregation of the nucleoplasm marked by mCherry-NLS, we asked whether these nucleolar proteins are mobile and exchange rapidly with the nucleoplasm in anaphase. To investigate their intranuclear dynamics, we performed fluorescence loss in photobleaching (FLIP) experiments (Figure 3). To this end, we chose anaphase cells with completely separated nucleoli and bleached the GFP-fused nucleolar protein along with mCherry-NLS specifically in the mother cell–localized portion of the nucleus. Consistent with earlier work (Boettcher et al., 2012), diffusion of nucleoplasmic proteins is apparently fast in this stage of anaphase, since bleaching of the mother cell portion of the nucleus resulted in a simultaneous loss of the mCherry-NLS fluorescence signal in the daughter cell portion. In contrast, bleaching of the GFP-fused pol I-subunit Rpa135 in the mother cell nucleus (reduction to 10.2% of the prebleach value; SD = 4.7; n = 5) affected the Rpa135-GFP signal in the daughter cell nucleolus only moderately (reduction to 79.5%; SD = 8.8; n = 5; Figure 3A). There was some further increase of the mother cell signal (22.2%; SD = 7.0) accompanied by a decrease of the daughter cell signal (60.6%; SD = 13.8) over the course of 4 min after the bleach, but the Rpa135-GFP signal did not equilibrate in this interval. These data indicate that, unlike mCherry-NLS, Rpa135-GFP is strongly restricted in its movement, suggesting that yeast RNA pol I largely retains its nucleolar residence during anaphase.
FIGURE 3:

Low internucleolar protein exchange in anaphase. (A–C) Cobleaching of mCherry-NLS and (A) Rpa135-GFP, (B) Nop56-GFP, and (C) Nsr1-GFP in the mother cell body of mid-anaphase cells. Bleaching of the indicated areas (yellow outlines) was done for 26 s. Images before bleaching (pre), immediately after bleaching (0 min), and 4 min after bleaching (4 min) are shown. Scale bars, 5 µm. The bar graphs depict signal intensities in mother and daughter cell bodies normalized to the prebleach image. Unbleached cells were used as controls. Mean values and SDs are shown (n = 5).
The GFP-fused SSU processome subunit Nop56 behaved in a very similar manner (Figure 3B). Its bleaching in the mother cell nucleus (signal reduction to 6.6%; SD = 5.9; n = 5) had little effect on the daughter cell signal (88.1%; SD = 11.3; n = 5), while the mCherry-NLS signal was lost in both portions of the nucleus. Some exchange of the Nop56-GFP signal was detectable thereafter, but it occurred at a very low rate. Within 4 min after the bleach, the Nop56-GFP signal increased to 18.1% (SD = 7.7) in the mother cell nucleolus and decreased to 75.7% (SD = 18.8) in the daughter cell nucleolus. This suggests that, similarly to pol I, the SSU processome remains localized to the nucleolus in anaphase.
With this approach, nucleolar retention was observed also for the GFP-fused nucleolin Nsr1 (signal reduction to 5.3% [SD = 6.4] and 72.9% [SD = 17.1] in the mother and daughter cell nucleoli, respectively; Figure 3C). Signal exchange in the 4-min postbleach interval (19.2% [SD = 10.0] and 47.5% [SD = 15.0] in the mother and daughter cell nucleoli, respectively) indicated that relative to Rpa135-GFP and Nop56-GFP, the nucleolin Nsr1 is somewhat more mobile.
Together, these data suggest that RNA pol I, the SSU processome, and nucleolin do not exchange rapidly with the nucleoplasm, but are retained efficiently in the nucleolus during anaphase. Thus, a direct link between the unequal segregation of these nucleolar proteins and the nucleoplasm seems unlikely.
Asymmetric nucleolar inheritance caused by the polarity of chromosome segregation
Chromosome segregation in budding yeast is inherently polar. At the onset of anaphase, the spindle rapidly elongates into the daughter cell (Straight et al., 1997; Shaw et al., 1998). Spindle forces are opposed by residual cohesin and catenation of chromosome arms, so that sister chromatids are segregated in a zipper-like manner from centromeres to telomeres (Renshaw et al., 2010; Titos et al., 2014). The daughter cell–directed chromatids undergo pronounced regional decompactions followed by condensin-mediated recondensation. To ask whether the specific geometry of chromosome segregation is relevant to the observed unequal partitioning of nucleolar components, we studied division of the nucleolus in dyn1 mutant strains. Dyn1, the cytoplasmic microtubule motor protein dynein, helps to position the nucleus at the bud neck and orient the spindle along the mother-bud axis. In its absence, chromosome segregation may occur in the mother cell (Eshel et al., 1993; Li et al., 1993). To characterize the behavior of chromosomes during their segregation in dyn1 mutant cells, we made use of the tetO/tetR-GFP chromosome dot system (Michaelis et al., 1997) and inserted a tetO array into the telomere-proximal flank of the rDNA locus. As expected, this rDNA dot localized adjacent to—and segregated after—the Nop56-3mCherry signal (Figure 4A) and therefore serves as a measure for the completion of rDNA segregation. In our further analysis, we used a dyn1 mutant rDNA dot strain coexpressing a 3mCherry fusion of Spc42 to visualize the spindle pole body (SPB) (Donaldson and Kilmartin, 1996). This allowed us to monitor spindle elongation as well as stretching and recoiling of the chromosome arm carrying the rDNA locus by tracking SPB–SPB and SPB–dot distances (Figure 4H).
FIGURE 4:

Nonpolar rDNA segregation in a dyn1 mutant. A tetO array was introduced at the telomere-proximal flank of the rDNA locus and visualized by tetR GFP. (A) Mitotic segregation of the rDNA dot with Nop56-3mCherry as comarker. Scale bar, 5 µm. t = 0 is set arbitrarily. (B, C) Mitotic segregation of the rDNA-dot and Spc42-3mCherry in dyn1 cells elongating the mitotic spindle through the bud neck, B, or inside the mother cell body, C. t = 0 is the last point in time with SPB-SPB distance <3 µm. Scale bars, 5 µm. (D) SPB–SPB distance in RRN3 and rrn3 ts cells over time. Mean values and SDs (n = 10). (E) Percentage of dyn1 cells (spindle elongation through the bud neck or inside the mother, respectively) showing segregated rDNA dots (distance permanently >1 µm) over time. (F) Distance of rDNA dot and SPB over time for mother- and daughter-directed chromatids when segregation proceeds through the bud neck. Mean values and SDs. (G) Distance of rDNA dot and SPB over time for mother- and daughter-directed chromatids when segregation is confined to the mother cell (SPB and rDNA dot closer to the bud are termed daughter-directed). Mean values and SDs are shown. (H) Scheme to illustrate the distances measured in D–G.
Consistent with previous studies, the majority of dyn1 mutant cells managed to elongate their mitotic spindles through the bud neck (Figure 4B). In these regular mitotic divisions, spindle elongation showed the typical biphasic pattern (Yeh et al., 1995; Straight et al., 1997) and SPBs reached an average distance of 7.2 µm at 20 min after onset of elongation (Figure 4, B and D). In addition, chromosomes that partitioned into the daughter cell underwent significant stretching, as indicated by the increase of the rDNA dot–SPB distance (Figure 4F). In contrast, when chromosome segregation was confined to the mother cell body, spindles elongated somewhat more slowly and reached a typical length of 5 µm (Figure 4D) and, importantly, chromosome stretching did not occur (Figure 4G). Moreover, it took much longer to complete rDNA segregation (Figure 4E). Thus, inside the mother cell bodies of dyn1 mutants, chromosomes segregate somewhat more slowly and in a symmetric, nonpolar manner.
To ask how the polarity of chromosome segregation influences the partitioning of the nucleolus, we followed GFP-fused nucleolar proteins in dyn1 mutants. Subunits of pol I, the SSU processome, and nucleolin partitioned asymmetrically when chromosomes segregated through the bud neck. Under these conditions, daughter cells received 30.7% (IQR = 6.7) of the Rpa135-GFP signal, 33.9% (IQR = 12.0) of Nop56-GFP, and 32.7% of Nsr1-GFP (IQR = 7.2; Figure 5). In contrast, when chromosomes segregated inside the mother cell body, these nucleolar components partitioned much more symmetrically, with the nuclear portion closer to the daughter cell receiving 45.6% (IQR = 5.8) of the Rpa135-GFP signal, 41.3% (IQR = 5.5) of Nop56-GFP, and 43.8% (IQR = 5.0) of Nsr1-GFP. These observations suggest that the specific geometry of nuclear division in budding yeast, where one set of chromosomes is rapidly transported out of the mother into the daughter cell, is a major cause for the asymmetric segregation of the rRNA transcription and biogenesis machineries of the nucleolus.
FIGURE 5:

Decreased asymmetry of pol I and processing factors in nonpolar chromosome segregation events of dyn1 mutant cells. (A–C) Colocalization of mCherry-NLS and (A) Rpa135-GP, (B) Nop56-GFP, and (C) Nsr1-GFP in mitotic dyn1 mutant cells. Most cells performed a regular nuclear division through the bud neck (top panels). A minority (5%) segregated the nucleolus inside the mother cell body (at least three time points with segregated structures inside the mother cell body; signal closer to bud neck regarded as daughter nucleolus). t = 0 is the first point in time with completely segregated signals in the GFP channel. Scale bars, 5 µm. Box plots depict the percentage of total signal inherited by daughter cells in regular mitotic divisions (top) or segregated to the bud neck–proximal nucleolus in the case of division inside the mother cell (bottom). From top to bottom: n = 10, 9; 10, 10; 10, 10; **p < 0.01; ***p < 0.001.
Consistent with earlier work (Yeh et al., 1995), we observed that some cells, which had segregated their nucleoli inside the mother cell body, continued mitosis by moving one portion of the two-lobed nucleus into the daughter cell. No significant change in the daughter directed portion of the signal of Rpa135-GFP was observed after passage of the bud neck (Supplemental Figure 5). Thus, passage of chromosomes through the bud neck does not delocalize pol I from the nucleolus, arguing against a possible view that a bud neck barrier is responsible for the asymmetric segregation of the rRNA transcription machinery.
RNA polymerase I promotes nucleolar inheritance
rRNA is a key organizer of the nucleolar structure (Grob and McStay, 2014; Shin and Brangwynne, 2017). To study how transcription by pol I affects the mitotic segregation of the nucleolus, we used cells carrying an rrn3 ts allele. This conditional mutation hinders recruitment of pol I to the promoter and thereby inhibits pol I transcriptional activity (Claypool, French, et al., 2004). Consistent with this work, we observed that a 30-min shift of rrn3 ts cells from 25°C to 37°C decreased pre-rRNA levels to ∼5% of the wild-type value (see Figure 9 later in this article). Time-lapse microscopy and signal quantification of the nucleoplasm marker mCherry-NLS and the histone H2A-GFP indicated that, overall, nuclear division and segregation of chromatin occurred normally upon inactivation of pol I (Supplemental Figure 6, A and B). Inviability of rrn3 ts cells at the restrictive temperature was confirmed by a growth assay (Supplemental Figure 8).
FIGURE 9:

Pre-rRNA levels throughout the cell cycle. (A–E) bar1 cells were synchronized by a pheromone induced G1 arrest and release into fresh medium. (A) Maximum change of RNAs in the synchronized culture over time compared with the change of RNAs in RRN3 wild-type and rrn3 ts mutant cells following shift from 25 to 37°C for 30 min. (B, C) Synchrony of the culture was tested by flow cytometry providing DNA-profiles (1C, G1 cells; 2C, G2 and M cells) (B) and counting of DAPI stained cells (n = 100) to follow nuclear division (C). (D) Levels of CLB2, SIC, and CTS1 mRNAs in the synchronized culture shown as fold actin mRNA. (E) Levels of the pre-rRNA portion spanning the cleavage sites A0 and A1 and an 18S rRNA segment are shown as fold actin mRNA. Fold actin mRNA values for cycling cells at 25°C and for RRN3 wild-type and rrn3 ts mutant cells after 30 min at 37°C are shown for comparison. Means and SDs for three qPCR replicas are shown.
We next analyzed the mitotic segregation of pol I by following Rpa135-GFP. Incubation of rrn3 ts cells at the restrictive temperature for 30 min caused some delocalization of Rpa135-GFP to the nucleoplasm during interphase and mitosis (Figure 6, A and B). Measurement of the Rpa135-GFP signal in the mother and daughter cell portions of the nucleus during anaphase revealed that the mother cell bias of pol I segregation was further increased in rrn3 ts cells (Figure 6C). Daughter cells received 35.1% (IQR = 7.1) and 28.4% (IQR = 6.2) of the Rpa135-GFP signal in wild-type and rrn3 ts cells, respectively. Thus, after acute inactivation of pol I transcription, a sizeable fraction of pol I remains localized to the nucleolus, and reduced amounts of pol I are associated with the rDNA copy transmitted to the daughter cell. These data suggest that ongoing transcription helps to supply the daughter cell with a regular amount of nucleolar-localized pol I.
FIGURE 6:

Increased asymmetry of pol I and processing factors in an rrn3 ts mutant. (A, B) Line intensity profiles depicting the maximum-intensity distribution of mCherry-NLS and Rpa135-GFP in interphase and anaphase (last time point showing unsegregated signal) for wild-type and rrn3 ts cells at 37°C, respectively. (C–F) Mitotic segregation of (C) Rpa135-GFP, (D) Nop56-GFP, (E) Nsr1-GFP, and (F) Fob1-GFP in RRN3 and rrn3 ts cells at 37°C. Rrn3 was inactivated in growing, nonsynchronized cells by a shift to 37°C for 30 min before time series of 28 min at 37°C were acquired. t = 0 is the first point in time with completely segregated mother and daughter signals in the GFP-channel. Scale bars, 5 µm. Box plots depict the percentage of total nuclear signal inherited by daughter cells (from top to bottom: n = 12, 12; 10, 10; 11, 11; 10, 10; *p < 0.05; **p < 0.01; ***p < 0.001).
The GFP-fused rRNA biogenesis factors Nop56 and Nsr1 behaved similarly. The presence of extranucleolar speckles, in addition to the major nucleolar signal (Supplemental Figure 6C), point to partial delocalization of these proteins in rrn3 ts mutant cells. Relative to wild-type cells, reduced amounts of Nop56-GFP were inherited by daughter cells (RRN3 cells: 36.7% [IQR = 5.1]; rrn3 ts cells: 31.9% [IQR = 10.1]; Figure 6D). In the case of Nsr1-GFP, the daughter cell signal was unusually small and dot-shaped, and the bias was even more pronounced (RRN3 cells: 37.7% [IQR = 7.1]; rrn3 ts cells: 23.7% [IQR = 13.6]; Figure 6E). Thus, the inhibition of pol I transcription compromised the passage of the SSU processome and nucleolin to daughter cells during mitosis.
Unlike the above-described rRNA transcription and biogenesis factors, the GFP-fused rDNA binding protein Fob1 did not detectably delocalize from the nucleolus in the rrn3 ts mutant (Figure 6F). Well-defined subnuclear structures were visible throughout the mitotic segregation process. Fob1-GFP signals were more compact in the mutant, but the equal segregation pattern was maintained (RRN3 cells: 50.8% [IQR = 6.6]; rrn3 ts cells: 47.5% [IQR = 10.4]).
Together, these observations indicate that transcription by pol I supports inheritance of the rRNA transcription and processing machinery by the daughter cell nucleus, but is dispensable for the transmission of other nucleolar components, as exemplified by the rDNA-binding protein Fob1.
To characterize in more detail how the rDNA locus segregates after inhibiting pol I transcription, we tracked the SPB labeled by Spc42-3mCherry and a chromosome dot inserted into the telomere-proximal flank of the rDNA locus. Following rrn3 ts-mediated inactivation of pol I, spindles elongated at normal rates (Figure 7, A–C). Segregation of the rDNA locus, however, was noticeably accelerated in the rrn3 ts mutant (Figure 7D). This suggests that rDNA transcription opposes the mitotic segregation of the rDNA locus and accounts for its late completion. To analyze the stretching and recoiling of chromosome arms, we measured the distance between the SPB and the respective rDNA dot (Figure 7, E and F). In the chromatid, which remained in the mother cell body, the rDNA dot–SPB distance did not change much. In contrast, chromosome stretching was pronounced in the case of the chromatid segregating into the daughter cell, as average distances larger than 2.5 µm were observed for ∼8 min. Interestingly, this stretched state of the daughter cell–directed rDNA locus was reduced in the rrn3 ts mutant, as it lasted only ∼2 min on average. Together, these data indicate that transcription by pol I sets the timing of rDNA segregation and intensifies chromosome stretching. These observations confirm earlier work that showed that pol I transcriptional activity can interfere with rDNA segregation (Machin et al., 2006; Tomson et al., 2006).
FIGURE 7:

Altered timing of rDNA segregation in an rrn3 ts mutant. A tetO array was introduced at the telomere-proximal flank of the rDNA locus and visualized by tetR-GFP. (A, B) Mitotic segregation of the rDNA dot and Spc42-3mCherry in (A) RRN3 and (B) rrn3 ts cells at 37°C. Rrn3 was inactivated in growing, nonsynchronized cells by a shift to 37°C for 30 min before time series of 28 min at 37°C were acquired. t = 0 is the last point in time with SPB–SPB distance <3 µm. Scale bars, 5 µm. (C) SPB–SPB distance in RRN3 and rrn3 ts cells over time. Mean values and SDs (n = 10). (D) Percentage of RRN3 and rrn3 ts cells showing segregated rDNA dots (distance permanently >1 µm) over time. (E) Distance of rDNA dot and SPB over time for mother-directed chromatids in RRN3 and rrn3 ts cells. Mean values and SDs are given. (F) Distance of rDNA dot and SPB over time for daughter-directed chromatids in RRN3 and rrn3 ts cells. Mean values and SDs are given. (G) Scheme to illustrate the distances measured in C–F.
To further evaluate the effect of pol I transcription on the mitotic segregation of nucleolar components, we tested cells lacking the nonessential Rpa12 subunit of pol I. Synthesis of pre-rRNA and cell growth are reduced in the rpa12 deletion mutant (Nogi et al., 1991, 1993). Nuclear division and chromosome segregation proceeded normally, as indicated by measurements of mCherry-NLS and H2A-GFP (Supplemental Figure 7, A and B). The absence of Rpa12 had some influence on pol I levels and nucleolar integrity, as the Rpa135-GFP signal was reduced in rpa12 cells and a minor portion of Nop56-GFP, and Nsr1-GFP localized to speckles in the nucleus (Supplemental Figure 7, C and D). Still, the major part of these proteins localized to characteristic nucleolar structures during interphase and mitosis. Signal quantification revealed that in rpa12 mutant cells the fractions of Rpa135-GFP, Nop56-GFP, and Nsr1-GFP passed on to the daughter cell nucleolus were lower than with wild-type cells, indicating an increased mother cell segregation bias (Figure 8, A–C). This contrasted with the behavior of Fob1-GFP, whose nucleolar localization and equal segregation pattern remained essentially unchanged (Figure 8D). These data substantiate the notion that transcription by pol I facilitates transmission of the pol I and pre-rRNA processing machineries to the daughter cell nucleolus in mitosis.
FIGURE 8:

Increased asymmetry of pol I and processing factors in a rpa12 mutant. (A–D) Mitotic segregation of (A) Rpa135-GFP, (B) Nop56-GFP, (C) Nsr1-GFP, and (D) Fob1-GFP in RPA12 and rpa12 cells. t = 0 is the first point in time with completely segregated mother and daughter signals in the GFP channel. Scale bars, 5 µm. Box plots depict the percentage of total nuclear signal inherited by daughter cells (from top to bottom: n = 13, 12; 17, 15; 12, 14; 10, 10; *p < 0.05; **p < 0.01; ***p < 0.001).
Transcription by RNA polymerase I during mitosis
Because our studies had indicated that defects in pol I compromised the mitotic inheritance of nucleolar components, we were interested in determining the transcriptional activity of pol I during mitosis in budding yeast. To this end, we synchronized yeast cells by release from a pheromone-induced arrest in G1 and took samples of cells that had completed S-phase at 8-min intervals to adequately resolve mitotic progression. To measure transcription by pol I, we quantified the levels of the newly synthesized pre-rRNA by reverse transcription-quantitative real-time PCR (RT-qPCR), using primers that span the A0 and A1 cleavage sites in the 5´ external transcribed spacer region (Supplemental Figure 9). Owing to their rapid cleavage, the corresponding regions are present only in the newly synthesized rRNA precursor and their level can therefore be used as a measure of pol I activity. This type of assay has been used before by others (Clemente-Blanco et al., 2009; Iacovella, Golfieri, et al., 2015). As a positive control, we also used this RT-qPCR assay to measure pol I transcription in rrn3 ts mutant cells. Following a shift to 37°C for 30 min, levels of the A0 and A1 cleavage site-spanning fragments decreased by a factor of 25 and 32, respectively (Figure 9, A and E), confirming that this assay is suitable to measuring pol I transcription. To monitor cell cycle progression, we also followed the cellular DNA content (Figure 9B), cell and nuclear morphologies (Figure 9C), and levels of the cell cycle–regulated CLB2, SIC1, and CTS1 mRNAs (Figure 9D), which are known to peak one after the other during nuclear and cell division (Spellman, Sherlock, et al., 1998; Rowicka et al., 2007). As expected, CLB2 mRNA was maximal at the onset of anaphase (68–76 min), when cells carrying an elongated nucleus started to appear. SIC1 mRNA was maximal ∼20 min later (92 min), when the fraction of cells with divided nuclei was maximal. CTS1 mRNA peaked during cytokinesis (108–116 min) where the percentage of budded cells reached a minimum. Unlike the cell cycle–regulated mRNAs, whose levels fluctuated 6 (CLB2)-, 10.4 (SIC1)-, or 35.5 (CTS1)-fold, levels of the mature 18S rRNA varied by a factor of 1.3, and levels of the pre-rRNA also stayed relatively constant, with a maximum change of 1.7-fold (Figure 9, A, D, and E). In the case of the pre-rRNA, levels tended to increase slightly during anaphase and decreased again moderately with the onset of cytokinesis. To estimate the extent of technical deviation, we performed a biological replication of the cell synchrony experiment as well as technical replications of the reverse transcription and qPCRs (Supplemental Figures 10 and 11). These data confirm that pre-rRNA levels are mostly constant during mitosis. Together, these data indicate that rDNA transcription by pol I remains active during anaphase in budding yeast.
DISCUSSION
In this study we analyzed by live-cell imaging how the single nucleolus of budding yeast is partitioned between the mother and daughter cells during nuclear division. We observed that the nucleolus is not passed on as a uniform entity, but is reorganized in its protein composition upon segregation of the rDNA locus in mitosis. While several rDNA-bound proteins were distributed equally, daughter cells received only about one-third of pol I and certain ribosome biogenesis factors. To explain this differential segregation of nucleolar proteins, we propose a model illustrated in Figure 10. On the basis of the available data, we consider the nucleolus a highly coherent network formed by multivalent interactions among various nucleolar proteins and nucleic acids. A previous study suggested that nucleolar proteins are highly mobile in the nuclei of mammalian cells (Dundr et al., 2002). However, extrachromosomal nucleoli from Xenopus laevis oocytes behave like liquid droplets (Brangwynne et al., 2011), suggesting a highly coherent, yet dynamic, architecture of the nucleolus. In the case of budding yeast, live-cell imaging and computational modelling indicated that phase separation of the rDNA from the rest of the genome might play a major role in organizing the nucleolus (Albert, Mathon, et al., 2013; Hult et al., 2017). The view of the budding yeast nucleolus as a coherent network is further supported by our photobleaching experiments. On a time scale of minutes, pol I subunits and rRNA processing factors failed to equilibrate between the separated nucleoli of anaphase cells, providing evidence for their stable residence in the nucleolus during mitosis (Figure 3). Thus, the budding yeast nucleolus might be a complex multiphase “droplet” even though it does not assume a spherical shape. Spatial constraints such as anchorage of the rDNA to the nuclear envelope (Mekhail et al., 2008) might counteract surface tension–driven sphericity.
FIGURE 10:

Model for the mitotic inheritance of nucleolar proteins in budding yeast. (A) The nucleolus is a dynamic multicomponent assembly showing a high degree of coherence. Multiple protein–protein, protein–nucleic acid, and nucleic acid–nucleic acid interactions contribute to this behavior. Active and inactive factors can reside in the nucleolus. (B) During anaphase, the chromatid transmitted from the mother to the daughter cell body undergoes stretching and recoiling. Transcription by pol I in anaphase causes efficient association of pol I and processing factors with rDNA. This results in cohesive forces between rDNA sister arrays and facilitates efficient transport of the engaged rRNA transcription and processing machineries into the daughter nucleus. (C) Following anaphase, mother and daughter nucleoli contain equal numbers of proteins stably binding to rDNA. The noncollectively and nonpermanently associated transcription and processing components are inherited asymmetrically.
During anaphase, one of the sister rDNA arrays is transported out of the nucleolar interaction network located in the mother cell body in a rapid and highly polar manner. In line with previous reports on residual cohesion of chromosomes, catenation, and pol I-dependent rDNA linkages (Machin et al., 2006; Tomson et al., 2006; Renshaw et al., 2010; Titos et al., 2014), we observed more intense stretching and recoiling of the daughter cell–directed rDNA array (Figures 4 and 7), as well as completion of rDNA segregation ahead of schedule following inhibition of rDNA transcription by pol I through the rrn3 ts mutation (Figure 7). We envisage that the rDNA array pulled out of the coherent nucleolar network serves as a carrier for the transmission of nucleolar proteins to the daughter cell, so that components tightly associated with the rDNA locus or with emerging pre-rRNA transcripts will be passed on efficiently to the daughter cell. This is expected to be the case for the actively engaged pool of pol I and processing factors. For the nonengaged fraction, however, rDNA-independent nucleolar coherence forces may prevail, hindering daughter-directed transport and supporting preferential retention in the mother cell nucleolus. Thus, a pool of nonengaged molecules, together with the polarity of chromosome segregation, is suggested to be the source of the observed asymmetry in the partitioning of pol I and processing factors in yeast mitosis (Figures 2 and 10). Indeed, a substantial fraction of pol I and processing factors still localized to the nucleolus after inactivation of pol I transcription (Figures 6 and 9; Supplemental Figures 6 and 10) and a smaller portion was passed on to the daughter cell nucleolus under these conditions (Figures 6 and 8). In addition, the existence of a pool of unengaged pol I has been reported for mammalian cells (Dundr et al., 2002; Mais, Wright, et al., 2005). Further support for our model comes from the observation that the asymmetry of nucleolar protein segregation was reduced in the mother cell–confined nonpolar chromosome segregation events of dyn1 mutant cells (Figures 4 and 5).
Unlike pol I, the SSU subunit Nop56, and the nucleolin Nsr1, which segregated asymmetrically, GFP-fused subunits of the CF and UAF, as well as the RFB protein Fob1, partitioned equally between the mother and daughter cell nucleoli (Figure 2). According to our model, we expect these factors to bind rDNA tightly and lack any substantial pool of unbound protein in the nucleolus. This view is supported by the low abundance of these proteins (Ghaemmaghami et al., 2003) and by biochemical work that indicated stable association of the CF subunits Rrn6 and Rrn7, as well as UAF, with the rDNA promoter (Keys et al., 1994; Keys, Lee, et al., 1996). In addition, a recent study reported that Fob1, unlike other nucleolar proteins, stayed associated with the rDNA during starvation-induced nucleophagy (Mostofa et al., 2018), supporting the view of persistent rDNA binding by Fob1.
Another important aspect of our model concerns the role of rDNA transcription in mitosis. We observed that acute inactivation or chronic reduction of transcription by pol I reduced the fraction of pol I and processing factors partitioned to the daughter cell (Figures 6 and 8). This suggests that rDNA transcription supports nucleolar inheritance, likely through providing a sufficiently stable link to the rDNA array transmitted to the daughter cell. Indeed, quantitative analysis of pre-rRNA levels indicated that rDNA transcription persists during mitosis. Essentially constant levels, with fluctuations by no more than 1.7-fold, were found by RT-qPCR analysis of samples taken from synchronized cells at short intervals (Figure 9; Supplemental Figures 10 and 11). This analysis, done in two biological and several technical replicates, recovered the known cell cycle fluctuation of the CLB2, SIC1, and CTS1 mRNAs and a decrease of pre-rRNA levels by more than 25-fold following acute pol I inactivation in the rrn3 ts mutant (Figure 9). Consistent with our findings and interpretation, stable levels of pre-rRNA during mitosis (Iacovella, Golfieri, et al., 2015) and rDNA transcription in anaphase (de los Santos-Velazquez, de Oya, Manzano-Lopez, and Monje-Casas, 2017) were reported by others. Moreover, forced inhibition of pol I resulted in premature rDNA segregation (Figure 7D; Machin et al., 2006; Tomson et al., 2006), indicating that no such global inhibition of pol I occurs during normal, unperturbed mitosis. We therefore conclude that rDNA transcription is active during yeast mitosis and facilitates nucleolar inheritance.
A previous study reported on the inhibition of rDNA transcription in yeast mitosis serving as a prerequisite for the condensation and segregation of the rDNA locus proposed (Clemente-Blanco et al., 2009). To reconcile these observations, we assume that rDNA transcription in mitosis may be down-regulated only partially, so that transcription by pol I remains sufficiently active to support the segregation of nucleolar components to daughter cells. Indeed, rDNA transcription by pol I in anaphase and condensin-mediated rDNA compaction in anaphase need not necessarily hinder each other. The rDNA repeats of budding yeast are known to occur in distinct chromatin states: transcriptionally active repeats bound by the HMG-like protein Hmo1, and transcriptionally silent repeats with nucleosomal organization (Conconi et al., 1989; Merz et al., 2008). rDNA repeats organized in these distinct chromatin states have been shown to coexist in mitosis (Wittner et al., 2011). The presence of inactive repeats may provide adequate condensin binding capacity and render at least global pol I inactivation superfluous. Thus, rDNA compaction and segregation may come along with ongoing rDNA transcription in anaphase to ensure a continuous supply of ribosome building blocks and to support inheritance of the pol I transcription and ribosome biogenesis machineries.
The chromosomal rDNA locus is partitioned equally between mother and daughter cells and according to our model serves as a carrier for nucleolar proteins. However, rDNA does not occur exclusively in the chromosomal context in budding yeast. Owing to its repetitive nature, rDNA is prone to intrachromosomal recombination, resulting in formation of extrachromosomal rDNA circles (ERCS) (Sinclair and Guarente, 1997). ERCs are a cause for aging in yeast and are retained in mother cells, so that the newborn daughters are rejuvenated. Moreover, activity of the longevity factor and protein deacetylase Sir2 suppresses intrachromosomal recombination at the rDNA-locus and hence the generation of ERCs (Gottlieb and Esposito, 1989; Kaeberlein, McVey, and Guarente, 1999). To assess whether ERCs might contribute to the asymmetric distribution of nucleolar proteins, we investigated the mitotic segregation of Rpa135-GFP in sir2 mutant cells that are known to carry increased levels of ERCs (Kaeberlein, McVey, and Guarente, 1999). No significant change in the segregation bias of Rpa135-GFP was observed in the sir2 mutant (Supplemental Figure 12). We therefore conclude that ERCs do not make a major contribution to the nucleolar asymmetry observed in this study.
The asymmetric segregation of nucleolar components might serve relevant biological functions. Owing to the differential inheritance of pol I and processing factors, initial rates of rDNA transcription are expected to be lower in newborn daughter cells. This might contribute to the special characteristics of daughter cells, such as their lengthened G1 cell cycle period, and might balance rRNA with ribosomal protein production, presumably reduced as well in the small daughter cells. In addition, the preferential inheritance of the actively engaged fraction of pol I and processing factors might serve as a built-in quality control system for retaining damaged or otherwise nonfunctional molecules in the nucleolar network of the mother cell and for supplying specifically active factors to the daughter cell. Thus, the unequal transmission of nucleolar proteins might add to a growing list of quality control mechanisms associated with the asymmetric cell division of budding yeast (Higuchi-Sanabria et al., 2014). To test for possible contributions of the differential nucleolar protein inheritance to the fitness and rejuvenation of daughter cells is an important objective for the future.
MATERIALS AND METHODS
Yeast methods and strains
For growth, transformation, mating and sporulation of budding yeast cells, standard protocols were used (Ausubel et al., 2005). Strains used in this study are listed in Supplemental Table 1 and are isogenic derivatives of W303 or S288c as indicated. Deletion strains rpa12, dyn1, and sir2 were purchased from EUROSCARF, Frankfurt. In the W303 background, dyn1 was deleted by transformation of a PCR based deletion construct (Longtine et al., 1998). The thermosensitive rrn3 (S213P) mutant originates from the study of Claypool, French, et al. (2004; strain NOY1075). YPD+ (10 g/l yeast extract, 20 g/l peptone, 2% glucose, 0.2 g/l tryptophan, 0.1 g/l adenine, 10 mM KH2PO4) was used as a standard growth medium.
DNA constructs and genetic manipulations
For endogenous tagging with fluorescent protein genes, different strategies were used. The PCR-based pFA6a (Longtine et al., 1998) and pFA6a-link (Sheff and Thorn, 2004), as well as a plasmid-based approach, were used. For the plasmid-based approach, C-terminal fragments of the genes of interest were PCR-amplified, sequenced, and finally cloned into pRS-based (Sikorski and Hieter, 1989) GFP or mCherry plasmids. Plasmids were linearized within the C-terminal fragment using a single cutter enzyme for integration at the respective endogenous locus. The mCherry-NLS construct (pTEF2-mCherry-SWI5(codons 569–709)S646A/S664A-MYC13-tCYC1) has been described (Arnold, Höckner, and Seufert, 2015). It consists of the constitutive TEF2 promoter, mCherry, a SWI5-derived NLS fragment, and a myc13 epitope. Serine residues S646 and S664 within the Swi5-NLS were mutated to alanine to confer permanent nuclear localization (Moll et al., 1991; Arnold, Höckner, and Seufert, 2015). The mCherry-NLS construct was integrated at the HIS3, URA3, or TRP1 marker locus as indicated (Supplemental Table 1). In the case of Spc42, no endogenous tagging was done but a plasmid carrying a pSPC42-SPC42-3mCherry construct was integrated into the genome at the TRP1 locus. For chromosome dots at the telomere proximal flank of the rDNA-array, the 3′ UTR of YLR163C was cloned into a plasmid containing 112x tetO-repeats. The plasmid was linearized for integration at the YLR163C locus. Visualization of tetO-arrays was done by a pURA3-NLS-TetR-GFP construct. The original tetR-GFP and 112xtetO plasmids were provided by Kim Nasmyth (Oxford University, UK; plasmids 3524 and 3525, respectively; Michaelis et al., 1997). Disruption of BAR1 was done by insertion of a functional LEU2-cassette into the BAR1-coding sequence (XbaI-digested plasmid pZV77).
Fluorescence microscopy, image processing, and quantification
To follow budding and chromosome segregation in synchronized cells, ethanol-fixed samples were resuspended in sodium citrate (50 mM, pH 7.0), sonicated, and stained with 4′,6-diamidino-2-phenylindole (DAPI; Sigma-Aldrich, St. Louis, MO). DAPI-stained cells were analyzed on an Axio Imager.M1 (Carl Zeiss) using AxioVision software (Carl Zeiss) and an AxioCam MRm (Carl Zeiss).
For live-cell microscopy, cultures were grown overnight at 25°C in YPD+ containing 2% glucose. The next day, cells in the exponential growth phase were harvested, resuspended in water to remove YPD+, pipetted on cover slides, and covered with an agarose block containing synthetic complete medium (2% glucose, yeast nitrogen base, amino acids, nucleobases) for analysis in an inverted microscope. Wild-type and mutant strains used for comparison of fluorescence signals were generated by mating and sporulation to ensure equivalence of marker-integrated gene constructs. Spinning-disk microscopy was done with an Axio Observer.Z1 (Carl Zeiss) in combination with a CSU-X1 spinning disk unit (Yokogawa), an AxioCam MRm (Carl Zeiss) for detection, and AxioVision or ZEN software (Carl Zeiss). Fourteen z-slices with a distance of 400 nm were acquired. FLIP experiments were done using a TCS-SP8 confocal laser scanning microscope (Leica) with photomultiplier tubes (Leica) and Leica Application Suite software (Leica). Fourteen z-slices with a distance of 430 nm were acquired. The appointed areas were bleached 15 times at high laser intensity to effectively erase the fluorescence signal (one bleaching event taking 1.736 s). Plan Apochromat 63×/1.40 oil objectives were used for all microscopy. mCherry and GFP were excited using 561- and 488-nm laser lines, respectively. Most experiments were performed at room temperature (20–23°C). For the rrn3 ts experiments, cells were pipetted in eight-well µ-slides (ibidi), covered with an agarose block, and preincubated at the microscope for 30 min in a heating chamber (ibidi) with lid and plate set to 37°C. Heating continued during time-lapse microscopy. All movies were of duration 28 min. The ibidi system was also used for growth analysis under microscopy conditions at 25°C (Supplemental Figure 2).
Image processing was done using the software ImageJ (National Institutes of Health, Bethesda, MD; Schneider et al., 2012). For quantification of mCherry-NLS, H2A-GFP, Rpa190-GFP, Rpa135-GFP, Rpa43-GFP and Nop56-GFP, z-stacks were summed up, the mean background value calculated from regions outside cells was subtracted, and the Raw Integrated Density of the nuclear/nucleolar population was measured. Owing to prominent cytoplasmic portions and/or weak signal intensities close to background levels, Nsr1-GFP, Rrn6-GFP, Rrn7-GFP Rrn5-GFP, Rrn10-GFP, and Fob1-GFP were quantified from unprojected z-stacks using the 3D object counter plugin for ImageJ (Bolte and Cordelières, 2006; http://imagejdocu.tudor.lu/doku.php?id=plugin:analysis:3d_object_counter:start; Schneider et al., 2012). The mean background value was calculated from regions outside cells for single z-planes and subtracted. To quantitate the segregation of fluorescence signals, total signals in mother- and daughter-located parts of anaphase nuclei/nucleoli were averaged for three time points after complete segregation, as defined by threshold setting. The daughter signal, as a percentage of the total signal, was then determined by normalization of the daughter portion to the added mother and daughter signal. In the case of concentration, volume, and distance measurements, the 3D object counter plug-in was used to determine integrated signal values, volumes, or center-of-mass coordinates in xyz, respectively. Distances in xyz were calculated in Excel (Microsoft) using the center-of-mass coordinates and the Euclidean distance formula. Threshold settings were used for all image evaluation mentioned above. For line intensity plots, maximum projections of z-stacks were used and the mean background values calculated from regions outside cells were subtracted.
Cell synchronization, sample collection, RNA extraction, and RT-qPCR
For cell synchronization, cultures of bar1 cells were grown in YPD+ at 25°C and treated with 50 ng/ml α-factor for 2 h. Cells were washed twice with YPD+ and released into fresh medium. Cell samples for flow cytometry analysis and DAPI staining were centrifuged for 2 min at 2000 rpm, resuspended in water, and fixed using ethanol. Cells for RNA extraction were centrifuged for 2 min at 2000 rpm, resuspended in ice-cold water, and centrifuged for 15 s at 13,200 rpm and 4°C. The supernatant was removed, and cell pellets were immediately frozen on dry ice. For extraction of RNA, a hot acid phenol/chloroform procedure was used (modified from Collart and Oliviero, 1993). Frozen cell pellets were resuspended in 400 µl TES solution (10 mM Tris/HCl, pH 7.5, 10 mM EDTA, 0.5% SDS) and 400 µl acid phenol preheated to 65°C was added. After brief vortexing, samples were incubated at 65°C for 1 h and vortexed every 10 min. Samples were placed on ice for 5 min and centrifuged for 5 min at 13,200 rpm and 4°C, and the aqueous phase was transferred to a clean tube. Hot acid phenol (400 µl) was added to the aqueous phase and samples were placed on ice for 5 min and centrifuged for 5 min at 13,200 rpm and 4°C. The aqueous phase was transferred to a clean tube, 400 µl chloroform was added, and samples were vortexed and centrifuged for 5 min at 13,200 rpm and 4°C. The aqueous phase was transferred to a clean tube and 40 µl of 3 M sodium acetate (pH 5.3) was added, as well as 1 ml ice-cold ethanol. RNA was precipitated at –80°C for at least 20 min, pelleted by centrifugation at 13,200 rpm and 4°C (original experiment: 5 min; biological replicate: 30 min), washed with 70% ice-cold ethanol, and dissolved in water. RNA concentrations were determined photometrically (BioPhotometer; Eppendorf), and quality assessment was done by agarose gel electrophoresis and ethidium bromide staining. For cDNA-synthesis, the QuantiNova Reverse Transcription Kit (Qiagen) was used according to the manufacturer’s instructions. To test for genomic DNA contamination, controls using water instead of the reverse transcriptase enzyme were tested. The QuantiNova SYBR Green PCR Kit (Qiagen) was used for RT-qPCR and reactions were run on a Rotor-Gene Q machine (Qiagen) using an identical gain setting for all runs. Reactions for samples and controls were run in triplicate, and identical threshold settings were used for all quantifications executed with the Rotor-Gene Q Series Software (Qiagen). Primer sequences are given in Supplemental Table 2.
Flow cytometry
Flow cytometry was done as described in Geil et al., 2008. A CyFlow Space cytometer (Partec, Münster, Germany) was used, and 20,000 cells were analyzed for each sample to obtain DNA profiles.
Protein analysis
Growing cultures were harvested and cells were resuspended in 1 ml ice-cold H2O. A lysis buffer (150 µl: 150 mM NaCl, 50 mM Tris-HCl, pH 7.5, 50 mM NaF, 5 mM EDTA, 0.1% IGEPAL CA-630) was added and cells were lysed by shaking with an equal volume of glass beads in a mixer mill (Retsch, Haan, Germany) at 4°C. Cell debris was pelleted by centrifugation for 3 min at 13,200 rpm and 4°C. Equal volumes of protein lysate and 2× Laemmli sample buffer were mixed and incubated for 10 min at 100°C. SDS–PAGE and Western blot analysis were performed as described in Schwab et al. (1997, 2001). Mouse monoclonal anti-GFP antibody (Roche, Basel, Switzerland) and goat anti-mouse IRDye 800 antibody (LI-COR Biosciences) were used for detection with an Odyssey Infrared Imaging System (LI-COR Biosciences, Bad Homburg, Germany).
Graphs and statistical analyses
Box plots and statistical analyses were done with the software Origin (OriginLab Corporation). Box plots are defined as follows: the central box spans the quartiles Q1 and Q3, the line inside the box represents the median, and a square represents the mean. Whiskers extending from the quartiles have a maximum length of 1.5 × interquartile range (IQR). Values <Q1 – 1.5 × IQR or >Q3 + 1.5 × IQR are considered outliers. For statistical analyses, a two-sample, two-sided, unpaired Student’s t test and the unequal-variance t-procedure were used. Outliers were excluded from statistical analyses. Graphs other than box plots were done in Excel (Microsoft).
Supplementary Material
Acknowledgments
We thank Andrea Brücher, Antje Machetanz-Morokane, and Adelheid Weissgerber for technical assistance; Frank Sprenger and Philipp Milkereit for discussion; Herbert Tschochner for providing the rrn3 ts strain; and Kim Nasmyth for providing the tet0/tetR-GFP plasmids.
Abbreviations used:
- CF
core factor
- ERCs
extrachromosomal rDNA circles
- FLIP
fluorescence loss in photobleaching
- GFP
green fluorescent protein
- IQR
interquartile range
- NLS
nuclear localization sequence
- NOR
nucleolar organizer region
- pol I
RNA polymerase I
- rDNA
ribosomal DNA
- RT-qPCR
reverse transcription-quantitative real-time PCR
- SPB
spindle pole body
- SSU
small subunit
- tetO
tetracycline operator
- tetR
tetracycline repressor
- UAF
upstream activating factor
Footnotes
This article was published online ahead of print in MBoC in Press (http://www.molbiolcell.org/cgi/doi/10.1091/mbc.E18-08-0524) on January 9, 2019.
REFERENCES
- Albert B, Mathon J, Shukla A, Saad H, Normand C, Leger-Silvestre I, Villa D, Kamgoue A, Mozziconacci J, Wong H, et al (2013). Systematic characterization of the conformation and dynamics of budding yeast chromosome XII. J Cell Biol , 201–210. [DOI] [PMC free article] [PubMed] [Google Scholar]
- Albert B, Perez-Fernandez J, Leger-Silvestre I, Gadal O. (2012). Regulation of ribosomal RNA production by RNA polymerase I: does elongation come first? Genet Res Int , 276948. [DOI] [PMC free article] [PubMed] [Google Scholar]
- Arnold L, Hockner S, Seufert W. (2015). Insights into the cellular mechanism of the yeast ubiquitin ligase APC/C-Cdh1 from the analysis of in vivo degrons. Mol Biol Cell , 843–858. [DOI] [PMC free article] [PubMed] [Google Scholar]
- Ausubel FM, Brent R, Kingston RE, Moore DD, Seidman JG, Smith JA, Struhl K. (eds.) (2005). Current Protocols in Molecular Biology, New York: John Wiley & Sons. [Google Scholar]
- Barandun J, Chaker-Margot M, Hunziker M, Molloy KR, Chait BT, Klinge S. (2017). The complete structure of the small-subunit processome. Nat Struct Mol Biol , 944–953. [DOI] [PMC free article] [PubMed] [Google Scholar]
- Barandun J, Hunziker M, Klinge S. (2018). Assembly and structure of the SSU processome-a nucleolar precursor of the small ribosomal subunit. Curr Opin Struct Biol , 85–93. [DOI] [PMC free article] [PubMed] [Google Scholar]
- Boettcher B, Marquez-Lago TT, Bayer M, Weiss EL, Barral Y. (2012). Nuclear envelope morphology constrains diffusion and promotes asymmetric protein segregation in closed mitosis. J Cell Biol , 921–937. [DOI] [PMC free article] [PubMed] [Google Scholar]
- Boisvert FM, van Koningsbruggen S, Navascues J, Lamond AI. (2007). The multifunctional nucleolus. Nat Rev Mol Cell Biol , 574–585. [DOI] [PubMed] [Google Scholar]
- Bolte S, Cordelieres FP. (2006). A guided tour into subcellular colocalization analysis in light microscopy. J Microsc , 213–232. [DOI] [PubMed] [Google Scholar]
- Brangwynne CP, Mitchison TJ, Hyman AA. (2011). Active liquid-like behavior of nucleoli determines their size and shape in Xenopus laevis oocytes. Proc Natl Acad Sci USA , 4334–4339. [DOI] [PMC free article] [PubMed] [Google Scholar]
- Chaker-Margot M, Barandun J, Hunziker M, Klinge S. (2017). Architecture of the yeast small subunit processome. Science , eaal1880. [DOI] [PubMed] [Google Scholar]
- Claypool JA, French SL, Johzuka K, Eliason K, Vu L, Dodd JA, Beyer AL, Nomura M. (2004). Tor pathway regulates Rrn3p-dependent recruitment of yeast RNA polymerase I to the promoter but does not participate in alteration of the number of active genes. Mol Biol Cell , 946–956. [DOI] [PMC free article] [PubMed] [Google Scholar]
- Clemente-Blanco A, Mayan-Santos M, Schneider DA, Machin F, Jarmuz A, Tschochner H, Aragon L. (2009). Cdc14 inhibits transcription by RNA polymerase I during anaphase. Nature , 219–222. [DOI] [PMC free article] [PubMed] [Google Scholar]
- Collart MA, Oliviero S. (1993). Preparation of yeast RNA. In: Current Protocols in Molecular Biology, ed. Ausubel FM, Brent R, Kingston RE, Moore DD, Seidman JG, Smith JA, Struhl K, New York: John Wiley & Sons, Chapter 13.12. [DOI] [PubMed] [Google Scholar]
- Conconi A, Widmer RM, Koller T, Sogo JM. (1989). Two different chromatin structures coexist in ribosomal RNA genes throughout the cell cycle. Cell , 753–761. [DOI] [PubMed] [Google Scholar]
- D’Amours D, Stegmeier F, Amon A. (2004). Cdc14 and condensin control the dissolution of cohesin-independent chromosome linkages at repeated DNA. Cell , 455–469. [DOI] [PubMed] [Google Scholar]
- de Los Santos-Velazquez AI, de Oya IG, Manzano-Lopez J, Monje-Casas F. (2017). Late rDNA condensation ensures timely Cdc14 release and coordination of mitotic exit signaling with nucleolar segregation. Curr Biol , 3248–3263.e3245. [DOI] [PubMed] [Google Scholar]
- Donaldson AD, Kilmartin JV. (1996). Spc42p: a phosphorylated component of the S. cerevisiae spindle pole body (SPD) with an essential function during SPB duplication. J Cell Biol , 887–901. [DOI] [PMC free article] [PubMed] [Google Scholar]
- Dragon F, Gallagher JE, Compagnone-Post PA, Mitchell BM, Porwancher KA, Wehner KA, Wormsley S, Settlage RE, Shabanowitz J, Osheim Y, et al (2002). A large nucleolar U3 ribonucleoprotein required for 18S ribosomal RNA biogenesis. Nature , 967–970. [DOI] [PMC free article] [PubMed] [Google Scholar]
- Dundr M, Hoffmann-Rohrer U, Hu Q, Grummt I, Rothblum LI, Phair RD, Misteli T. (2002). A kinetic framework for a mammalian RNA polymerase in vivo. Science , 1623–1626. [DOI] [PubMed] [Google Scholar]
- Eshel D, Urrestarazu LA, Vissers S, Jauniaux JC, van Vliet-Reedijk JC, Planta RJ, Gibbons IR. (1993). Cytoplasmic dynein is required for normal nuclear segregation in yeast. Proc Natl Acad Sci USA , 11172–11176. [DOI] [PMC free article] [PubMed] [Google Scholar]
- Fuchs J, Loidl J. (2004). Behaviour of nucleolus organizing regions (NORs) and nucleoli during mitotic and meiotic divisions in budding yeast. Chromosome Res , 427–438. [DOI] [PubMed] [Google Scholar]
- Geil C, Schwab M, Seufert W. (2008). A nucleolus-localized activator of Cdc14 phosphatase supports rDNA segregation in yeast mitosis. Curr Biol , 1001–1005. [DOI] [PubMed] [Google Scholar]
- Ghaemmaghami S, Huh WK, Bower K, Howson RW, Belle A, Dephoure N, O’Shea EK, Weissman JS. (2003). Global analysis of protein expression in yeast. Nature , 737–741. [DOI] [PubMed] [Google Scholar]
- Gottlieb S, Esposito RE. (1989). A new role for a yeast transcriptional silencer gene, SIR2, in regulation of recombination in ribosomal DNA. Cell , 771–776. [DOI] [PubMed] [Google Scholar]
- Granot D, Snyder M. (1991). Segregation of the nucleolus during mitosis in budding and fission yeast. Cell Motil Cytoskeleton , 47–54. [DOI] [PubMed] [Google Scholar]
- Grob A, Colleran C, McStay B. (2014). Construction of synthetic nucleoli in human cells reveals how a major functional nuclear domain is formed and propagated through cell division. Genes Dev , 220–230. [DOI] [PMC free article] [PubMed] [Google Scholar]
- Grob A, McStay B. (2014). Construction of synthetic nucleoli and what it tells us about propagation of sub-nuclear domains through cell division. Cell Cycle , 2501–2508. [DOI] [PMC free article] [PubMed] [Google Scholar]
- Harrison BD, Hoang ML, Bloom K. (2009). Persistent mechanical linkage between sister chromatids throughout anaphase. Chromosoma , 633–645. [DOI] [PMC free article] [PubMed] [Google Scholar]
- Hernandez-Verdun D. (2011). Assembly and disassembly of the nucleolus during the cell cycle. Nucleus , 189–194. [DOI] [PMC free article] [PubMed] [Google Scholar]
- Higuchi-Sanabria R, Pernice WM, Vevea JD, Alessi Wolken DM, Boldogh IR, Pon LA. (2014). Role of asymmetric cell division in lifespan control in Saccharomyces cerevisiae. FEMS Yeast Res , 1133–1146. [DOI] [PMC free article] [PubMed] [Google Scholar]
- Hult C, Adalsteinsson D, Vasquez PA, Lawrimore J, Bennett M, York A, Cook D, Yeh E, Forest MG, Bloom K. (2017). Enrichment of dynamic chromosomal crosslinks drive phase separation of the nucleolus. Nucleic Acids Res , 11159–11173. [DOI] [PMC free article] [PubMed] [Google Scholar]
- Iacovella MG, Golfieri C, Massari LF, Busnelli S, Pagliuca C, Dal Maschio M, Infantino V, Visintin R, Mechtler K, Ferreira-Cerca S, De Wulf P. (2015). Rio1 promotes rDNA stability and downregulates RNA polymerase I to ensure rDNA segregation. Nat Commun , 6643. [DOI] [PubMed] [Google Scholar]
- Jorgensen P, Edgington NP, Schneider BL, Rupes I, Tyers M, Futcher B. (2007). The size of the nucleus increases as yeast cells grow. Mol Biol Cell , 3523–3532. [DOI] [PMC free article] [PubMed] [Google Scholar]
- Kaeberlein M, McVey M, Guarente L. (1999). The SIR2/3/4 complex and SIR2 alone promote longevity in Saccharomyces cerevisiae by two different mechanisms. Genes Dev , 2570–2580. [DOI] [PMC free article] [PubMed] [Google Scholar]
- Keys DA, Lee BS, Dodd JA, Nguyen TT, Vu L, Fantino E, Burson LM, Nogi Y, Nomura M. (1996). Multiprotein transcription factor UAF interacts with the upstream element of the yeast RNA polymerase I promoter and forms a stable preinitiation complex. Genes Dev , 887–903. [DOI] [PubMed] [Google Scholar]
- Keys DA, Vu L, Steffan JS, Dodd JA, Yamamoto RT, Nogi Y, Nomura M. (1994). RRN6 and RRN7 encode subunits of a multiprotein complex essential for the initiation of rDNA transcription by RNA polymerase I in Saccharomyces cerevisiae. Genes Dev , 2349–2362. [DOI] [PubMed] [Google Scholar]
- Khmelinskii A, Lawrence C, Roostalu J, Schiebel E. (2007). Cdc14-regulated midzone assembly controls anaphase B. J Cell Biol , 981–993. [DOI] [PMC free article] [PubMed] [Google Scholar]
- Knutson BA, Luo J, Ranish J, Hahn S. (2014). Architecture of the Saccharomyces cerevisiae RNA polymerase I Core Factor complex. Nat Struct Mol Biol , 810–816. [DOI] [PMC free article] [PubMed] [Google Scholar]
- Kobayashi T. (2003). The replication fork barrier site forms a unique structure with Fob1p and inhibits the replication fork. Mol Cell Biol , 9178–9188. [DOI] [PMC free article] [PubMed] [Google Scholar]
- Kondo K, Inouye M. (1992). Yeast NSR1 protein that has structural similarity to mammalian nucleolin is involved in pre-rRNA processing. J Biol Chem , 16252–16258. [PubMed] [Google Scholar]
- Kos M, Tollervey D. (2010). Yeast pre-rRNA processing and modification occur cotranscriptionally. Mol Cell , 809–820. [DOI] [PMC free article] [PubMed] [Google Scholar]
- Kressler D, Hurt E, Bassler J. (2010). Driving ribosome assembly. Biochim Biophys Acta , 673–683. [DOI] [PubMed] [Google Scholar]
- Kuhn CD, Geiger SR, Baumli S, Gartmann M, Gerber J, Jennebach S, Mielke T, Tschochner H, Beckmann R, Cramer P. (2007). Functional architecture of RNA polymerase I. Cell , 1260–1272. [DOI] [PubMed] [Google Scholar]
- Lafontaine DL, Tollervey D. (2000). Synthesis and assembly of the box C+D small nucleolar RNPs. Mol Cell Biol , 2650–2659. [DOI] [PMC free article] [PubMed] [Google Scholar]
- Li YY, Yeh E, Hays T, Bloom K. (1993). Disruption of mitotic spindle orientation in a yeast dynein mutant. Proc Natl Acad Sci USA , 10096–10100. [DOI] [PMC free article] [PubMed] [Google Scholar]
- Longtine MS, McKenzie A, 3rd, Demarini DJ, Shah NG, Wach A, Brachat A, Philippsen P, Pringle JR. (1998). Additional modules for versatile and economical PCR-based gene deletion and modification in Saccharomyces cerevisiae. Yeast , 953–961. [DOI] [PubMed] [Google Scholar]
- Machin F, Torres-Rosell J, De Piccoli G, Carballo JA, Cha RS, Jarmuz A, Aragon L. (2006). Transcription of ribosomal genes can cause nondisjunction. J Cell Biol , 893–903. [DOI] [PMC free article] [PubMed] [Google Scholar]
- Mais C, Wright JE, Prieto JL, Raggett SL, McStay B. (2005). UBF-binding site arrays form pseudo-NORs and sequester the RNA polymerase I transcription machinery. Genes Dev , 50–64. [DOI] [PMC free article] [PubMed] [Google Scholar]
- Mangan H, Gailin MO, McStay B. (2017). Integrating the genomic architecture of human nucleolar organizer regions with the biophysical properties of nucleoli. FEBS J , 3977–3985. [DOI] [PubMed] [Google Scholar]
- McStay B. (2016). Nucleolar organizer regions: genomic “dark matter” requiring illumination. Genes Dev , 1598–1610. [DOI] [PMC free article] [PubMed] [Google Scholar]
- Mekhail K, Seebacher J, Gygi SP, Moazed D. (2008). Role for perinuclear chromosome tethering in maintenance of genome stability. Nature , 667–670. [DOI] [PMC free article] [PubMed] [Google Scholar]
- Menendez-Benito V, van Deventer SJ, Jimenez-Garcia V, Roy-Luzarraga M, van Leeuwen F, Neefjes J. (2013). Spatiotemporal analysis of organelle and macromolecular complex inheritance. Proc Natl Acad Sci USA , 175–180. [DOI] [PMC free article] [PubMed] [Google Scholar]
- Merz K, Hondele M, Goetze H, Gmelch K, Stoeckl U, Griesenbeck J. (2008). Actively transcribed rRNA genes in S. cerevisiae are organized in a specialized chromatin associated with the high-mobility group protein Hmo1 and are largely devoid of histone molecules. Genes Dev , 1190–1204. [DOI] [PMC free article] [PubMed] [Google Scholar]
- Michaelis C, Ciosk R, Nasmyth K. (1997). Cohesins: chromosomal proteins that prevent premature separation of sister chromatids. Cell , 35–45. [DOI] [PubMed] [Google Scholar]
- Miller OL, Jr, Beatty BR. (1969). Visualization of nucleolar genes. Science , 955–957. [DOI] [PubMed] [Google Scholar]
- Mohanty BK, Bastia D. (2004). Binding of the replication terminator protein Fob1p to the Ter sites of yeast causes polar fork arrest. J Biol Chem , 1932–1941. [DOI] [PubMed] [Google Scholar]
- Moll T, Tebb G, Surana U, Robitsch H, Nasmyth K. (1991). The role of phosphorylation and the CDC28 protein kinase in cell cycle-regulated nuclear import of the S. cerevisiae transcription factor SWI5. Cell , 743–758. [DOI] [PubMed] [Google Scholar]
- Mostofa MG, Rahman MA, Koike N, Yeasmin AM, Islam N, Waliullah TM, Hosoyamada S, Shimobayashi M, Kobayashi T, Hall MN, Ushimaru T. (2018). CLIP and cohibin separate rDNA from nucleolar proteins destined for degradation by nucleophagy. J Cell Biol , 2675–2690. [DOI] [PMC free article] [PubMed] [Google Scholar]
- Neurohr G, Naegeli A, Titos I, Theler D, Greber B, Diez J, Gabaldon T, Mendoza M, Barral Y. (2011). A midzone-based ruler adjusts chromosome compaction to anaphase spindle length. Science , 465–468. [DOI] [PubMed] [Google Scholar]
- Neyer S, Kunz M, Geiss C, Hantsche M, Hodirnau VV, Seybert A, Engel C, Scheffer MP, Cramer P, Frangakis AS. (2016). Structure of RNA polymerase I transcribing ribosomal DNA genes. Nature , 607–610. [DOI] [PubMed] [Google Scholar]
- Nogi Y, Vu L, Nomura M. (1991). An approach for isolation of mutants defective in 35S ribosomal RNA synthesis in Saccharomyces cerevisiae. Proc Natl Acad Sci USA , 7026–7030. [DOI] [PMC free article] [PubMed] [Google Scholar]
- Nogi Y, Yano R, Dodd J, Carles C, Nomura M. (1993). Gene RRN4 in Saccharomyces cerevisiae encodes the A12.2 subunit of RNA polymerase I and is essential only at high temperatures. Mol Cell Biol , 114–122. [DOI] [PMC free article] [PubMed] [Google Scholar]
- Oakes ML, Johzuka K, Vu L, Eliason K, Nomura M. (2006). Expression of rRNA genes and nucleolus formation at ectopic chromosomal sites in the yeast Saccharomyces cerevisiae. Mol Cell Biol , 6223–6238. [DOI] [PMC free article] [PubMed] [Google Scholar]
- Peyroche G, Milkereit P, Bischler N, Tschochner H, Schultz P, Sentenac A, Carles C, Riva M. (2000). The recruitment of RNA polymerase I on rDNA is mediated by the interaction of the A43 subunit with Rrn3. EMBO J , 5473–5482. [DOI] [PMC free article] [PubMed] [Google Scholar]
- Renshaw MJ, Ward JJ, Kanemaki M, Natsume K, Nedelec FJ, Tanaka TU. (2010). Condensins promote chromosome recoiling during early anaphase to complete sister chromatid separation. Dev Cell , 232–244. [DOI] [PMC free article] [PubMed] [Google Scholar]
- Rowicka M, Kudlicki A, Tu BP, Otwinowski Z. (2007). High-resolution timing of cell cycle-regulated gene expression. Proc Natl Acad Sci USA , 16892–16897. [DOI] [PMC free article] [PubMed] [Google Scholar]
- Schneider CA, Rasband WS, Eliceiri KW. (2012). NIH Image to ImageJ: 25 years of image analysis. Nat Methods , 671–675. [DOI] [PMC free article] [PubMed] [Google Scholar]
- Schneider DA. (2012). RNA polymerase I activity is regulated at multiple steps in the transcription cycle: recent insights into factors that influence transcription elongation. Gene , 176–184. [DOI] [PMC free article] [PubMed] [Google Scholar]
- Schwab M, Lutum AS, Seufert W. (1997). Yeast Hct1 is a regulator of Clb2 cyclin proteolysis. Cell , 683–693. [DOI] [PubMed] [Google Scholar]
- Schwab M, Neutzner M, Mocker D, Seufert W. (2001). Yeast Hct1 recognizes the mitotic cyclin Clb2 and other substrates of the ubiquitin ligase APC. EMBO J , 5165–5175. [DOI] [PMC free article] [PubMed] [Google Scholar]
- Shaw SL, Maddox P, Skibbens RV, Yeh E, Salmon ED, Bloom K. (1998). Nuclear and spindle dynamics in budding yeast. Mol Biol Cell , 1627–1631. [DOI] [PMC free article] [PubMed] [Google Scholar]
- Sheff MA, Thorn KS. (2004). Optimized cassettes for fluorescent protein tagging in Saccharomyces cerevisiae. Yeast , 661–670. [DOI] [PubMed] [Google Scholar]
- Shin Y, Brangwynne CP. (2017). Liquid phase condensation in cell physiology and disease. Science , eaaf4382. [DOI] [PubMed] [Google Scholar]
- Shou W, Seol JH, Shevchenko A, Baskerville C, Moazed D, Chen ZW, Jang J, Shevchenko A, Charbonneau H, Deshaies RJ. (1999). Exit from mitosis is triggered by Tem1-dependent release of the protein phosphatase Cdc14 from nucleolar RENT complex. Cell , 233–244. [DOI] [PubMed] [Google Scholar]
- Sikorski RS, Hieter P. (1989). A system of shuttle vectors and yeast host strains designed for efficient manipulation of DNA in Saccharomyces cerevisiae. Genetics , 19–27. [DOI] [PMC free article] [PubMed] [Google Scholar]
- Sinclair DA, Guarente L. (1997). Extrachromosomal rDNA circles—a cause of aging in yeast. Cell , 1033–1042. [DOI] [PubMed] [Google Scholar]
- Sirri V, Urcuqui-Inchima S, Roussel P, Hernandez-Verdun D. (2008). Nucleolus: the fascinating nuclear body. Histochem Cell Biol , 13–31. [DOI] [PMC free article] [PubMed] [Google Scholar]
- Spellman PT, Sherlock G, Zhang MQ, Iyer VR, Anders K, Eisen MB, Brown PO, Botstein D, Futcher B. (1998). Comprehensive identification of cell cycle-regulated genes of the yeast Saccharomyces cerevisiae by microarray hybridization. Mol Biol Cell , 3273–3297. [DOI] [PMC free article] [PubMed] [Google Scholar]
- Straight AF, Marshall WF, Sedat JW, Murray AW. (1997). Mitosis in living budding yeast: anaphase A but no metaphase plate. Science , 574–578. [DOI] [PubMed] [Google Scholar]
- Sullivan M, Higuchi T, Katis VL, Uhlmann F. (2004). Cdc14 phosphatase induces rDNA condensation and resolves cohesin-independent cohesion during budding yeast anaphase. Cell , 471–482. [DOI] [PubMed] [Google Scholar]
- Taddei A, Schober H, Gasser SM. (2010). The budding yeast nucleus. Cold Spring Harb Perspect Biol , a000612. [DOI] [PMC free article] [PubMed] [Google Scholar]
- Tafur L, Sadian Y, Hoffmann NA, Jakobi AJ, Wetzel R, Hagen WJH, Sachse C, Muller CW. (2016). Molecular structures of transcribing RNA polymerase I. Mol Cell , 1135–1143. [DOI] [PMC free article] [PubMed] [Google Scholar]
- Titos I, Ivanova T, Mendoza M. (2014). Chromosome length and perinuclear attachment constrain resolution of DNA intertwines. J Cell Biol , 719–733. [DOI] [PMC free article] [PubMed] [Google Scholar]
- Tomson BN, D’Amours D, Adamson BS, Aragon L, Amon A. (2006). Ribosomal DNA transcription-dependent processes interfere with chromosome segregation. Mol Cell Biol , 6239–6247. [DOI] [PMC free article] [PubMed] [Google Scholar]
- Torres-Rosell J, Machin F, Jarmuz A, Aragon L. (2004). Nucleolar segregation lags behind the rest of the genome and requires Cdc14p activation by the FEAR network. Cell Cycle , 496–502. [PubMed] [Google Scholar]
- Tschochner H, Hurt E. (2003). Pre-ribosomes on the road from the nucleolus to the cytoplasm. Trends Cell Biol , 255–263. [DOI] [PubMed] [Google Scholar]
- Uhlmann F, Wernic D, Poupart MA, Koonin EV, Nasmyth K. (2000). Cleavage of cohesin by the CD clan protease separin triggers anaphase in yeast. Cell , 375–386. [DOI] [PubMed] [Google Scholar]
- Visintin R, Hwang ES, Amon A. (1999). Cfi1 prevents premature exit from mitosis by anchoring Cdc14 phosphatase in the nucleolus. Nature , 818–823. [DOI] [PubMed] [Google Scholar]
- Warner JR. (1999). The economics of ribosome biosynthesis in yeast. Trends Biochem Sci , 437–440. [DOI] [PubMed] [Google Scholar]
- Wittner M, Hamperl S, Stockl U, Seufert W, Tschochner H, Milkereit P, Griesenbeck J. (2011). Establishment and maintenance of alternative chromatin states at a multicopy gene locus. Cell , 543–554. [DOI] [PubMed] [Google Scholar]
- Woolford JL, Jr, Baserga SJ. (2013). Ribosome biogenesis in the yeast Saccharomyces cerevisiae. Genetics , 643–681. [DOI] [PMC free article] [PubMed] [Google Scholar]
- Yeh E, Skibbens RV, Cheng JW, Salmon ED, Bloom K. (1995). Spindle dynamics and cell cycle regulation of dynein in the budding yeast, Saccharomyces cerevisiae. J Cell Biol , 687–700. [DOI] [PMC free article] [PubMed] [Google Scholar]
Associated Data
This section collects any data citations, data availability statements, or supplementary materials included in this article.