

Abstract
Neuromuscular pathology is found in the larynx and pharynx in humans with Parkinson disease (PD); however, it is unknown when this pathology emerges. We hypothesized that pathology occurs in early (premanifest) stages. To address this, we used the Pink1−/− rat model of PD, which shows age-dependent dopaminergic neuron loss, locomotor deficits, and deficits related to laryngeal function. We report findings in the thyroarytenoid muscle (TA) in Pink1−/− rats compared with wild-type (WT) control rats at 4 and 6 mo of age. TAs were analyzed for force production, myosin heavy chain isoform (MyHC), centrally nucleated myofibers, neural cell adhesion molecule, myofiber size, and muscle section size. Compared with WT, Pink1−/− TA had reductions in force levels at 1-Hz stimulation and 20-Hz stimulation, increases in relative levels of MyHC 2L, increases in incidence of centrally nucleated myofibers in the external division of the TA, and reductions in myofiber size of the vocalis division of the TA at 6 mo of age. Alterations of laryngeal muscle biology occur in a rat model of premanifest PD. Although these alterations are statistically significant, their functional significance remains to be determined.
NEW & NOTEWORTHY Pathology of peripheral nerves and muscle has been reported in the larynx and pharynx of humans diagnosed with Parkinson disease (PD); however, it is unknown whether differences of laryngeal muscle occur at premanifest stages. This study examined the thyroarytenoid muscles of the Pink1−/− rat model of PD for differences of muscle biology compared with control rats. Thyroarytenoid muscles of Pink1−/− rats at premanifest stages show differences in multiple measures of muscle biology.
Keywords: muscle, Parkinson disease, Pink1, rat, thyroarytenoid
INTRODUCTION
Parkinson disease (PD) is a neurodegenerative disorder with an estimated prevalence of 572 per 100,000 individuals over the age of 45 (40). Primary disease pathology is characterized by a loss of nigrostriatal dopaminergic neurons and progressive sensorimotor deficits as well as Lewy bodies comprised of aggregated α-synuclein within the central nervous system (63). Vocal communication impairments associated with PD, which include dysarthria, dysphonia, and dysprosody, impact a majority of individuals with PD and are associated with reduced quality of life (22, 38, 60). These deficits may precede the development of gross limb motor signs and therefore show promise for early detection of the disease (43, 57). Findings from postmortem studies of patients suggest that PD involves peripheral neuromuscular pathologies in the pharynx and larynx; however, these studies focused on older patients in the later stages of PD (46–49). Furthermore, the pathologies related to communication dysfunction in PD are unclear. Investigating peripheral neuromuscular hallmarks of vocalization deficits at premanifest and early stages of PD can assist in determining biological causes of the vocalization deficits. This, in turn, may support future efforts toward refinement of clinical diagnosis and management of an important aspect of morbidity for this patient population.
Murine models have shown utility for basic mechanism research in PD and collectively offer opportunities for improved understanding of mechanisms of pathology (13, 18). The phosphatase and tensin homolog (PTEN)-induced putative kinase 1 (Pink1)-knockout (Pink1−/−) rat model of PD has been identified as showing particular promise for some aspects of preclinical PD research, with a temporal disease progression that has some similarities to that of humans (16, 18). Mutations of the Pink1 gene are associated with early-onset PD (67, 68), with clinical characteristics similar to idiopathic PD (2). In humans with PD, early preclinical pathology includes deficits in vocal communication and swallowing, followed by onset of more classical motor signs. Similarly, the Pink1−/− rat model demonstrates early (premanifest) and progressive deficits in ultrasonic vocalizations (USVs) and swallowing (17, 25), followed by limb motor impairments by a midstage time point (8 mo of age) and hallmark nigrostriatal dopamine loss (18). USV deficits in Pink1−/− include reduced intensity (loudness) at 2 mo of age, reduced bandwidth by 4 mo of age, and reduced peak frequency at 6 mo of age (25). These deficits affect the rats’ abilities to communicate with conspecifics (53). Thus the Pink1−/− model shows early vocal communication impairments broadly congruent with those clinically associated with the disease in humans (20, 25, 32, 57, 60) and is a valid platform to study peripheral muscle differences that may be associated with vocal deficits caused by PD.
As in humans, the larynx is the anatomical means through which rats generate vocalizations (30), and the characteristics of vocalizations are in part dependent on highly coordinated activity of laryngeal muscles to modulate egressive airflow (51, 55, 56, 66). The thyroarytenoid (TA) muscle is an intrinsic laryngeal muscle that comprises the vocal folds and as such is intimately associated with the production of vocalization (29). Prior work has reported a relationship between USV phenotypes in rats and neuromuscular characteristics of the TA muscle (29). Contraction of the TA shortens and adducts the vocal folds, thereby constituting a component of the physical mechanism by which egressive airflow is shaped into vocalizations. Rat laryngeal electromyographic recordings show that there is a linear relationship between TA electromyographic activity and USV call duration as well as fundamental frequency (55). The relationship between the TA muscle and USV performance identifies the TA as a candidate for investigations of peripheral neuromuscular differences that may underlie vocalization impairments of the Pink1−/− PD model.
Prior studies have suggested multiple avenues of interest for evaluation of the TA muscle in PD. Although weakness associated with PD has been reported in functional tasks involving both limb muscles (7, 44, 65) and respiratory muscles (4, 27), it is unknown whether the TA muscle demonstrates muscle force differences in PD. Pharyngeal muscles of humans with PD have been reported to show signs of neuromuscular pathology that include pathological muscle fiber type grouping, myosin heavy chain (MyHC) isoform transformations, myofiber expression of neural cell adhesion molecule (NCAM), myofibers with centralized nuclei (CN), and myofiber atrophy (48). In other biomedical contexts, myofibers have been shown to demonstrate NCAM expression and CN as a result of denervation (8, 9, 11, 15). Observations of these myofiber differences in some patients with PD have raised the speculation that PD may involve neuromuscular alterations arising at least in part from disruptions of peripheral innervation (47, 48). However, it is unknown whether any of these neuromuscular alterations occur in the TA in premanifest stages of PD. Therefore, these and other hallmarks of peripheral neuromuscular pathology are of interest for the quantitative evaluation of the TA for differences that may relate to altered function.
The present study tested the hypothesis that Pink1−/− rats show neuromuscular differences of the TA muscle (including alterations of MyHC isoform profiles, myofiber size, and NCAM expression) at premanifest time points (4 and 6 mo of age) compared with wild-type (WT) control rats. This was addressed through evaluation of TA contractile properties as well as biochemical and histological measures: MyHC profiles, incidence of CN, NCAM, myofiber size, and TA section size.
METHODS
Animals.
All procedures were reviewed and approved by the University of Wisconsin-Madison School of Medicine and Public Health Institutional Animal Care and Use Committee and were conducted in accordance with the Guide for the Care and Use of Laboratory Animals (8th edition) (14a) and with the AVMA Guidelines for the Euthanasia of Animals (2013 edition) (3). Male Long-Evans rats were housed in same-sex groups of two in standard polycarbonate cages with corn cob bedding on a reversed 12:12-h light-dark cycle. Standard rat chow and water were provided ad libitum. In total, 19 rats had a homozygous knockout of Pink1 (Pink1−/−) (SAGE Research Laboratories, Boyertown, PA) and 19 were WT. Rats were studied at either 4 mo (7 Pink1−/− and 8 WT) or 6 mo (12 Pink1−/− and 11 WT) of age. These time points are ages at which Pink1−/− has previously shown reduced USV bandwidth and reduced peak frequency, respectively (25). Sample sizes for some measures varied because of incidental sample loss or because of omission in cases of sporadic technical artifact.
Tissue isolation and experimental approach.
Animals and tissue samples were identified through alphanumeric codes to blind workers to genotype. Animals were weighed and euthanized with an overdose of Beuthanasia-D. The larynx was isolated and bisected along the longitudinal midline into right and left halves. One TA muscle from each rat was used for TA contractile experiments. The other TA muscle from each rat was left attached to the thyroid and arytenoid cartilages, embedded in optimal cutting temperature compound, and frozen through immersion in 2-methylbutane precooled in liquid nitrogen. As shown in Fig. 1, tissue sections were obtained for microscopy analysis to quantify characteristics of the external division of the TA (TA-X) and the vocalis division of the TA (TA-V), after which the remaining portion of the TA muscle was isolated from the optimal cutting temperature compound, microdissected from cartilage attachments, and homogenized for MyHC analysis by sodium dodecyl sulfate-polyacrylamide gel electrophoresis (SDS-PAGE).
Fig. 1.

Thyroarytenoid (TA) muscle processing. One TA muscle from each larynx was analyzed through ex vivo force measurements. The other TA muscle from each larynx was embedded in optimal cutting temperature compound (OCT) and sectioned for microscopic myofiber analyses including cross-sectional area (CSA), after which the remaining muscle was isolated from OCT and cartilage and was homogenized for myosin heavy chain isoform (MyHC) analysis. TA-V, vocalis division of the TA; TA-X, external division of the TA.
Thyroarytenoid muscle contractile properties.
The whole TA muscle was dissected intact from the origin to insertion, with small portions of thyroid and arytenoid cartilages left attached. After the muscle was extracted, an ex vivo approach was used to obtain recordings of muscle contractile properties. Briefly, muscles were placed in a tissue bath containing platinum field electrodes and filled with Tyrode solution (in mM: 121 NaCl, 5 KCl, 0.4 NaH2PO4, 1.8 CaCl2, 0.5 MgCl2, 24 NaHCO3, 5.5 glucose, 0.1 EGTA) bubbled continuously with 95% O2-5% CO2 (pH 7.4, 34°C). The TA muscle was attached to a force transducer (305C; Aurora Scientific) and stretched to a length eliciting maximal force from electrical stimulation (500–700 mA). The TA muscle was then stimulated at 1 Hz, and twitch kinetics were recorded (force, contraction time, decay time). After twitch stimulation, the TA was stimulated at different frequencies (20, 40, 60, 80, 100, 120, 140, 160, 180, and 200 Hz) with a 0.2-s pulse train, and forces were recorded.
After acquisition of contractile properties, the TA muscle was fatigue-tested by application of repeated stimulation with an 80-Hz train for a duration of 500 ms, delivered in 1-s intervals (duty cycle of 0.5 s) for 2 min. The fatigue envelope was curve fitted with a logistical (4 parameter) equation to generate maximum force (Fmax), minimum force (Fmin), half-fatigue time [time at (Fmax − Fmin)/2, T50], and fatigue slope (slope of the fatigue at T50). Fmax and Fmin were defined as the highest and lowest muscle forces, respectively, generated under the stimulation protocol. To determine the contribution of fatigable muscle force, we took the Fmax force values before T50 and then subtracted Fmin and integrated the area under the curve to represent a fatigue muscle force index (F AUCT50) (14).
Myosin heavy chain isoform analysis.
Muscle was homogenized to isolate total protein, including MyHC isoforms, as previously described (24, 34, 58). The protein concentration was determined with a standardized protein concentration assay (Bradford protein assay). Protein (400 ng) was then separated by molecular weight by SDS-PAGE. MyHC protein bands were visualized with a silver stain kit as previously described (33). MyHC isoform composition of each TA sample was digitally calculated with Un-Scan-It Gel Analysis software (Silk Scientific). This was performed through Segment Analysis, in which one segment box was drawn to encompass each of the five MyHC isoform bands for every sample lane. Pixel total percentages were generated through calculation of the relative percentage of each isoform segment box relative to all of the isoform segment boxes in the same sample lane. Background correction was accomplished by subtracting a single region background value. Each sample was independently analyzed twice, and the replicate analyses were averaged to generate each data point. Soleus and extensor digitorum longus were used as controls to verify relative migration positions of MyHC isoforms, as in prior studies (10, 36).
Tissue staining.
A CM1850 cryostat (Leica Biosystems, Buffalo Grove, IL) was used to cut 10-µm cross sections onto positively charged slides for immunostaining. The tissue sections were washed briefly in 0.1 M PBS (pH 7.4) and postfixed in cold 4% paraformaldehyde for 10 min, followed by four 5-min washes in 0.01 M PBS. The tissues were blocked for 1 h at room temperature with 1% BSA, 0.1% gelatin from cold-water fish skin (Sigma G7041), and 0.1% Triton X-100 in PBS. The primary antibodies, D18 (Developmental Studies Hybridoma Bank; 1:100) (19) and NCAM (Millipore AB5032; 1:250) (19, 42, 45), were applied and incubated overnight at 4°C. The next day, the slides were washed four times for 10 min with 0.01 M PBS, followed by the application of fluorescent secondary antibodies (goat anti-mouse IgG2a AlexaFluor 488, 1:800, ThermoFisher Scientific A21131; Cy3 goat anti-rabbit, 1:600, Jackson 111-165-144) for 1 h at room temperature. Four 10-min washes of PBS were followed by mounting with ProLong Gold antifade mounting medium with DAPI (Invitrogen P36931).
Image acquisition.
Image acquisition was performed with an Olympus BX53 Upright Microscope, a DP80 color/mono camera, the Prior XYZ Motorized Stage Kit, and cellSens Dimension software (Olympus). One TA cross section image from each animal was acquired in its entirety through automated image acquisition and stitching of multiple fields of view photographed with a 40× objective. Negative-staining controls (with primary antibodies omitted) and positive-staining controls (muscle from a rat model of amyotrophic lateral sclerosis, with all study antibodies applied), using a black background reduction, were used to determine optimal exposure settings. Exposure settings were kept constant for all slides photographed during each imaging session and were optimized at each imaging session with control slides and three randomly selected experimental slides.
Image analysis.
Images were manually analyzed in Adobe Photoshop CC, with the use of count analysis tools to count the number of myofibers containing CN and the number of NCAM-positive myofibers in the TA-V and the TA-X of each tissue section. Intraclass correlation coefficients were used to determine rater agreement for manual image analysis measures. Intraclass correlation coefficient values ranged from 0.77 to 0.90, indicating reasonable to high levels of rater agreement. TA photomicrographs were then manually cropped to isolate the muscle of interest (TA-X or TA-V) for myofiber size analysis with the MATLAB application SMASH (https://doi.org/10.6084/m9.figshare.1247634.v5) according to previously described methods (61). SMASH was used to analyze both myofiber cross-sectional area (CSA) and minimum Feret diameter. The minimum Feret diameter of a myofiber is a measure of myofiber size that may complement CSA measures because it is regarded as more impervious to error that may arise because of deviations in the angle of tissue sectioning (5, 61). Total TA muscle section area was determined with ImageJ.
Statistics.
Statistical analyses were conducted with SigmaPlot 12.5 (Systat Software, San Jose, CA), IBM SPSS Statistics 24 (IBM Analytics, Armonk, NY), and GraphPad Prism version 6.05–7.04 for Windows (GraphPad Software, La Jolla CA). All figures show nontransformed, raw data. A two-way analysis of variance with a Fisher’s least significant difference post hoc method was used to compare analyses between genotypes (WT and Pink1−/−) and ages (4 mo and 6 mo). Because of the exploratory nature of this work, no corrections were made for multiple comparisons. The level for significance was set, a priori, at P < 0.05. Effect sizes were evaluated through Cohen’s d.
RESULTS
Body weights.
As previously observed (18), Pink1−/− rats were heavier compared with WT control rats (Table 1) [F(1,34) = 66.99, P < 0.001]. Additionally, there was a significant main effect of age [F(1,34) = 4.287, P = 0.05], where all animals increased weight from 4 to 6 mo of age. There was no significant genotype × age interaction for body weight [F(1,34) = 2.824, P = 0.10].
Table 1.
Animal and muscle characteristics
| Body Weight, g | TA Weight,* mg | Force 1 Hz, mN | Force 20 Hz, mN | MyHC 2L, % | MyHC 2X, % | TA-X Centralized Nuclei, % | TA-V CSA,† µm2 | |
|---|---|---|---|---|---|---|---|---|
| WT 4 and 6 mo | 389.05 (34.22) | 11.79 (0.98) | 8.26 (2.54) | 8.68 (2.68) | 24.49 (6.17) | 20.68 (7.05) | 1.19 (0.58) | 676.15 (115.65) |
| Pink1−/− 4 and 6 mo | 484.42 (48.20) | 14.17 (1.76) | 6.15 (1.62) | 6.85 (2.05) | 31.00 (7.58) | 14.20% (±9.28) | 2.71 (1.12) | 498.68 (138.54) |
| Cohen’s d (genotype) | 2.28 | 1.67 | −0.99 | −0.77 | 0.95 | −0.79 | 1.70 | −1.39 |
Data are means (SD). CSA, cross-sectional area; MyHC, myosin heavy chain isoform; TA, thyroarytenoid; TA-V, TA muscle, vocalis division; TA-X, TA muscle, external division; WT, wild type.
TA weight includes the TA muscle, vocal fold mucosa, and cartilaginous attachments.
Values reflect 6-mo-old animals only.
Thyroarytenoid muscle contractile properties.
There was no significant main effect of genotype [F(1,32) = 2.18, P = 0.15] or age [F(1,32) = 0.005, P = 0.94] on contraction time and no significant main effect of genotype on half-relaxation time [F(1,32) = 0.005, P = 0.94]. There were no significant main effects for either genotype or age on force production at most frequencies. However, Pink1−/− TA muscles did have reduced force levels compared with WT at 1-Hz stimulation and 20-Hz stimulation, in that there was a significant main effect of genotype at 1 Hz [F(1,32) = 6.8, P = 0.01] and 20 Hz [F(1,32) = 5.14, P = 0.03] (Fig. 2). There were no significant main effects for age at these stimulation frequencies and no significant interactions between genotype and age.
Fig. 2.
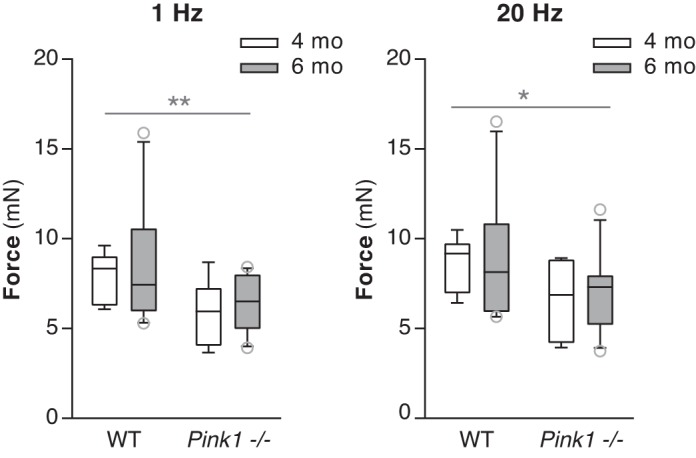
Force production at 1 Hz and 20 Hz. Force was significantly lower in Pink1−/− compared with wild-type (WT) thyroarytenoid muscles at 1 Hz and 20 Hz. Data are presented in box and whisker plots with the median and 10th, 25th, 75th, and 90th percentiles shown. WT 4 mo: n = 8 rats, Pink1−/− 4 mo: n = 7 rats, WT 6 mo: n = 10 rats, Pink1−/− 6 mo: n = 11 rats. *P < 0.05, **P < 0.01.
Fatigue envelope analysis.
Figure 3 illustrates fatigue envelopes for both genotypes at the two time points. There was no significant main effect of genotype [F(1,32) = 2.0, P = 0.167] or age [F(1,32) = 0.289, P = 0.595] on Fmax. There was also no significant main effect of genotype [F(1,32) = 2.8, P = 0.10] on the slope; however, there was a significant main effect of age [F(1,32) = 6.17, P = 0.02] on the slope of the curve. There was no significant main effect of genotype [F(1,32) = 2.02, P = 0.17] or age [F(1,32) = 1.62, P = 0.21] on T50. There were no effects of age on F AUCT50 [F(1,32) = 2.23, P = 0.15]. There was not a significant main effect of genotype on F AUCT50 [F(1,32) = 3.69, P = 0.059].
Fig. 3.

Fatigue envelope. Fatigue envelopes of Pink1−/− and wild-type (WT) thyroarytenoid muscles at the 4 and 6 mo time points. Forces are averages and SD. WT 4 mo: n = 8 rats, Pink1−/− 4 mo: n = 7 rats, WT 6 mo: n = 10 rats, Pink1−/− 6 mo: n = 11 rats.
Myosin heavy chain isoform profiles.
Significant main effects for genotype were found for both the MyHC 2L isoform [F(1,27) = 6.59, P = 0.02] and the MyHC 2X isoform [F(1,27) = 4.52, P = 0.04], in the absence of significant interactions with age (Fig. 4). Pink1−/− groups showed greater proportions of the 2L isoform in the TA relative to WT controls. Pink1−/− groups also showed reduced proportions of the 2X isoform relative to WT controls. There was not a significant effect for age for either 2L [F(1,27) = 0.21, P = 0.66] or 2X [F(1,27) = 0.04, P = 0.84].
Fig. 4.

Myosin heavy chain (MyHC) analysis of thyroarytenoid (TA) muscles. A: representative silver-stained SDS-PAGE gel lanes of MyHC isoform protein in the TA. The 2L isoform migrates between the position of the 2B and I isoforms. EDL, extensor digitorum longus. B: TA MyHC isoform profiles of 4-mo-old (top) and 6-mo-old (bottom) rats. Graphs indicate means and SD. Wild type (WT) 4 mo: n = 8 rats, Pink1−/− 4 mo: n = 7 rats, WT 6 mo: n = 8 rats, Pink1−/− 6 mo: n = 8 rats. *P < 0.05.
Central nucleation in thyroarytenoid myofibers.
Myofiber attributes were quantified in photomicrographs of the TA muscles (Fig. 5). Pink1−/− and WT groups showed differences in percentages of myofibers with CN in the TA-X but no significant differences in percentages of myofibers with CN in the TA-V (Fig. 6). In the TA-X, there was a significant main effect of genotype [F(1,31) = 22.75, P < 0.0001] in the absence of a main effect for age or significant interactions with age. Specifically, Pink1−/− rats had increased percentages of myofibers with CN compared with WT rats. However, the mean incidence of TA myofibers with CN was <3% in all groups, which is arguably still within a normal range for adult murine skeletal muscle (50).
Fig. 5.

Immunofluorescence staining of thyroarytenoid (TA) muscles of Pink1−/− and wild-type (WT) rats. A: TA muscle from a Pink1−/− rat. Arrowheads indicate a region of neural cell adhesion molecule (NCAM)-positive myofibers. B: TA muscle from an age-matched WT rat. TA-V, TA muscle, vocalis division; TA-X, TA muscle, external division; TC, thyroid cartilage. Scale bar, 200 μm.
Fig. 6.

Analysis of myofibers in the thyroarytenoid (TA) muscle. A, top: arrowheads indicate centralized nuclei. Scale bars, 50 μm. Bottom: % of myofibers with centralized nuclei in the TA external division and the TA vocalis division of 4- and 6-mo-old wild-type (WT) and Pink1−/− rats. B, top: arrowheads indicate myofibers positive for neural cell adhesion molecule (NCAM) staining. Scale bars, 50 μm. Bottom: % of myofibers staining positive for NCAM in the TA external division and TA vocalis division of 4- and 6-mo-old WT and Pink1−/− rats. C: cross-sectional area (CSA) of the TA external division and the TA vocalis division of 4- and 6-mo-old WT and Pink1−/− rats. D: minimum Feret diameter of the TA external division and the TA vocalis division of 4- and 6-mo-old WT and Pink1−/− rats. Data are presented as box and whisker plots with the median and 10th, 25th, 75th, and 90th percentiles shown. WT 4 mo: n = 8 rats, Pink1−/− 4 mo: n = 7 rats, WT 6 mo: n = 6–9 rats, Pink1−/− 6 mo: n = 8–11 rats. **P < 0.01, ***P < 0.001. n.s., No significant differences.
NCAM staining in thyroarytenoid muscle.
Quantitative analysis of NCAM staining in the TA indicated no significant main effects for either genotype or age. In the TA-X there was no significant interaction [F(1,25) = 0.0003, P = 0.99] between genotype and age for NCAM (Fig. 6), and there was not a significant main effect of genotype [F(1,25) = 0.30, P = 0.59] or age [F(1,25) = 0.22, P = 0.65]. Similarly, in the TA-V there was no significant interaction [F(1,25) = 0.27, P = 0.61] for NCAM (Fig. 6), and there was not a significant main effect of genotype [F(1,25) = 0.03, P = 0.89] or age [F(1,25) = 0.46, P = 0.50].
Size of thyroarytenoid myofibers.
In the TA-X, CSA analysis indicated no significant interactions between age and genotype [F(1,30) = 1.46, P = 0.24] (Fig. 6), and there was not a significant main effect of genotype [F(1,30) = 2.40, P = 0.13] or age [F(1,30) = 0.13, P = 0.72]. There was no significant interaction [F(1,30) = 1.22, P = 0.27] for minimum Feret diameter (Fig. 6), and there was not a significant main effect of genotype [F(1,30) = 1.83, P = 0.19] or age [F(1,30) = 0.13, P = 0.72].
However, the TA-V did show significant differences in myofiber size between groups. There was a significant interaction between age and genotype [F(1,27) = 7.36, P = 0.01] for CSA (Fig. 6). Specifically, WT animals had significant increases in myofiber CSA measurements from 4 to 6 mo of age (P = 0.004), whereas Pink1−/− animals did not exhibit significant changes over time (P = 0.52). Post hoc analyses showed no significant differences between genotypes at 4 mo of age (P = 0.47); however, at 6 mo of age WT animals had significantly increased CSA compared with Pink1−/− animals (P = 0.003). Similarly, for minimum Feret diameter measurements, there was a significant interaction [F(1,27) = 8.02, P = 0.009] between age and genotype (Fig. 6). WT animals had significantly increased minimum Feret diameter at 6 mo of age compared with 4 mo (P = 0.003). Pink1−/− animals did not have a significant change between ages (P = 0.55). There were no significant differences between genotypes at 4 mo (P = 0.38); however, at 6 mo of age WT rats had a significantly increased myofiber minimum Feret diameter compared with Pink1−/− rats (P = 0.003).
Size of thyroarytenoid muscle sections.
Because significant differences in TA-V myofiber size were detected between genotypes at 6 mo of age, a related but less specific measure indicative of muscle size was additionally employed to compare the divisions of the TA. After completion of myofiber size analysis, one TA muscle section per animal was analyzed for total muscle section area. The mean muscle section area of 6-mo-old WT TA-V (0.51 mm2) was slightly greater than the mean muscle section area of 6-mo-old Pink1−/− TA-V (0.43 mm2). However, for the TA-V there were no significant main effects for either age [F(1,29) = 0.29, P = 0.56] or genotype [F(1,29) = 0.49, P = 0.49]. Similarly, in TA-X there were no significant interactions between age and genotype and no significant main effects for either age [F(1,29) = 2.25, P = 0.14] or genotype [F(1,29) = 0.32, P = 0.58]. Across all four experimental groups, the average of TA-X mean area was 0.64 mm2 and the average of TA-V mean area was 0.46 mm2 (data not shown).
DISCUSSION
The present study tested the hypothesis that Pink1−/− rats show biological hallmarks of neuromuscular differences of the TA muscle at premanifest time points of the disease process (4 and 6 mo of age). Relative to WT controls, Pink1−/− TAs have reduced force levels at 1-Hz and 20-Hz stimulation, significant differences in MyHC profiles, and small but significant increases in the incidence of centrally nucleated myofibers in the external division of the TA. Pink1−/− also showed significant decreases in the size of myofibers in the TA-V at 6 mo of age. Previous work reported early and progressive differences in the USV performance of Pink1−/− rats at these ages (25), but biological characteristics of muscles involved in USV production were not evaluated in that work. Because the TA muscle is integral to the production of vocalizations, the findings of the present study help to describe peripheral characteristics of early-stage disease progression in the Pink1−/− model.
Although TA fatigue envelope force results showed no significant differences between genotypes, this avenue of investigation may offer further opportunities for future studies. Prior work reported early force potentiation in response to repeated stimuli in certain muscles of WT rats (71). Although force potentiation was not measured in the present study, it is included in F AUCT50 (14). In the present investigation, forces of WT TAs under fatigue testing show subtle increases at time points between 5 s and 20 s, whereas Pink1−/− TAs do not show these increases during the same time period (Fig. 3). Although the present study evaluated Pink1−/− at premanifest stages, the possibility that early force potentiation could be affected in Pink1−/− at advanced stages of the disease process may be a hypothesis to be considered in future work. The PINK1 protein may play a role in calcium homeostasis (26, 31, 62), and perturbations of calcium homeostasis have been shown in in Parkinson models (12). Differences of calcium fluxes are among the variety of biological circumstances that can affect force potentiation (72), and it has been suggested that altered calcium homeostasis may play a role in altered force potentiation observed in models of muscular dystrophy (23, 70). Alterations in calcium dynamics may also impact muscle fatigue. In light of the fact that disease phenotypes are anticipated to become increasingly more severe with age in Pink1−/− rats, these considerations collectively suggest opportunities for future studies to investigate the role of calcium in early force potentiation in Pink1−/− TA muscles at later stages of the disease process.
We observed a preponderance of the 2X, 2B, and 2L MyHC isoforms in the TA muscles of all groups in this study and minimal levels of 2A and I isoforms. These data are broadly congruent with prior reports of TA isoform profiles as assessed by qRT-PCR (69), SDS-PAGE (33, 59), and immunostaining (37, 54). MyHC analysis showed relative reductions of the 2X isoform in the Pink1−/− groups and relative increases in the 2L isoform in the Pink1−/− groups. Interestingly, prior anatomical studies of MyHC distribution in the TA of WT rats have indicated anatomical localization of the MyHC 2X isoform primarily to the TA-V, whereas the TA-X is comprised primarily of myofibers expressing the MyHC 2B and 2L isoforms (37, 54). Although the present study found MyHC differences between Pink1−/− and WT rats in the TA, the anatomical localization of these differences specifically to either one or both divisions of the TA is unknown, since the TA-V and TA-X from each animal were homogenized together for MyHC analysis. Evaluation of MyHC differences of the TA-X and TA-V separately in this model system may be of interest for future work. Significant reductions in measures of myofiber size of the TA-V, but not of the TA-X, in Pink1−/− rats at 6 mo of age compared with WT control rats suggest the possibility that the TA-V and the TA-X may each be affected differently in Pink1−/− rats.
A prevalence of myofibers with CN may indicate the presence of myofiber repair processes (21) and has been noted in a prior study of laryngeal hemiplegia secondary to recurrent laryngeal neuropathy (1). Although there are statistically significant increases of CN in Pink1−/− TA at both age points, we do not believe this is a biologically significant sign of myofiber repair, as this was only 2–4%. An incidence of <3% of centrally nucleated myofibers may be considered to be within a normal range, whereas >25% of CN is clearly indicative of muscle pathology (21, 52). However, given that the ages studied here correspond to premanifest PD and CN incidence is used as an indicator of the therapeutic potential of pharmacological modulators in murine models of muscular disorders (39, 64), the incidence of myofibers with CN should be examined in later stages of disease progression.
The incidence of myofibers positive for NCAM in Pink1−/− TA was not significantly different from that in WT TA. Whereas prior work has reported NCAM-positive myofibers in muscle of patients with PD, our analysis of Pink1−/− TA muscle suggested sporadic presence of NCAM-positive myofibers at both 4 and 6 mo of age of both genotypes studied, with no significant differences between groups. Although NCAM expression in myofibers can be associated with muscle pathology (15), NCAM also plays roles in normal muscle development and aging processes (11) and has been reported to be expressed by relatively high percentages of myofibers under normal conditions in some specialized cranial muscles (41). These considerations may explain the sporadic presence of NCAM-positive fibers in the TA of all experimental groups as seen in the present study. Prior reports of pathological NCAM expression in myofibers associated with PD have been at later stages of the disease process (48), raising an additional possibility that muscle NCAM expression in myofibers occurs at more advanced stages of PD that were not assessed in the present study.
The Pink1−/− model offers opportunities for the study of peripheral neuromuscular differences that occur in this disease at premanifest and early time points that are exceptionally challenging to evaluate similarly in clinical studies. The present findings in multiple measures of muscle biology suggest relatively minor differences between genotypes, which are presently of unknown functional significance. Although PD is a neurodegenerative disorder of the central nervous system, understanding of the pathophysiology is expanding to include the peripheral nervous system (28, 35), with potentially secondary impacts on muscles (48). Therefore, evaluation of laryngeal muscles at later stages of this model system of PD may assist characterization of peripheral differences that emerge through the course of the disease process. Expansion of basic knowledge of muscle outcomes across stages of PD may assist efforts to clarify peripheral hallmarks of vocalization compromise in PD and may also guide future work characterizing peripheral disease progression and outcomes following experimental therapeutic interventions using this rat model.
GRANTS
This work was supported through National Institute of Deafness and Other Communications Disorders Grants R01 DC-014358 (M. R. Ciucci), R21 DC-016135 (C. A. Kelm-Nelson), and F32 DC-014399 (C. A. Kelm-Nelson).
DISCLOSURES
No conflicts of interest, financial or otherwise, are declared by the authors.
AUTHOR CONTRIBUTIONS
N.P.C. and M.R.C. conceived and designed research; T.J.G., J.A.R., J.C.S., and J.M.L. performed experiments; T.J.G., C.A.K.-N., and J.A.R. analyzed data; T.J.G., C.A.K.-N., and J.A.R. interpreted results of experiments; T.J.G., C.A.K.-N., and J.A.R. prepared figures; T.J.G., J.A.R., and J.M.L. drafted manuscript; T.J.G., C.A.K.-N., J.A.R., J.C.S., J.M.L., N.P.C., and M.R.C. edited and revised manuscript; T.J.G., C.A.K.-N., J.A.R., J.C.S., J.M.L., N.P.C., and M.R.C. approved final version of manuscript.
ENDNOTE
At the request of the authors, readers are herein alerted to the fact that additional materials related to this manuscript may be found at https://doi.org/10.6084/m9.figshare.1247634.v5. These materials are not a part of this manuscript, and have not undergone peer review by the American Physiological Society (APS). APS and the journal editors take no responsibility for these materials, for the website address, or for any links to or from it.
ACKNOWLEDGMENTS
We appreciate Dr. Masatoshi Suzuki’s contribution of muscle tissue from a rat amyotrophic lateral sclerosis model, which was used in this study as a biological positive control for NCAM staining. The D18 antibody developed by J. R. Sanes was obtained from the Developmental Studies Hybridoma Bank, created by the National Institute of Child Health and Human Development and maintained at The University of Iowa, Department of Biology, Iowa City, IA.
REFERENCES
- 1.Adreani CM, Li ZB, Lehar M, Southwood LL, Habecker PL, Flint PW, Parente EJ. Myosin heavy chain composition in normal and atrophic equine laryngeal muscle. Vet Pathol 43: 881–889, 2006. doi: 10.1354/vp.43-6-881. [DOI] [PubMed] [Google Scholar]
- 2.Albanese A, Valente EM, Romito LM, Bellacchio E, Elia AE, Dallapiccola B. The PINK1 phenotype can be indistinguishable from idiopathic Parkinson disease. Neurology 64: 1958–1960, 2005. doi: 10.1212/01.WNL.0000163999.72864.FD. [DOI] [PubMed] [Google Scholar]
- 3.AVMA Panel on Euthanasia. AVMA Guidelines for the Euthanasia of Animals (2013 ed.). Schaumburg, IL: American Veterinary Medical Association, 2013. [Google Scholar]
- 4.Baille G, Perez T, Devos D, Deken V, Defebvre L, Moreau C. Early occurrence of inspiratory muscle weakness in Parkinson’s disease. PLoS One 13: e0190400, 2018. doi: 10.1371/journal.pone.0190400. [DOI] [PMC free article] [PubMed] [Google Scholar]
- 5.Briguet A, Courdier-Fruh I, Foster M, Meier T, Magyar JP. Histological parameters for the quantitative assessment of muscular dystrophy in the mdx-mouse. Neuromuscul Disord 14: 675–682, 2004. doi: 10.1016/j.nmd.2004.06.008. [DOI] [PubMed] [Google Scholar]
- 7.Cano-de-la-Cuerda R, Pérez-de-Heredia M, Miangolarra-Page JC, Muñoz-Hellín E, Fernández-de-Las-Peñas C. Is there muscular weakness in Parkinson’s disease? Am J Phys Med Rehabil 89: 70–76, 2010. doi: 10.1097/PHM.0b013e3181a9ed9b. [DOI] [PubMed] [Google Scholar]
- 8.Carlson BM. The regeneration of skeletal muscle. A review. Am J Anat 137: 119–149, 1973. doi: 10.1002/aja.1001370202. [DOI] [PubMed] [Google Scholar]
- 9.Carraro U, Kern H. Severely atrophic human muscle fibers with nuclear misplacement survive many years of permanent denervation. Eur J Transl Myol 26: 5894, 2016. doi: 10.4081/ejtm.2016.5894. [DOI] [PMC free article] [PubMed] [Google Scholar]
- 10.Cartee GD, Arias EB, Yu CS, Pataky MW. Novel single skeletal muscle fiber analysis reveals a fiber type-selective effect of acute exercise on glucose uptake. Am J Physiol Endocrinol Metab 311: E818–E824, 2016. doi: 10.1152/ajpendo.00289.2016. [DOI] [PMC free article] [PubMed] [Google Scholar]
- 11.Cashman NR, Covault J, Wollman RL, Sanes JR. Neural cell adhesion molecule in normal, denervated, and myopathic human muscle. Ann Neurol 21: 481–489, 1987. doi: 10.1002/ana.410210512. [DOI] [PubMed] [Google Scholar]
- 12.Celardo I, Martins LM, Gandhi S. Unravelling mitochondrial pathways to Parkinson’s disease. Br J Pharmacol 171: 1943–1957, 2014. doi: 10.1111/bph.12433. [DOI] [PMC free article] [PubMed] [Google Scholar]
- 13.Cenci MA, Whishaw IQ, Schallert T. Animal models of neurological deficits: how relevant is the rat? Nat Rev Neurosci 3: 574–579, 2002. doi: 10.1038/nrn877. [DOI] [PubMed] [Google Scholar]
- 14.Chiu CS, Weber H, Adamski S, Rauch A, Gentile MA, Alves SE, Kath G, Flores O, Wilkinson HA. Non-invasive muscle contraction assay to study rodent models of sarcopenia. BMC Musculoskelet Disord 12: 246, 2011. doi: 10.1186/1471-2474-12-246. [DOI] [PMC free article] [PubMed] [Google Scholar]
- 14a.Committee for the Update of the Guide for Care and Use of Laboratory Animals, Institute for Laboratory Animal Research of the National Research Council. Guide for the Care and Use of Laboratory Animals (8th ed.) Washington, DC: National Academies Press, 2011. [Google Scholar]
- 15.Covault J, Sanes JR. Neural cell adhesion molecule (N-CAM) accumulates in denervated and paralyzed skeletal muscles. Proc Natl Acad Sci USA 82: 4544–4548, 1985. doi: 10.1073/pnas.82.13.4544. [DOI] [PMC free article] [PubMed] [Google Scholar]
- 16.Creed RB, Goldberg MS. New developments in genetic rat models of Parkinson’s disease. Mov Disord 33: 717–729, 2018. doi: 10.1002/mds.27296. [DOI] [PMC free article] [PubMed] [Google Scholar]
- 17.Cullen KP, Grant LM, Kelm-Nelson CA, Brauer AFL, Bickelhaupt LB, Russell JA, Ciucci MR. Pink1−/− rats show early-onset swallowing deficits and correlative brainstem pathology. Dysphagia 33: 749–758, 2018. doi: 10.1007/s00455-018-9896-5. [DOI] [PMC free article] [PubMed] [Google Scholar]
- 18.Dave KD, De Silva S, Sheth NP, Ramboz S, Beck MJ, Quang C, Switzer RC 3rd, Ahmad SO, Sunkin SM, Walker D, Cui X, Fisher DA, McCoy AM, Gamber K, Ding X, Goldberg MS, Benkovic SA, Haupt M, Baptista MA, Fiske BK, Sherer TB, Frasier MA. Phenotypic characterization of recessive gene knockout rat models of Parkinson’s disease. Neurobiol Dis 70: 190–203, 2014. doi: 10.1016/j.nbd.2014.06.009. [DOI] [PubMed] [Google Scholar]
- 19.Dedkov EI, Kostrominova TY, Borisov AB, Carlson BM. MyoD and myogenin protein expression in skeletal muscles of senile rats. Cell Tissue Res 311: 401–416, 2003. [DOI] [PubMed] [Google Scholar]
- 20.Defazio G, Guerrieri M, Liuzzi D, Gigante AF, di Nicola V. Assessment of voice and speech symptoms in early Parkinson’s disease by the Robertson dysarthria profile. Neurol Sci 37: 443–449, 2016. doi: 10.1007/s10072-015-2422-8. [DOI] [PubMed] [Google Scholar]
- 21.Folker ES, Baylies MK. Nuclear positioning in muscle development and disease. Front Physiol 4: 363, 2013. doi: 10.3389/fphys.2013.00363. [DOI] [PMC free article] [PubMed] [Google Scholar]
- 22.Gibbins N, Awad R, Harris S, Aymat A. The diagnosis, clinical findings and treatment options for Parkinson’s disease patients attending a tertiary referral voice clinic. J Laryngol Otol 131: 357–362, 2017. doi: 10.1017/S0022215117000159. [DOI] [PubMed] [Google Scholar]
- 23.Gillis JM. Understanding dystrophinopathies: an inventory of the structural and functional consequences of the absence of dystrophin in muscles of the mdx mouse. J Muscle Res Cell Motil 20: 605–625, 1999. doi: 10.1023/A:1005545325254. [DOI] [PubMed] [Google Scholar]
- 24.Glass TJ, Connor NP. Digastric muscle phenotypes of the Ts65Dn mouse model of Down syndrome. PLoS One 11: e0158008, 2016. doi: 10.1371/journal.pone.0158008. [DOI] [PMC free article] [PubMed] [Google Scholar]
- 25.Grant LM, Kelm-Nelson CA, Hilby BL, Blue KV, Paul Rajamanickam ES, Pultorak JD, Fleming SM, Ciucci MR. Evidence for early and progressive ultrasonic vocalization and oromotor deficits in a PINK1 gene knockout rat model of Parkinson’s disease. J Neurosci Res 93: 1713–1727, 2015. doi: 10.1002/jnr.23625. [DOI] [PMC free article] [PubMed] [Google Scholar]
- 26.Gómez-Sánchez R, Gegg ME, Bravo-San Pedro JM, Niso-Santano M, Alvarez-Erviti L, Pizarro-Estrella E, Gutiérrez-Martín Y, Alvarez-Barrientos A, Fuentes JM, González-Polo RA, Schapira AH. Mitochondrial impairment increases FL-PINK1 levels by calcium-dependent gene expression. Neurobiol Dis 62: 426–440, 2014. doi: 10.1016/j.nbd.2013.10.021. [DOI] [PMC free article] [PubMed] [Google Scholar]
- 27.Haas BM, Trew M, Castle PC. Effects of respiratory muscle weakness on daily living function, quality of life, activity levels, and exercise capacity in mild to moderate Parkinson’s disease. Am J Phys Med Rehabil 83: 601–607, 2004. doi: 10.1097/01.PHM.0000133436.61009.02. [DOI] [PubMed] [Google Scholar]
- 28.Jellinger KA. Neuropathology of sporadic Parkinson’s disease: evaluation and changes of concepts. Mov Disord 27: 8–30, 2012. doi: 10.1002/mds.23795. [DOI] [PubMed] [Google Scholar]
- 29.Johnson AM, Ciucci MR, Connor NP. Vocal training mitigates age-related changes within the vocal mechanism in old rats. J Gerontol A Biol Sci Med Sci 68: 1458–1468, 2013. doi: 10.1093/gerona/glt044. [DOI] [PMC free article] [PubMed] [Google Scholar]
- 30.Johnson AM, Ciucci MR, Russell JA, Hammer MJ, Connor NP. Ultrasonic output from the excised rat larynx. J Acoust Soc Am 128: EL75–EL79, 2010. doi: 10.1121/1.3462234. [DOI] [PMC free article] [PubMed] [Google Scholar]
- 31.Kazlauskaite A, Muqit MM. PINK1 and Parkin—mitochondrial interplay between phosphorylation and ubiquitylation in Parkinson’s disease. FEBS J 282: 215–223, 2015. doi: 10.1111/febs.13127. [DOI] [PMC free article] [PubMed] [Google Scholar]
- 32.Kelm-Nelson CA, Yang KM, Ciucci MR. Exercise effects on early vocal ultrasonic communication dysfunction in a PINK1 knockout model of Parkinson’s disease. J Parkinsons Dis 5: 749–763, 2015. doi: 10.3233/JPD-150688. [DOI] [PMC free article] [PubMed] [Google Scholar]
- 33.Kletzien H, Russell JA, Connor NP. The effects of treadmill running on aging laryngeal muscle structure. Laryngoscope 126: 672–677, 2016. doi: 10.1002/lary.25520. [DOI] [PMC free article] [PubMed] [Google Scholar]
- 34.Kletzien H, Russell JA, Leverson GE, Connor NP. Differential effects of targeted tongue exercise and treadmill running on aging tongue muscle structure and contractile properties. J Appl Physiol (1985) 114: 472–481, 2013. doi: 10.1152/japplphysiol.01370.2012. [DOI] [PMC free article] [PubMed] [Google Scholar]
- 35.Klingelhoefer L, Reichmann H. Parkinson’s disease as a multisystem disorder. J Neural Transm (Vienna) 124: 709–713, 2017. doi: 10.1007/s00702-017-1692-0. [DOI] [PubMed] [Google Scholar]
- 36.LaFramboise WA, Watchko JF, Brozanski BS, Daood MJ, Guthrie RD. Myosin heavy chain expression in respiratory muscles of the rat. Am J Respir Cell Mol Biol 6: 335–339, 1992. doi: 10.1165/ajrcmb/6.3.335. [DOI] [PubMed] [Google Scholar]
- 37.Lenell C, Johnson AM. Sexual dimorphism in laryngeal muscle fibers and ultrasonic vocalizations in the adult rat. Laryngoscope 127: E270–E276, 2017. doi: 10.1002/lary.26561. [DOI] [PMC free article] [PubMed] [Google Scholar]
- 38.Lirani-Silva C, Mourão LF, Gobbi LT. Dysarthria and quality of life in neurologically healthy elderly and patients with Parkinson’s disease. CoDAS 27: 248–254, 2015. doi: 10.1590/2317-1782/20152014083. [DOI] [PubMed] [Google Scholar]
- 39.Ljubicic V, Burt M, Jasmin BJ. The therapeutic potential of skeletal muscle plasticity in Duchenne muscular dystrophy: phenotypic modifiers as pharmacologic targets. FASEB J 28: 548–568, 2014. doi: 10.1096/fj.13-238071. [DOI] [PubMed] [Google Scholar]
- 40.Marras C, Beck JC, Bower JH, Roberts E, Ritz B, Ross GW, Abbott RD, Savica R, Van Den Eeden SK, Willis AW, Tanner CM; Parkinson’s Foundation P4 Group . Prevalence of Parkinson’s disease across North America. NPJ Parkinsons Dis 4: 21, 2018. doi: 10.1038/s41531-018-0058-0. [DOI] [PMC free article] [PubMed] [Google Scholar]
- 41.McLoon LK, Wirtschafter JD. N-CAM is expressed in mature extraocular muscles in a pattern conserved among three species. Invest Ophthalmol Vis Sci 37: 318–327, 1996. [PubMed] [Google Scholar]
- 42.Mikaelian I, Nanney LB, Parman KS, Kusewitt DF, Ward JM, Näf D, Krupke DM, Eppig JT, Bult CJ, Seymour R, Ichiki T, Sundberg JP. Antibodies that label paraffin-embedded mouse tissues: a collaborative endeavor. Toxicol Pathol 32: 181–191, 2004. doi: 10.1080/01926230490274335. [DOI] [PubMed] [Google Scholar]
- 43.Moreau C, Devos D, Baille G, Delval A, Tard C, Perez T, Danel-Buhl N, Seguy D, Labreuche J, Duhamel A, Delliaux M, Dujardin K, Defebvre L. Are upper-body axial symptoms a feature of early Parkinson’s disease? PLoS One 11: e0162904, 2016. doi: 10.1371/journal.pone.0162904. [DOI] [PMC free article] [PubMed] [Google Scholar]
- 44.Moreno Catalá M, Woitalla D, Arampatzis A. Central factors explain muscle weakness in young fallers with Parkinson’s disease. Neurorehabil Neural Repair 27: 753–759, 2013. doi: 10.1177/1545968313491011. [DOI] [PubMed] [Google Scholar]
- 45.Mosole S, Carraro U, Kern H, Loefler S, Fruhmann H, Vogelauer M, Burggraf S, Mayr W, Krenn M, Paternostro-Sluga T, Hamar D, Cvecka J, Sedliak M, Tirpakova V, Sarabon N, Musarò A, Sandri M, Protasi F, Nori A, Pond A, Zampieri S. Long-term high-level exercise promotes muscle reinnervation with age. J Neuropathol Exp Neurol 73: 284–294, 2014. doi: 10.1097/NEN.0000000000000032. [DOI] [PubMed] [Google Scholar]
- 46.Mu L, Chen J, Sobotka S, Nyirenda T, Benson B, Gupta F, Sanders I, Adler CH, Caviness JN, Shill HA, Sabbagh M, Samanta JE, Sue LI, Beach TG; Arizona Parkinson’s Disease Consortium . Alpha-synuclein pathology in sensory nerve terminals of the upper aerodigestive tract of Parkinson’s disease patients. Dysphagia 30: 404–417, 2015. doi: 10.1007/s00455-015-9612-7. [DOI] [PMC free article] [PubMed] [Google Scholar]
- 47.Mu L, Sobotka S, Chen J, Su H, Sanders I, Adler CH, Shill HA, Caviness JN, Samanta JE, Beach TG; Arizona Parkinson’s Disease Consortium . Alpha-synuclein pathology and axonal degeneration of the peripheral motor nerves innervating pharyngeal muscles in Parkinson disease. J Neuropathol Exp Neurol 72: 119–129, 2013. doi: 10.1097/NEN.0b013e3182801cde. [DOI] [PMC free article] [PubMed] [Google Scholar]
- 48.Mu L, Sobotka S, Chen J, Su H, Sanders I, Adler CH, Shill HA, Caviness JN, Samanta JE, Beach TG; Arizona Parkinson’s Disease Consortium . Altered pharyngeal muscles in Parkinson disease. J Neuropathol Exp Neurol 71: 520–530, 2012. doi: 10.1097/NEN.0b013e318258381b. [DOI] [PMC free article] [PubMed] [Google Scholar]
- 49.Mu L, Sobotka S, Chen J, Su H, Sanders I, Nyirenda T, Adler CH, Shill HA, Caviness JN, Samanta JE, Sue LI, Beach TG; Arizona Parkinson’s Disease Consortium . Parkinson disease affects peripheral sensory nerves in the pharynx. J Neuropathol Exp Neurol 72: 614–623, 2013. doi: 10.1097/NEN.0b013e3182965886. [DOI] [PMC free article] [PubMed] [Google Scholar]
- 50.Nguyen HH, Jayasinha V, Xia B, Hoyte K, Martin PT. Overexpression of the cytotoxic T cell GalNAc transferase in skeletal muscle inhibits muscular dystrophy in mdx mice. Proc Natl Acad Sci USA 99: 5616–5621, 2002. doi: 10.1073/pnas.082613599. [DOI] [PMC free article] [PubMed] [Google Scholar]
- 51.Nunez AA, Pomerantz SM, Bean NJ, Youngstrom TG. Effects of laryngeal denervation on ultrasound production and male sexual behavior in rodents. Physiol Behav 34: 901–905, 1985. doi: 10.1016/0031-9384(85)90011-3. [DOI] [PubMed] [Google Scholar]
- 52.Pierson CR, Tomczak K, Agrawal P, Moghadaszadeh B, Beggs AH. X-linked myotubular and centronuclear myopathies. J Neuropathol Exp Neurol 64: 555–564, 2005. doi: 10.1097/01.jnen.0000171653.17213.2e. [DOI] [PubMed] [Google Scholar]
- 53.Pultorak JD, Kelm-Nelson CA, Holt LR, Blue KV, Ciucci MR, Johnson AM. Decreased approach behavior and nucleus accumbens immediate early gene expression in response to Parkinsonian ultrasonic vocalizations in rats. Soc Neurosci 11: 365–379, 2016. doi: 10.1080/17470919.2015.1086434. [DOI] [PMC free article] [PubMed] [Google Scholar]
- 54.Rhee HS, Lucas CA, Hoh JF. Fiber types in rat laryngeal muscles and their transformations after denervation and reinnervation. J Histochem Cytochem 52: 581–590, 2004. doi: 10.1177/002215540405200503. [DOI] [PubMed] [Google Scholar]
- 55.Riede T. Stereotypic laryngeal and respiratory motor patterns generate different call types in rat ultrasound vocalization. J Exp Zool A Ecol Genet Physiol 319: 213–224, 2013. doi: 10.1002/jez.1785. [DOI] [PMC free article] [PubMed] [Google Scholar]
- 56.Roberts LH. The rodent ultrasound production mechanism. Ultrasonics 13: 83–88, 1975. doi: 10.1016/0041-624X(75)90052-9. [DOI] [PubMed] [Google Scholar]
- 57.Rusz J, Cmejla R, Ruzickova H, Ruzicka E. Quantitative acoustic measurements for characterization of speech and voice disorders in early untreated Parkinson’s disease. J Acoust Soc Am 129: 350–367, 2011. doi: 10.1121/1.3514381. [DOI] [PubMed] [Google Scholar]
- 58.Schaser AJ, Wang H, Volz LM, Connor NP. Biochemistry of the anterior, medial, and posterior genioglossus in the aged rat. Dysphagia 26: 256–263, 2011. doi: 10.1007/s00455-010-9297-x. [DOI] [PMC free article] [PubMed] [Google Scholar]
- 59.Shiotani A, Jones RM, Flint PW. Postnatal development of myosin heavy chain isoforms in rat laryngeal muscles. Ann Otol Rhinol Laryngol 108: 509–515, 1999. doi: 10.1177/000348949910800517. [DOI] [PubMed] [Google Scholar]
- 60.Skodda S, Rinsche H, Schlegel U. Progression of dysprosody in Parkinson’s disease over time–a longitudinal study. Mov Disord 24: 716–722, 2009. doi: 10.1002/mds.22430. [DOI] [PubMed] [Google Scholar]
- 61.Smith LR, Barton ER. SMASH—semi-automatic muscle analysis using segmentation of histology: a MATLAB application. Skelet Muscle 4: 21, 2014. doi: 10.1186/2044-5040-4-21. [DOI] [PMC free article] [PubMed] [Google Scholar]
- 62.Soman S, Keatinge M, Moein M, Da Costa M, Mortiboys H, Skupin A, Sugunan S, Bazala M, Kuznicki J, Bandmann O. Inhibition of the mitochondrial calcium uniporter rescues dopaminergic neurons in pink1−/− zebrafish. Eur J Neurosci 45: 528–535, 2017. doi: 10.1111/ejn.13473. [DOI] [PMC free article] [PubMed] [Google Scholar]
- 63.Spillantini MG, Crowther RA, Jakes R, Hasegawa M, Goedert M. alpha-Synuclein in filamentous inclusions of Lewy bodies from Parkinson’s disease and dementia with Lewy bodies. Proc Natl Acad Sci USA 95: 6469–6473, 1998. doi: 10.1073/pnas.95.11.6469. [DOI] [PMC free article] [PubMed] [Google Scholar]
- 64.Spurney CF, Gordish-Dressman H, Guerron AD, Sali A, Pandey GS, Rawat R, Van Der Meulen JH, Cha HJ, Pistilli EE, Partridge TA, Hoffman EP, Nagaraju K. Preclinical drug trials in the mdx mouse: assessment of reliable and sensitive outcome measures. Muscle Nerve 39: 591–602, 2009. doi: 10.1002/mus.21211. [DOI] [PMC free article] [PubMed] [Google Scholar]
- 65.Stevens-Lapsley J, Kluger BM, Schenkman M. Quadriceps muscle weakness, activation deficits, and fatigue with Parkinson disease. Neurorehabil Neural Repair 26: 533–541, 2012. doi: 10.1177/1545968311425925. [DOI] [PMC free article] [PubMed] [Google Scholar]
- 66.Thomas LB, Stemple JC, Andreatta RD, Andrade FH. Establishing a new animal model for the study of laryngeal biology and disease: an anatomic study of the mouse larynx. J Speech Lang Hear Res 52: 802–811, 2009. doi: 10.1044/1092-4388(2008/08-0087). [DOI] [PubMed] [Google Scholar]
- 67.Valente EM, Abou-Sleiman PM, Caputo V, Muqit MM, Harvey K, Gispert S, Ali Z, Del Turco D, Bentivoglio AR, Healy DG, Albanese A, Nussbaum R, González-Maldonado R, Deller T, Salvi S, Cortelli P, Gilks WP, Latchman DS, Harvey RJ, Dallapiccola B, Auburger G, Wood NW. Hereditary early-onset Parkinson’s disease caused by mutations in PINK1. Science 304: 1158–1160, 2004. doi: 10.1126/science.1096284. [DOI] [PubMed] [Google Scholar]
- 68.Valente EM, Salvi S, Ialongo T, Marongiu R, Elia AE, Caputo V, Romito L, Albanese A, Dallapiccola B, Bentivoglio AR. PINK1 mutations are associated with sporadic early-onset parkinsonism. Ann Neurol 56: 336–341, 2004. doi: 10.1002/ana.20256. [DOI] [PubMed] [Google Scholar]
- 69.Van Daele DJ. Quantitative PCR analysis of laryngeal muscle fiber types. J Commun Disord 43: 327–334, 2010. doi: 10.1016/j.jcomdis.2010.04.006. [DOI] [PMC free article] [PubMed] [Google Scholar]
- 70.van Lunteren E, Moyer M. Sternohyoid muscle fatigue properties of dy/dy dystrophic mice, an animal model of merosin-deficient congenital muscular dystrophy. Pediatr Res 54: 547–553, 2003. doi: 10.1203/01.PDR.0000081762.51546.16. [DOI] [PubMed] [Google Scholar]
- 71.Van Lunteren E, Vafaie H. Force potentiation in respiratory muscles: comparison of diaphragm and sternohyoid. Am J Physiol 264: R1095–R1100, 1993. doi: 10.1152/ajpregu.1993.264.6.R1095. [DOI] [PubMed] [Google Scholar]
- 72.Williams JH. Depression of posttetanic twitch potentiation by low calcium and calcium channel antagonists. J Appl Physiol (1985) 69: 1093–1097, 1990. doi: 10.1152/jappl.1990.69.3.1093. [DOI] [PubMed] [Google Scholar]