

Abstract
Understanding the control of viral infections is of broad importance. Chronic HCV infection causes decreased expression of the iron hormone hepcidin, which is regulated by hepatic BMP/SMAD signaling. We found that HCV infection and the BMP/SMAD pathway are mutually antagonistic. HCV blunted induction of hepcidin expression by BMP6, likely via TNF-mediated downregulation of the BMP co-receptor HJV. In HCV-infected patients, disruption of the BMP6/hepcidin axis and genetic variation associated with the BMP/SMAD pathway predicted outcome of infection, suggesting BMP/SMAD activity influences antiviral immunity. Correspondingly, BMP6 regulated a gene repertoire reminiscent of Type I IFN signaling, including upregulating IRFs and downregulating an inhibitor of IFN signaling, USP18. Moreover, in BMP stimulated cells, SMAD1 occupied loci across the genome similar to those bound by IRF1 in IFN stimulated cells. Functionally, BMP6 enhanced the transcriptional and antiviral response to IFN, but BMP6 and related Activin proteins also potently blocked HCV replication independently of IFN. Furthermore, BMP6 and Activin A suppressed growth of HBV in cell culture, and Activin A inhibited ZIKV replication alone and in combination with IFN. The data establish an unappreciated important role for the BMPs and Activins in cellular antiviral immunity, which acts independently of, and modulates, IFN.
Hepcidin controls iron homeostasis and tissue iron distribution1. Iron is a key nutrient for many pathogens, and most infections and inflammation increase hepcidin expression2, likely as a host attempt to divert iron away from iron-requiring microorganisms. However, HCV infection is associated with low hepcidin, which predisposes patients to accumulate liver iron3,4. In the liver, signaling by BMPs (including BMP6) and Activins via the SMAD transcription factors controls hepcidin transcription, and is vital for maintaining iron homeostasis5. Defective BMP/SMAD signaling, brought about by deficiencies in expression of BMP6, BMP receptors or the BMP6 coreceptor hemojuvelin (HJV), causes iron overload due to hepcidin insufficiency6,7. We hypothesized that HCV infection could cause low hepcidin at least in part by inhibiting the BMP pathway. Moreover, there is some evidence that other viruses besides HCV interfere with BMP signaling in non-hepatocyte cell types, for example the antagonism of BMPR2 by HIV-1 and by KSHV8,9. We were also interested in whether the BMP pathway could contribute to innate immune defence against viral infection. A recent report indirectly suggested that BMP2 may drive a transcriptome that included elements reminiscent of virus-induced and interferon associated responses10. However the functional significance of these effects for viral replication and antiviral immunity remained unclear.
We investigated whether HCV inhibited hepcidin production via disruption of the BMP/SMAD signaling pathway, and then explored the effects of several different BMPs and the related Activin proteins on type I IFN signaling, cellular antiviral responses and replication of HCV, HBV and ZIKV.
Results
The BMP6/hepcidin axis is impaired by HCV and correlates with outcome of infection
BMP6 is produced by the liver in response to accumulation of iron, and induces expression of hepcidin (encoded by HAMP) via BMP receptors and the co-receptor HJV on hepatocyte cell membranes5. In chronic HCV infection, hepcidin levels are relatively low; furthermore, expression of the BMP6 co-receptor HJV is decreased in HCV infected Huh7.5 cells11, suggesting that HCV infection may impair HAMP induction by BMP6. Testing this hypothesis, we exposed HCV-infected and uninfected Huh7.5 cells to a titration of recombinant BMP6 or BMP9 (which does not bind HJV12). HCV-infected cells exhibited a blunted induction of HAMP in response to BMP6 (Figure 1a), but not to BMP9 (Supplementary Figure 1a). One possible mechanism for this effect is through induction of TNF; unlike other viruses, HCV infection is not associated with a strong multi-cytokine pro-inflammatory response, although TNF levels are raised13. TNFA expression increased with multiplicity of infection of HCV as HJV expression fell (Supplementary Figure 1b,c); furthermore TNF dose-dependently decreased HJV expression in uninfected hepatoma cells and blunted these cells’ response to BMP6 (Supplementary Figure 1d,e). Adding neutralizing anti-TNF antibody to HCV infected cells rescued the blunting of hepcidin expression in response to BMP6 (Supplementary Figure 1f).
Figure 1:

HCV–BMP pathway interactions decrease hepcidin and associate with therapeutic outcome a Uninfected or HCV-infected (MOI = 0.02) Huh7.5 cells were incubated with a titration of BMP6 overnight; HAMP mRNA induction in response to BMP6 was significantly suppressed in HCV-infected cells (Mean ± SEM shown; P<0.0001: two-tailed Wilcoxon matched-pairs signed rank test; n=6 biologically independent experiments).
b Patients with known treatment outcome (n=26 biologically independent samples) were separated by outcome (Sustained Virological Response (SVR) and Non-Responder (NR) and compared to the control group (n=8). HAMP mRNA expression was reduced in both groups compared to controls whereas HJV and ID1 were significantly reduced only in the NR group (Geometric means +/− geometric standard deviations shown; one-way ANOVA on log10-transformed data: Bonferroni’s multiple comparison test adjusted p-values are indicated.
c BMP target genes ID1 and HAMP mRNA were correlated across these three groups (Pearson correlation of log10-transformed data: r2=0.701; p<0.0001 (two-tailed); n=25 independent samples (n=8 control, n=11 SVR, n=6 NR).
d, e Ratio of expression of HAMP or ID1 to BMP6, derived to represent an ‘output-per-input’ ratio (data available from n=25 independent samples: n= 8 control; n=11 SVR;; n=6 NR). HAMP/BMP6 was significantly reduced in NRs and SVRs; ID1/BMP6 was significantly reduced in NRs (boxes indicate inter-quartile range with median; whiskers indicate range; one-way ANOVA: Tukey’s multiple comparison test adjusted p-values are indicated).
f, g BMP pathway gene enrichment is linked to HCV clearance. SNPs linked to four BMP-pathway genes (BMP6, ACVR1/ALK2, EVI1, SKIL, (f)) were in the top 66 GWA intervals associated with differential clearance of HCV (Ge et al., 2009). g The frequency of four genes (black dotted line) from a million randomly generated gene-sets of similar size to the BMP pathway occurring in the 66 GWA intervals identified by Ge et al (Random gene-set, left), or of four BMP pathway genes occurring in a million randomly generated sets of 66 GWA intervals (Shifting of GWA intervals, right), was determined against randomized backgrounds (grey histograms), as discussed in detail in Supplementary Methods.
h Changes in expression of the type I IFN pathway related genes (IFNAR2, JAK1, STAT2, IRF9, ISG15, IFI6) identified by microarray of Huh7.5 cells treated with BMP6 for 24h were confirmed by qRT-PCR; BMP target gene ID3 was measured as a positive control (n = 2 independent experiments, each run in triplicate, giving a total of 6 RNA extracts per condition; plots depict mean +/− SEM fold changes relative to untreated cells; two-tailed unpaired t-test)
We next investigated whether the BMP6/hepcidin axis is altered in patients with chronic HCV infection. We analyzed mRNA expression in pre-treatment liver biopsies of patients chronically infected with HCV genotypes 1 or 3 whose eventual response to antiviral therapy with type I IFN and ribavirin was known (sustained virological responder [SVR] or non-responder [NR], Supplementary Table 1). Compared to control uninfected liver tissue, pre-treatment NRs had lower HAMP, reduced HJV and reduced levels of ID1, a canonical BMP target gene (Figure 1b). HAMP, but not ID1, can be regulated by IL6 as well as by BMPs; however, the correlation of ID1 and HAMP levels in all groups (Figure 1c), supports the impairment of BMP signaling as the primary cause of low hepcidin in HCV infected patients. We also measured liver BMP6 and calculated HAMP/BMP6 and ID1/BMP6 ratios as assessments of BMP6 target gene output per BMP6 input. Both of these ratios were significantly reduced in pre-treatment NRs (Figure 1d, e). These data indicate that HCV impairs liver BMP6 signaling and reduces levels of HJV expression, such that synthesis of hepcidin in response to BMP6 is suppressed. Moreover, an impaired BMP6/hepcidin axis is associated with failure to respond to antiviral treatment.
Motivated by this data, we conducted a hypothesis-driven re-analysis of a published genome-wide association (GWA) study of response to IFN and ribavirin therapy in HCV infected patients14, which found polymorphisms in IL28B to be associated with different outcome after therapy. The study provided a list of 100 SNPs most associated with differential HCV clearance14, and we examined this dataset to investigate whether common genetic variants in the BMP pathway also associate with different treatment outcomes. The 100 SNPs covered 66 independent GWA intervals (see methods) and contained polymorphisms (listed in Figure 1f) linked to EVI-1 and SKIL (which regulate BMP/SMAD signaling15,16), ACVR1/ALK2 (a BMP Type I receptor required for hepcidin synthesis17), and BMP6 itself, suggesting a potential enrichment of BMP pathway components. To determine the significance of this enrichment (see methods), we calculated the likelihood of a) BMP pathway genes occurring in one million randomly generated sets of 66 GWA intervals, and b) genes from one million randomly generated gene-sets of similar size as the BMP pathway (Supplementary Table 2) occurring within the defined 66 GWA intervals. In both cases, the probability of four genes (i.e. the number found by the previous study14) arising by chance was very low (p=3.89×10e-4 and p<1×10e-6; Figure 1g). This analysis demonstrates that BMP/SMAD pathway genes were significantly over represented within GWA intervals that predict differential HCV clearance in response to pegylated IFN and ribavirin, showing that the BMP pathway is an important determinant of the antiviral response to HCV in humans.
The transcriptome of BMP6 treated hepatoma cells: altered cell-cycle and IFN signaling
To understand the effects of BMP6 in more depth, we exposed Huh7.5 cells to BMP6 and measured changes in the transcriptome by microarray. The set of 2275 significantly differentially expressed genes were subjected to pathway analysis, which reported a difference in BMP signaling as expected, changes to cell-cycle regulation, and that the type I IFN signaling pathway (and STAT signaling) was altered (Supplementary Figure 2). Both BMPs and IFN regulate the cell-cycle; IFN causes G0/G1 arrest and this cytostatic property has led to its adoption as a therapy for some cancers, as well as for viral infection18. Furthermore, permissivity for HCV replication in hepatoma cells depends in part on loss of a virally-activated host protein, CREBL1, that inhibits the cell-cycle19. Therefore we tested how BMP6 influenced cell-cycle progression on Huh7 cells, using the cytostatic agent UCN-01 as a positive control that elicits cell-cycle arrest partly via transcriptional induction of the cyclin-CDK inhibitor p21 (encoded by CDKN1A). BMP6 increased HAMP as expected and upregulated CDKN1A, and reduced the number of cells in S-phase due to accumulation in G0/G1 and G2/M (Supplementary Figure 3a,b). UCN-01 had similar effects on cell-cycle progression and furthermore inhibited HCV replication in the OR6 HCV replicon line, in which luciferase is used as a measure of HCV replication20, to a similar extent to IFN (Supplementary Figure 3c).
Specific genes in the IFN signaling pathway altered by BMP6 in the microarray are shown in Supplementary Figure 4. We confirmed by qPCR that IFNAR2, JAK1, STAT2, IRF9, IFI6 and ISG15 were increased by BMP6 in Huh7 cells (Figure 1h); STAT2, IRF9, IFI6, and ISG15 mRNA were also upregulated in primary human hepatocytes exposed to BMP6, although JAK1 and IFNAR2 were not significantly upregulated (Supplementary Figure 5). Of the 2275 differentially expressed genes we found 62 members of the 355 ‘interferon stimulated gene’ (ISG) set investigated previously for their anti-HCV properties21; the identity of these genes, the direction of regulation by BMP6 and their known effects on HCV replication are shown in Supplementary Table 3.
Genome-wide loci bound by SMAD1 include multiple antiviral loci and substantially overlap with loci bound by IRF1
To further understand how BMP signaling might interact with the IFN pathway, we focused on the genes targeted by SMAD1, which mediates transcriptional effects of BMPs in complex with SMAD4. We assessed the specific loci bound by SMAD1 by interrogating genome-wide ChIPseq datasets of BMP4-treated erythroleukemic K562 cells and monocytic U937 cells (Supplementary Table 4). We assigned SMAD1 associated peaks with their putative cis-regulated target gene loci. In both cell types, pathway analysis of genomic loci bound by SMAD1 indicated changes to TGF beta-type signaling and SMAD signaling as expected, and alteration of the Type I IFN response (Supplementary Figure 6), consistent with the pathway analysis of our microarray data from BMP6-treated Huh7 cells (Supplementary Figure 2). BMP4 treatment of K562 and U937 cells caused SMAD1 to bind to loci of multiple genes associated with the Type I IFN response (genes and exact binding loci are specified in Supplementary Tables 5, 6) including IFNAR2, JAK1 and STAT2, the mRNA expression of which were upregulated in hepatoma cells by BMP6 (Fig. 1h).
For K562 cells, further available ChIPseq datasets22,23 allowed genome-wide comparison of SMAD1 bound loci to the loci bound by other transcription factors, and we developed and validated an approach to analyze this (see Supplemental Methods). Figure 2a visualizes the overlap of loci bound by SMAD1 after BMP4 treatment with loci bound by IRF1, STAT1 and STAT2 after IFN treatment, and shows considerable loci in common between SMAD1 and IRF1. RNA Polymerase II was present at many of the loci shared between SMAD1 and IRF1, indicating the genes are actively expressed (Figure 2b). Mapping the specific transcription factor binding peaks, SMAD1 binding in BMP4-treated K562 cells was enriched +/− 500bp around the loci bound by IRF1 (a key mediator of broad antiviral activity21) in IFN treated K562 cells (Figure 2c). This enrichment of SMAD1 binding in the region of IRF1 binding was not apparent in K562 cells treated with dorsomorphin, a small molecule BMP type I receptor kinase antagonist that prevents SMAD1 activation24 (Figure 2c), showing that stimulation of the BMP signaling pathway is required for the IRF1-like occupancy of loci by SMAD1. Binding of other transcription factors that lack roles in antiviral immunity was not enriched proximal to IRF1-bound loci (Figure 2d). However, and as a further control, genome-wide binding of STAT1 and STAT2 (which are involved in antiviral immune responses) did show some overlap with IRF1 binding in IFNalpha treated cells (Figure 2e), to a similar degree to that of SMAD1 in BMP4 treated cells. This ChIPseq analysis shows that, genome-wide, there was overlap between those loci occupied by IRF1 after IFN/JAK/STAT signaling and those loci occupied by the transcription factor SMAD1 after BMP/SMAD signaling. Electromobility-shift assays showed that IRF1 binds interferon-sensitive response elements (ISRE) but not BMP response elements (BRE), while SMAD4 binds BRE but not ISRE (Supplementary Figure 7). Therefore it is unlikely that ISG-type antiviral genes are upregulated by BMP6 due to SMADs and IRFs being able to separately target each other’s consensus binding site.
Figure 2:

Enrichment of SMAD1-bound loci proximal to IRF1-bound loci a Venn diagram depicting the numerical overlap in genes to which peaks derived from each of four peak sets (BMP4-SMAD1, IFNa-STAT1, IFNa6h-STAT2 and IFNa6h-IRF1) are annotated. 2632 genes are in common between BMP4-SMAD1 and IFNa6h-IRF1.
b Venn diagram representing the numerical overlap in genes to which peaks derived from the BMP4-SMAD1 and IFNa6h-IRF1 peak sets, in addition to untreated K562 cells immunoprecipitated for RNA Pol2, are annotated.
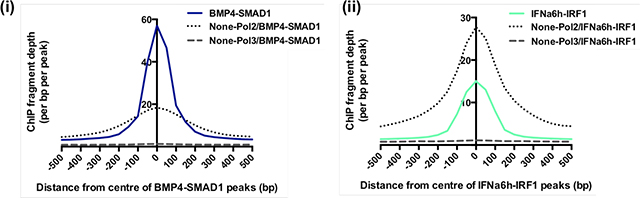
c-e Histograms report the density of reads obtained from ChIP-seq of each transcription factor (TF), under the specified stimulation conditions and normalized to 10 million reads in each case (to avoid arte facts arising from variation in dataset size), mapping to +/− 500bp of the genomic loci bound by the comparator transcription factor (IRF1 in K562 cells treated with IFN alpha for 6 hours). c The density of SMAD1 binding in BMP4-treated K562 is enriched +/− 500bp around loci bound by IRF1 following 6h IFN alpha stimulation of K562; in cells treated with dorsomorphin, which inhibits SMAD1 activation, SMAD1 binding is not enriched near IRF1-binding.
d The density of reads derived from ChIP-seq for non-BMP pathway associated transcription factors (ARID3A, ELK1, INI1, RAD21, XRCC4) is not enriched near IRF1-bound loci in unstimulated cells.
e The density of reads derived from ChIPseq for the Type I IFN-associated transcription factors STAT1 and STAT2 are enriched near IRF1-bound loci in IFN-alpha treated cells.
BMP6 regulates expression of several key antiviral effectors
We noted that several IRF loci were also bound by SMAD1 in BMP4-treated cells, including IRF1 itself, IRF2 and IRF7, all individually implicated as critical components of broadly acting antiviral immunity that can suppress viral replication (including HCV replication)21. We found that IRF1, IRF2 and IRF7 mRNA expression was significantly upregulated by BMP6 in hepatoma cells (Figure 3a, Supplementary Figure 8a). IRF1, IRF2 and IRF7 can also be regulated by IFN, so we sought to confirm that BMP6 and IFN act via different signalling pathways. IFN but not BMP6 strongly induced STAT1 phosphorylation while BMP6 caused dose-dependent SMAD1/5/8 phosphorylation, which was inhibited by the dorsomorphin-like BMP type I receptor kinase antagonist LDN-19318924; IFN appeared to cause a very small degree of SMAD1/5/8 phosphorylation, but at a much lower level compared to the lowest dose of BMP6 (2nM), and this effect of IFN was not apparently dose-dependent (Figure 3b). Furthermore we found that LDN-193189 and dorsomorphin blocked the upregulation of IRF1 by BMP6 but not by IFN (Figure 3c). A similar effect was observed for IRF2, and upregulation of IRF7 by BMP6 was also inhibited by LDN-193189 and dorsomorphin, while IFN did not upregulate IRF7 mRNA (Supplementary Figure 8a).
Figure 3: BMP6 increases expression of IRF1 and IRF7 and decreases expression of USP18.

a The levels of IRF1, IRF7 and the canonical BMP target gene ID1 mRNA, quantified by qRT-PCR, in Huh7.5 cells treated for 20h with 18nM BMP6 versus untreated controls. Plots display mean ± SEM; two-tailed paired t-test; data summarise n=4 independent biological experiments).
b 1×10^5 Huh7.5 cells were plated 24h prior to treatment with LDN193189 (LDN, 100nM), LDN + BMP6 (at 18nM), or BMP6 or IFN alpha titrations as shown; cells were lysed for phospho-SMAD1/5/8 or phospho–SAT1 analysis by Western Blot 30 mins post-stimulation. GAPDH was used as a loading control. Data are representative of those obtained in two independent experiments.
c The levels of IRF1 mRNA in Huh7.5 cells treated with 2uM dorsomorphin (Dorso) or 0.2uM LDN-193189 (LDN) 30 minutes prior to co-incubation with 18nM BMP6 for 20h or 1000U/mL IFN-alpha for 6h (plots display mean of log-transformed data ± SD; two-tailed paired t-tests on log-transformed data, n=3 independent biological replicates).
d USP18 mRNA expression in Huh7.5 cells treated with LDN-193189 (LDN, 0.2uM) or Ruxolitinib (Rux, 2.5uM) prior to co-incubation with BMP6 (18nM, 20h) or IFN-alpha (100U/mL or 1000U/mL, 6h) (Plots display mean ± SEM; repeated measures ANOVA; adjusted p-values from Tukey’s multiple comparison test are shown; n=3 biologically independent experiments).
We also noted SMAD1 binding at the loci of USP18, an HCV restriction factor and critical negative feedback inhibitor of IFN25,26. BMP6 stimulation down regulated USP18 expression (i.e. the opposite effect of IFN stimulation); this down regulation of USP18 was rescued by LDN-193189 but not by the JAK kinase inhibitor ruxolitinib27 (Figure 3d). In contrast, the upregulation of USP18 by IFN was blocked by ruxolitinib but not by LDN-193189 (Figure 3d).
Together these data show that BMP6 regulates mRNA expression of key components of the antiviral signaling apparatus independently of IFN, and in the case of the IFN signaling inhibitor USP18, the direction of regulation by BMP6 is opposite to that of IFN, potentially favouring antiviral activity by derepressing the IFN pathway.
BMP6 enhances STAT phosphorylation and transcriptional and antiviral response to IFN
Because BMP6 upregulated IFNAR2 and components of the intracellular signal transduction machinery (JAK1, STAT2, IRF1, IRF2, IRF7, IRF9), and down regulated USP18 (which inhibits JAK1 binding to IFNAR225), we hypothesized BMP6 might enhance the cellular response to IFN, and we tested this in three ways. First we found that STAT1 phosphorylation following IFN exposure was significantly increased if cells had been pre-treated with BMP6 (Figure 4a), consistent with previously described effects of USP18 deficiency28. Second, we assayed the effect of BMP6 on the IFN-mediated increase in mRNA of seven interferon-stimulated genes (ISGs): MX1, IFI6, ISG15, IFIT3, IFITM1, PLSCR1, TRIM14 – the latter four of which are required for suppression of HCV by IFN29. BMP6 pre-treatment significantly increased response to IFN for all these ISGs (Figure 4b, Supplementary Figure 8b). We also found that BMP6 enhances the protein levels of MDA5/IFIH1, which regulates sensing and control of HCV infection30, in response to a titration of IFN (Figure 4c). Third, we tested whether BMP6 could enhance the antiviral effects of IFN on HCV. We found that BMP6 increased the anti-HCV activity of both IFN alpha and IFNlambda3 (encoded by IL28B, polymorphisms in which are associated with differential HCV clearance14) in the OR6 HCV replicon cell culture system20 (Figure 4d, e). BMP6 also increased the ability of IFN alpha to restrict the growth of replication competent JFH1 HCV in Huh7.5 cells, as assessed by staining for HCV core protein (Figure 4f). These results show that BMP6 enhances IFN activity.
Figure 4: BMP6 enhances IFN activity.

a STAT1(Y701) phosphorylation analyzed by Phos flow in Huh7.5 cells treated with or without BMP6 (18nM, 18–20h) followed by IFN-alpha (100U/mL, 30 minutes). Flow Cytometry analysis from a representative experiment and normalized MFI from n=3 biologically independent experiments are shown. Plots indicate means ± SEM; repeated measures ANOVA: Bonferroni’s multiple comparison test adjusted p-values are indicated.
b TRIM14 and IFI6 mRNA expression in Huh7.5 cells co-treated with BMP6 (18nM) and an IFN-alpha titration for 24h. Data from n=3 biologically independent experiments are shown. Plots indicate means ± SEM; repeated measures ANOVA: Bonferroni’s multiple comparison test adjusted p-values are indicated.
c Huh7.5 cells were plated overnight before pre-treatment for 18h with recombinant BMP6 (18nM) or vehicle, prior to addition of a titration of IFN-alpha; cells were lysed a further 4h later. Induction of the ISG MDA5 (IFIH1) was assessed by Western Blot with Actin used as a loading control, normalizing protein loading according to BCA assay. Representative of n=3 biologically independent experiments.
d, e Luciferase activity in OR6 cells (that harbor an HCV-replicon linked to luciferase) treated with or without BMP6 (2nM or 18nM, 24h) followed by addition of a titration of IFN-alpha (10–1000U/mL (d)) or IFN-lambda3 (2.5–100ng/mL (e)) for 20h. Data from n=3 biologically independent experiments in each case are shown. Plots indicate means ± SEM; repeated measures ANOVA: Bonferroni’s multiple comparison test adjusted p-values are indicated.
f Huh7.5.1 cells were incubated with BMP6 (18nM), IFN alpha (12.5IU/mL) or BMP6 plus IFN alpha for 24h, and then JFH1 HCV at MOI of 1 was added for 4h. Media was then removed and cytokines (but no virus) were re-added at the same concentrations for a further 48h before the percentage of HCV infected cells in the culture was determined by immunofluorescence for HCV core protein. Data from n=3 biologically independent experiments; plots depict geometric mean +/− geometric SD; repeated measures one-way ANOVA comparing log-transformed Vehicle, BMP6, IFNa and BMP6+IFNa data: Bonferroni’s multiple comparison test adjusted p-values are indicated.
Multiple BMPs and Activins are directly antiviral against HCV
SMAD1 and IRF1 binding peaks were observed in close proximity in active regulatory chromatin regions in K562 cells and primary CD34+ cells near directly antiviral effector genes RSAD2 (viperin), SSBP3, ZC3HAV1 (ZAP) (Supplementary Figure 9a–c), suggesting expression of these genes may be influenced by BMPs, and indeed BMP6 increased mRNA expression of RSAD2, SSBP3, ZC3HAV1 in Huh7 cells (Supplementary Figure 9d). We then considered that BMPs might have IFN-independent antiviral effects because BMP6 modulated key antiviral immune response regulators (IRF1, IRF2, IRF7), and increased expression of directly acting antiviral effector genes (RSAD2, SSBP3, ZC3HAV1). Furthermore, we noted that as well as boosting the antiviral effects of IFN, BMP6 also appeared to impair viral replication in the absence of added IFN in Figure 4f. Testing this idea further, adding BMP6 to cultures immediately after infecting Huh7.5 cells with JFH1 HCV restricted the accumulation of HCV RNA in culture supernatants (Figure 5a). After day 5 of culture, we found increased cellular expression of BMP target genes HAMP, ID1 and SMAD7 as a function of increasing BMP6 concentration, a general trend towards up regulation of IFNAR2, JAK1, STAT2, IRF1 and IRF9 expression, and a significant down regulation of USP18 (Supplementary figure 10a–c), observations consistent with our previous data above (Fig 1h, 3). The addition of BMP6 to cultures in which HCV had already been replicating for 3 days significantly reduced cellular and supernatant HCV RNA measured after a further 7 days (Figure 5b); and BMP6 added in the absence of IFN suppressed activity of the OR6 HCV replicon over time (Figure 5c). Suppression of HCV replication by BMP6 was prevented by LDN-193189 and dorsomorphin (Figure 5d), but not by ruxolitinib or anti-IFNAR2 antibodies (Figure 5e). Conversely, anti-IFNAR2 and ruxolitinib, but neither LDN-193189 nor dorsomorphin, prevented suppression of HCV replication by IFN (Figure 5e, Supplementary Figure 11a). Antiviral transcriptional responses are regulated by the phosphorylation of IRF3 and IRF7 by kinases TBK1 / IKK epsilon, which can be inhibited by the small molecule Bx79531. We found that Bx795 reduced the antiviral effects of both BMP6 and IFN in a dose-dependent fashion so that at 1uM Bx795 neither BMP6 nor IFN significantly suppressed replicon growth (Supplementary figure 11b). Therefore, the antiviral activity of BMP6, but not that of IFN, requires BMP-SMAD signaling, whereas IFN but not BMP6 requires IFNAR2 and JAK-STAT signaling; however, the antiviral activity of both BMP6 and IFN appear to require directly or indirectlyTBK1 / IKK epsilon kinase activity.
Figure 5: BMPs and Activins are antiviral against HCV.

a Left – HCV RNA in supernatants of Huh7.5 cells incubated with a titration of BMP6 (2–52nM) was reduced in BMP6-treated cultures. Plots depict mean +/− SEM. Data from n=3 biologically independent experiments. Right – Supernatant HCV RNA at 5 days post-infection was significantly lower in cultures treated with BMP6 for the duration of the infection. Administration of 1000U/mL IFN-alpha 1 day prior to RNA extraction also resulted in a significant reduction in supernatant HCV RNA. Data from n=4 independent experiments (n=3 only available for certain conditions). Plots depict mean +/− SEM; One-way ANOVA: Bonferroni’s multiple comparison test adjusted p-values comparing with untreated are indicated.
b Levels of supernatant and cellular HCV RNA 10 days post-infection were lower in cells treated with 18nM BMP6 for the last 7 days or 1000U/mL IFN-alpha for 1 day compared to untreated infected cells. Data from n=3 biologically independent experiments are shown. Plots indicate means ± SEM; repeated measures ANOVA: Bonferroni’s multiple comparison test adjusted p-values with respect to untreated cells are indicated.
c Timecourse of luciferase activity in OR6 cells treated with 18nM BMP6 or 1000U/mL IFN-alpha. Data from n=3 biologically independent experiments are shown. Plots indicate means ± SEM; repeated measures ANOVA; Bonferroni’s multiple comparison test adjusted p-values with respect to untreated cells from the same timepoint are indicated.
d Luciferase activity 72h in OR6 cells treated with 2uM dorsomorphin or 0.2uM LDN-193189 for 30 minutes prior to addition of 18nM BMP6 for 72h. Data from n=4 biologically independent experiments are shown. Plots indicate means ± SEM; p-values from two-tailed paired t tests are shown.
e Left Luciferase activity in OR6 cells pre-treated with a blocking anti-IFNAR2 antibody or isotype control (25ug/mL) for 1h followed by addition of 18nM BMP6 or 10U/ml IFN-alpha measured 72 h after BMP6/IFN-alpha administration. Data from n=3 biologically independent experiments are shown. Right - luciferase activity in OR6 cells pre-treated with 2.5uM Ruxolitinib for 1 h prior to co-incubation with 18nM BMP6 or 100U/mL IFN-alpha, measured 72 h after BMP6/IFN-alpha administration. Data from n=4 biologically independent experiments are shown. Plots indicate means ± SEM; repeated measures ANOVA: Bonferroni’s multiple comparison test adjusted p-values are indicated.
f Luciferase activity in OR6 cells after 72h treatment with 18nM BMP6 or a dose titration of Activin A or Activin B. Data from n=3 biologically independent experiments each carried out in triplicate; Plots indicate means ± SEM; repeated measures ANOVA: Bonferroni’s multiple comparison test adjusted p-values with respect to untreated cells are indicated.
A previous report suggested BMP7 may have anti-HCV activity32; we also found that BMP9 and BMP4 (which like BMP6 and BMP7 bind the BMP type I receptors), suppressed HCV replication, whereas BMP15, GDF15, and GDF1, which bind other receptors, had no such activity (Supplementary Figure 11c, d). We next tested the effects of Activin B, a non-BMP TGF-beta superfamily member that can bind HJV and BMP type I receptors, and causes SMAD1/5/8 phosphorylation and induces hepcidin in liver-derived cells33. Activin B suppressed HCV replication (Figure 5f) in a manner partially blocked by LDN-193189 (Supplementary Figure 11e), and we found similar results for Activin A (Figure 5f, Supplementary Figure 11e), which also can induce hepcidin transcription, although not as potently as Activin B34.
Antiviral activity of BMP6 and Activin A against HBV and ZIKV
BMP signaling controls expression of genes that regulate a broadly acting antiviral response, so we considered whether BMPs (and Activins) may have activity against other viruses besides HCV. Furthermore, inhibition of USP18 and up regulation of RSAD2 and ZC3HAV1 (which we showed above are caused by BMP6) have each been independently associated with control of the double stranded DNA virus, Hepatitis B virus (HBV)35–37. Therefore, we tested the ability of BMP6, and Activin A, to inhibit growth of HBV. In HepaRG cells harboring replicating HBV, we found that BMP6 reduced the production of HBV S protein (HBs Ag) from infected cells in a dose dependent manner, and HBs Ag levels were also potently suppressed by Activin A to a degree similar to that caused by IFN alpha or the anti-HBV drug lamivudine (Figure 6a). Finally, we assessed the effects of Activin A on Zika virus (ZIKV) replication in the lung epithelial cell line A549. Akin to HCV, ZIKV is a positive sense ssRNA virus of the Flaviviridae family. We found that IFN alpha and Activin A individually inhibited viral replication (Figure 6b,c) and that Activin A and IFN together had an increased antiviral effect compared to IFN alone (Figure 6d, e).
Figure 6. Effects of BMP6 and Activin A against HBV and ZIKV.

a HepaRG cells were infected with a fixed inoculum of HBV and incubated for seven days in the presence of lamivudine 25 uM, recombinant human IFNα 1000U/mL or recombinant human BMP6 at 18nM, 52nM (Left) or Activin A at 10nM (Right). At the endpoint, supernatants were assayed by ELISA for Hepatitis B surface antigen (HBs Ag) and normalized to untreated infected cells run concurrently. Data represent (left) n=5–10 replicate treatments run across n=4 separate days, and (right) n=12–15 replicate treatments run across multiple days. One way ANOVA; Bonferroni’s multiple comparison test adjusted p-values, comparing with untreated, are indicated.
b-e A549 cells were pre-treated for 16 hours with the indicated concentrations of IFN-alpha and/or Activin A, then washed and noculated with ZIKV (H/PF/2013 strain) at an MOI of 1 for 2 hours. Medium was then replaced and the cells were incubated for another 24 hours in the presence of fresh IFN-alpha and/or Activin A. Supernatants were harvested and viral titres were assessed by plaque assay on VeroE6 cells. Data from n=3 biologically independent experiments: results are shown individually (black, red and blue lines) to adequately represent experimental variability and general trends. Data is shown as absolute titres (pfu/ml) (b, d) or expressed as fold changes to compensate for experimental variability (c, e). Two-tailed ratio paired t-tests of three independent experiments were performed; p-values are indicated.
Discussion
Previously the relationship between HCV replication, iron and hepcidin has been explored with conflicting results38–41. We propose that low hepcidin and the consequent mild liver iron accumulation observed in chronic HCV infection does not strongly influence HCV replication directly, but instead is a consequence of the disruption of BMP/SMAD signaling by HCV. Mechanistically we found that TNF expression is induced by HCV infection, inhibits expression of the BMP6 co-receptor HJV, and is required for HCV-mediated suppression of hepcidin induction by BMP6. A recent study showed that TNF increases expression of the IFN signaling inhibitor protein, USP18, in hepatoma cells42. Therefore, TNF, induced in hepatocytes by HCV and acting intra-hepatically, appears to inhibit both BMP and IFN signaling.
Conversely, we found that BMPs (and the related proteins Activin A and B) suppress HCV replication. This reciprocal interaction of HCV and BMP/SMAD is reminiscent of that between HCV (and many other viruses) and IFN (see scheme in Supplementary figure 12). Moreover, we found that both BMP6 and Activin A restrict replication of the DNA virus HBV and that Activin A inhibits ZIKV replication. A separate study showed that BMP2 reduces the replication of another DNA virus MHV68 gammaherpes virus (through undetermined mechanisms)43. Future studies should address which viruses are sensitive to BMPs/Activins, possibly in conjunction with IFN, and whether antagonism of the BMP and/or Activin pathways is a frequent feature of viral infection.
The mechanisms behind the IFN-independent antiviral activity and the IFN-enhancing properties of BMP/SMAD signaling are likely due to the regulation of a complex gene repertoire that contains many components of classical antiviral innate immune orchestrators (including IRF1, IRF2, IRF7, IRF9, which in turn regulate many other antiviral genes), cell-cycle regulators, and directly acting antiviral genes such as RSAD2, SSBP3 and ZC3HAV1. IRF1 is a transcriptional regulator that when overexpressed is strongly and broadly antiviral against HCV, yellow fever virus, chikungunya virus, Venezuelan equine encephalitis virus and HIV-121; IRF1 also has antiviral activity independently of IRF3, IRF5 and IRF744. Overexpression of IRF2 or IRF7 is also antiviral against HCV21. USP18 is an inhibitor of IFN signaling25,26 that is up regulated in chronic HCV infection, and lower levels of USP18 are associated with suppression of viral replication in vitro and a beneficial response to IFN in patients45,46. We showed that BMP6 induces expression of IRF1, IRF2 and IRF7, but decreases expression of USP18 (via a currently unknown mechanism) in a BMP receptor kinase-dependent fashion. Similarly, the restriction of HCV replication by BMP6 was prevented by BMP pathway inhibitors but not by anti-IFNAR blockade or ruxolitinib-mediated JAK-STAT inhibition. This data shows that BMP6 modulates key antiviral orchestrators and has anti-HCV activity independently of IFN; but can also potentiate IFN, perhaps in part via USP18 down regulation.
At a genomewide level we showed that after BMP4 stimulation, SMAD1 was located near many genes with well-described roles in the IFN response pathway and antiviral immunity (including IRF1, IRF2, IRF7 and USP18). Furthermore, across the genome, there was a marked overlap between those loci occupied by IRF1 after IFN stimulation and those loci occupied by SMAD1 after BMP4 stimulation. This supports the concept that BMP/SMAD signaling is antiviral in a manner reminiscent of IFN/IRF1 activity, although independently of IFN. Interestingly, SMADs and many IRFs (although not IRF1) demonstrate strong electrostatic and topological similarity in their C-terminal domains, may derive from a common ancestor47, and can directly interact via oligomerisation48. Therefore the antiviral activity of BMP signaling may conceivably further interact with IFN function and antiviral immunity through SMAD/IRF heterodimerisation. This could explain why Bx795, an inhibitor of TBK1 / IKK epsilon that phosphorylates IRF3 and IRF7, counteracted the antiviral effects of both IFN and BMP6; future work should explore how the responses induced by BMP6 and IFN interconnect at the level of transcription factor activation and binding.
In summary BMP/SMAD signaling regulates the expression of a broad repertoire of antiviral genes, enhances the response to IFN, has antiviral activity independent of IFN, and is inhibited by HCV leading to decreased hepcidin.
Online methods
Patient biopsy samples
We investigated 26 HCV patients who had presented at Mater Misericordiae University Hospital, Dublin, Ireland or S. Bortolo Hospital, Vicenza, Italy (Supplementary Table 1). Liver biopsies were collected prior to the commencement of antiviral therapy using an 18-gauge needle and the sample split into two for both histological grading and gene expression analysis. Informed written consent was obtained from all patients and the study was approved by the Research Ethics Committees of the Mater Misericordiae University Hospital, Dublin and S. Bortolo Hospital, Vicenza, Italy. All HCV patients were negative for HBV and HIV-1, and did not show clinical evidence of hemochromatosis (transferrin saturation <45%), although serum ferritin levels were high-normal (mean 350ug/ml). Patients were classified as sustained virological responders (SVRs) if they were found to be HCV RNA negative 6 months after treatment finished, or non-responders (NRs) if they remained HCV RNA positive at that time point. Treatment consisted of weekly Peg-IFN plus a daily dose of Ribavirin according to body weight. The mRNA from liver biopsies was extracted using RNeasy kits (Qiagen) and reverse transcribed using the High Capacity RNA-to-cDNA kit (Applied Biosystems). RNA was extracted with the inclusion of a gDNA elimination step from a subset of the biopsies (n=17) used to determine ID1 mRNA levels. Gene expression was assessed using qRT-PCR as described below. Control liver biopsy mRNA samples were obtained from 3h Biomedical (Sweden) (all Caucasians, non-alcoholic, negative for viral hepatitis and haemochromatosis) and analysed alongside the HCV biopsy samples.
Cell culture and reagents
For all cell lines, periodic routine testing for mycoplasma was performed, and experiments presented were on mycoplasma negative cells. The hepatoma cell line Hep3B (ATCC) was maintained in MEM-alpha supplemented with 10% foetal calf serum (PAA), 2mM glutamine, 100U/mL penicillin, 0.1mg/mL streptomycin (all Sigma). HuH7 (ATCC) and HuH7.5 (Apath) cells were cultured in DMEM supplemented as above. OR6 cells12, and their IFN-cured counterpart were cultured in DMEM supplemented as above, but in the case of OR6 cells were also supplemented with G418 at 500ug/mL (Sigma).
Primary human hepatocytes (Pfizer) were plated in 24-well collagen I-coated plates (350 000 cells per well) in William’s E media (Life Technologies) supplemented with 5% foetal calf serum and the Primary Hepatocyte Thawing and Plating Supplements kit (Life Technologies), and incubated at 37°C and 5% CO2. After 4 hours, media was changed and supplemented with 50 ng/ml of recombinant human BMP6 (R&D systems) or PBS. After 18h of incubation, RNA was extracted using the RNeasy mini kit (Qiagen), and cDNA was synthesized using the High-Capacity RNA-to-cDNA™ Kit (Applied Biosystems). Gene expression was analyzed by qRT-PCR using Taqman probes for each gene and using GAPDH as endogenous control.
BMP4, 6, 9, 15, GDF1, GDF15, Activin B, TNF-alpha, IFN-lambda and Mouse isotype control IgG2A antibody (Clone 20102) were from R&D Systems, IFN-alpha and anti-IFNAR2 antibody (Clone MMHAR-2) from PBL Biomedical Laboratories and Hepcidin from Peptide Institute were stored and reconstituted as recommended. Dorsomorphin from Tocris Bioscience and LDN-193189 from Axon Medchem were reconstituted in water, Ruxolitinib from Selleck Chemicals was reconstituted in DMSO. All were used at doses described in figure legends.
Quantitative real-time PCR (qRT-PCR)
RNA extraction and cDNA synthesis were carried out by using either RNeasy or RNeasy PLUS kits with QIA shredder homogenization (all from Qiagen) and the High capacity RNA-to-cDNA kit (Applied Bio systems), all according to the manufacturers’ protocols. qRT-PCR reactions were performed on an Applied Bio systems 7500 Fast Real-Time PCR System (Applied Bio systems). Gene expression was assessed using inventoried Taqman Gene Expression Assays with Taqman Gene Expression Master Mix (both Applied Bio systems) following the manufacturer’s instructions. Samples were run in duplicate and gene expression levels were quantified relative to glyceraldehyde-3-phosphate dehydrogenase (GAPDH) mRNA expression using the delta Ct method, except for HCV RNA quantification (method detailed below); in some cases relative expression was then evaluated further by normalizing to the untreated controls (delta-delta Ct method).
Flow Cytometry
HuH7.5 cells treated with or without BMP6 for 18–20 hours followed by a titration of IFN-alpha doses (100–10,000U/mL) were fixed at 30 mins post-IFN-alpha addition using BD Cytofix for 10 minutes followed by permeablisation using BD Perm Buffer III (both BD Biosciences) according to the manufacturer’s protocols. Cells were then stained using an anti-pSTAT1(pY701)-AlexaFluor647 antibody (Clone 4a; BD Biosciences) and an anti-pSTAT3(pY705)-PE antibody (Clone 4/P-STAT3; BD Biosciences) or isotype controls: IgG2A-AlexaFluor647 antibody (Clone eBM2a; e Bioscience) and IgG2A-PE antibody (Clone MOPC-173; BD Biosciences). Cells were analysed using a CyAn (Dako).
Western blotting
HuH7 cells, seeded at 5×10e4 cells/well (in 500μl, 24-well plate) or 1 × 10e5 cells/well (1mL, 12-well plate) were treated with or without BMP6, IFN-alpha, or LDN193189 at doses and incubation times as described in figure legends. At the end of incubations, cells were washed with cold PBS and lysed within the well on ice with cold Pierce RIPA buffer (Thermo Scientific) with Protease/Phosphatase Inhibitors (1:100, Cell Signaling Technology). Protein concentrations of lysates were quantified using the Pierce BCA Protein Assay kit (Thermo Scientific. After incubating with Laemmli Sample buffer (Bio-Rad) with 2-mercaptoethanol (1 in 10) for 5–20’ at 95°C, normalised concentrations of protein were separated by 10% SDS-polyacrylamide gel electrophoresis using Bio-Rad MINI Protean precast gels (Bio-Rad); proteins were transferred to nitrocellulose membrane and probed with antibodies against phospho-SMAD1/5/8 (Cell Signaling, D5B10), SMAD1 (Cell Signaling, D59D7), phospho-STAT1(pY701) (Cell Signaling, D4A7), STAT1 (Cell Signaling, 42H3), MDA5 (IFIH1) (Clone 17, as described in Hertzog et al13), GAPDH (Proteintech, 60004–1-Ig), or Actin-HRP (AC-15, #A3854), and where required HRP-conjugated species-specific secondary antibodies; proteins were detected by chemiluminescence with Western Lightning Plus-ECL (Perkin Elmer).
SNP analysis and BMP pathway enrichment tests
To investigate the significance of BMP-pathway genes associated with GWA intervals, we determined 66 independent GWA-defined intervals from the top 100 SNPs associated with differential clearance of HCV in response to antiviral therapy11, derived by: (i) taking the most distant pair of SNPs in linkage disequilibrium (r2 > 0.5) with the lead SNP among the haplotypes of the 1000 Genomes Project Caucasian individuals (http://faculty.washington.edu/browning/beagle/beagle.html), (ii) enlarging the region by 250 kb on either side to reflect elements acting at a distance (iii) and by merging any overlapping intervals. In each of two complementary approaches to determining gene set enrichment, we tested for an enrichment in term of BMP pathway genes 1) Randomising the gene set of interest: We compared the number of BMP pathway genes that lay within GWA intervals to 10e6 randomly generated gene-sets matched in both gene number and gene size (random gene-sets approach). (2) Randomising the genomic intervals: We compared the number of BMP pathway genes falling in GWA intervals to the number found after randomly shifting of GWA intervals 10e6 times while holding for the number of interval-overlapped genes (shifting-GWA intervals approach). The two approaches are complementary and account for potential confounds such linkage disequilibrium structure or localised functional clustering.
Code availability
The code used to analyse the GWAS data (for figure 1g) is available here: http://wwwfgu.anat.ox.ac.uk/downloads/compbio_projects/CW001_SANDOR_BMP/
Analysis of ChIPseq data
Previously described ChIP-seq datasets were obtained as FASTQ files from the NCBI GEO repository (Series 29196 and Series 31477)14,15. Adaptor sequences were removed using Trim Galore (Babraham Institute, University of Cambridge). Reads were aligned to the human genome build GRCh37 (UCSC hg19/Feb 2009) with Bowtie2 (v2.2.6)16. Transcription factor binding profiles were converted to Bed Graph files and visualized in the UCSC genome browser accompanied by epigenetic modification tracks defined by the ENCODE project14,17.
For GSE analysis (Supplementary Figure 6), transcription factor binding peaks were identified using the find Peaks program in the HOMER suite of NGS analysis tools (http://homer.ucsd.edu/homer/ngs/), in accordance with the default parameters and normalized to 10 million total reads per dataset18. Transcription factor-bound loci were associated with their putative cis-regulated target genes using GREAT (v2.02), an online tool permitting both genome annotation and GSE analysis with reference to multiple ontology databases organized by phenotype, disease and regulatory motifs19. GREAT calculates the statistical significance of each ontological category within the transcription factor-bound loci with respect to the whole genome. Only ontological categories comprising 10–150 terms inclusive were included in final analyses, to exclude broad, generic pathways and small gene sets liable to be enriched as artefacts of the sampling process.
Venn diagrams (Figure 2a,b) were constructed with the VennDiagram [Hanbo Chen (2015). VennDiagram: Generate High-Resolution Venn and Euler Plots. R package version 1.6.16. https://CRAN.R-project.org/package=VennDiagram] package in R version 3.2.3 (2015–10–12) [R Development Core Team (2008). R: A language and environment for statistical computing. R Foundation for Statistical Computing, Vienna, Austria. ISBN 3–900051–07–0, URL http://www.R-project.org.]. The annotation of multiple peaks to a single gene within each peak set was disregarded for the purpose of this comparison: each unique gene is enumerated in each group once, irrespective of the number of distinct ChIP-seq peaks with which it may be associated. For comparison of transcription factor binding profiles relative to loci enriched for IRF1 binding in IFN alpha-treated K562 (2c–e), transcription factor peaks were called with the HOMER find Peaks tool, with each peak defined by 10-fold greater read alignment in the target experiment versus input control and all datasets normalized to 10 million total reads. Histograms of transcription factor-binding density were constructed using the annotatePeaks.pl function in HOMER18. The analysis procedure is divided into three stages. Firstly, one of the peak-sets is selected to act as the ‘reference peak-set’. Second, the alignment positions of reads from a second ‘comparator’ dataset are compared to the centres of the peaks in the reference peak-set. Third, the average densities of the reads in the comparator dataset that align +/− 500 bp about the centre of the reference peaks are binned into 50 bp intervals. Finally, these data are represented as histograms, with ‘ChIP fragment depth’, an index of read density, plotted against their position relative to the centres of the reference peaks.
To test this approach, we compared genome-wide binding of RNA Pol II and RNA Pol III in unstimulated K562 cells against the BMP4-SMAD1 and IFNa-IRF1 peak-sets. RNA Pol II is required for transcription of mRNA precursors, mi RNA and snoRNA, whereas RNA Pol III synthesizes 5S RNA, tRNA and various small RNAs including spliceosome components and ribozyme. Accordingly, we hypothesized that RNA Pol II binding would be enriched proximal to the peak centres across all of the peak sets, being a necessary constituent of the transcriptional machinery. In contrast, RNA Pol III targets are minimally IFN or BMP-inducible, to the best of our knowledge. As such, we would not anticipate evidence of RNA Pol III binding around the centres of the peaks from all of our datasets. The figure below shows that as expected, while RNA Pol II binding in un stimulated K562 cells mirrors that of both SMAD1 in BMP4-treated cells (i) and IRF1 after IFNα stimulation (ii), enrichment for RNA Pol III binding is undetectable near the centre of both BMP4-SMAD1 and IFN-IRF1 peak-sets. Therefore, we then went on to use this approach to interrogate the frequency with which a ‘comparator’ transcription factor binds in the vicinity of a ‘reference’ transcription factor across the whole genome (see main text and Figure 2c–e).
Electromobility shift assays
Electrophoretic mobility shift assays (EMSAs) were carried out in 10 μL reactions whereby 500 nM IRF1 (NBC-18471, Bio-Techne) or SMAD4 (ab81764, Abcam) was serially diluted two-fold and incubated with 0.5 nM of the indicated 25 base pair DNA probe at 37°C for ten minutes. Reaction conditions contained 20 mM HEPES, pH 7.5, 50 mM KCl, 0.5 mM DTT, 0.05% Triton-X, 0.1 mg/mL BSA, 5% glycerol, 50 mM L-arginine-hydrochloride; and 0.01 μg poly(dI:dC) was added for reactions with SMAD4. DNA binding was analysed by 6% (for SMAD4) or 8% (for IRF1) native PAGE in 0.5 × TBE at 100 V for 3 hours, at 4°C. Gels were dried under vacuum for 2 hours at 80°C before being exposed to a Kodak phosphorimager screen and scanned using a Typhoon 9400 instrument (GE).
For 5’[32P] radiolabelling of DNA probes, 10 pmol of single-stranded DNA (Euro fins MWG Operon, Germany) was incubated with 6.8 pmoles γ−32P-dATP (Perkin Elmer), and 10 U T4 PNK (Thermo Fisher Scientific) at 37°C for 1 hour. This solution was passed through a P6 Micro Bio-Spin chromatography column (Bio Rad), and the radiolabelled DNA was annealed with the appropriate unlabelled oligonucleotide (see below for probe sequences) in a 1:2 molar ratio by heating to 95°C and cooling to room temperature in annealing buffer (10 mM Tris-HCl; pH 7.5, 100 mM NaCl, 0.1 mM EDTA).
Probes: Consensus BRE was from the HAMP promoter20:
HAMP-BRE-25-F:5’TCTCCCGCCTTTTCGGCGCCACCAC
HAMP-BRE-25-R:5’GTGGTGGCGCCGAAAAGGCGGGAGA
Consensus ISRE was from the IFI6 promoter21,22:
IFI6-ISRE-25-F:5’GAGAGGGGAAAATGAAACTGCAGAG
IFI6-ISRE-25-R:5’CTCTGCAGTTTCATTTTCCCCTCTC
Hepatitis C viral infection
The Jc1 HCV strain was produced as described previously23. Briefly, HuH7.5 cells were transfected with Jc1 RNA by electroporation and supernatants harvested 14–20 days post transfection. HuH7.5 cells were infected at a multiplicity of infection (MOI) of 0.02 unless otherwise stated. Infection was allowed to proceed for 9–11 days at which point infection was greater than 90% as determined by immunofluorescence23 before treatments were applied, except in the case of antiviral experiments, described below.
Antiviral experiments (HCV)
5 day time course: cells infected as described above with Jc1 at a MOI of 0.02 for 2 h were plated and then immediately treated with a titration of BMP6 (2–52nM) for the duration of the infection. Aliquots of supernatant were collected at the time points indicated. 10 day time course: cells infected for 2h were plated and incubated for 3 days. Cells were then sub-cultured and BMP6 added at 18nM. Additional doses of the same concentration were applied at further sub-culturing to maintain the dose. For both time courses, IFN-alpha (PBL Biomedical Laboratories) was added at 1000U/mL 1 day prior to the termination of the experiment. Supernatant RNA extraction was performed using QIAamp viral RNA extraction kit and total cellular RNA was extracted using RNeasy kit (both Qiagen). cDNA was then transcribed using the Superscript III Reverse transcriptase (Invitrogen), all according to the manufacturers’ protocols. HCV RNA levels were measured using qRT-PCR in a Light Cycler 480 Real-Time PCR System (Roche). cDNA at 10–100ng/uL was amplified using RC1 (5’ GTC TAG CCA TGG CGT TAG TA 3’) and RC21 (5’ CTC CCG GGG CAC TCG CAA GC 3’) primers. Each reaction was run in duplicate. HCV RNA levels were quantified using a standard curve derived from HCV Jc1 cDNA.
HCV Core staining: Huh 7.5.1 hepatoma cells (a gift from F. Chisari) were plated at 4,000 cells per well in 96 well plates and incubated overnight. The next day, cells were treated with BMP6 18nM dissolved in filter sterilised 1% BSA 4mM HCl (vehicle), IFNa 12.5IU/ml (obtained from PBL), BMP6 18nM plus IFNa (12.5IU/ml), vehicle, or untreated. After 24 hours, 25ul of JFH1 stock was added on top of the medium in all wells, yielding a final MOI of 1. Cells were incubated at 37 degrees. 4 hours later, medium containing inoculum was removed, and medium / drug were replaced in the same concentration as that used initially, in a well-by-well manner. Cells were then incubated for 48h at 37 degrees. Cells were then fixed in 4% PFA (Sigma), then permeabilized in 0.2% Triton, then incubated overnight with anti-core antibody at 4°C. Cells were then stained with goat anti mouse Alexa 488 secondary antibody (Invitrogen) for 1 hour, followed by incubation in Hoechst. Cells were imaged using FITC and DAPI and images captured using an IXM2 automated microscope at the Harvard Longwood ICCB, and analyzed using Meta Xpress cell scoring software (Molecular Devices 9500–0037).
OR6 experiments: Reagents were added to OR6 cells or their IFN-cured counterparts at the doses and for the time specified in figure legends before being assayed using the Renilla Luciferase Assay System or Renilla-Glo Luciferase Assay (both Promega). Values were background subtracted (background: cured cells) and then normalised to the relevant untreated control. To monitor cell numbers in the OR6 experiments the CellTiter Glo Luminescent Cell Viability Assay (Promega) was used.
Antiviral experiments (HBV)
HepaRG cells (Thermo Fisher), a HCV-negative hepatoma-derived line exhibiting both hepatocellular and biliary morphologies in vitro, were plated in collagen-coated 24-well plates at a density of 5×10⁴cells/well. Cells were allowed to grow in medium for two weeks, before addition of differentiation medium containing 2% (v/v) DMSO and EGF. Cells were cultured for a further two weeks, before infection with a fixed inoculum of HBV [1.5–2.0 × 10⁶ genome equivalents per well; corresponding to approximately 10 genome equivalents per cell]. HBV particles were produced and harvested from HepG2 (clone 2.2.15) hepatoblastoma cells as described24. Infection continued for 17–20 h at 37 °C, in the presence of 4% (v/v) PEG 8000. Following infection, cells were washed in medium and cultured for seven days in the presence of 2% (v/v) DMSO, 5 μg/mL insulin and 50 mM hydrocortisone. Cells were concurrently incubated with 25 μM lamivudine (Sigma Aldrich), 100 U/mL IFNα (Peprotech), BMP6 or activin A (both R&D Systems) at specified doses. At day 7 post-infection, culture supernatants were harvested and assayed for the presence of HBs Ag with the MONOLISA™ Ultra HBs Ag kit [catalogue I.D. 74326] (Bio Rad, Hercules, CA), in accordance with the manufacturer’s instructions.
Antiviral experiments (ZIKV)
A549 cells (ATCC and University Hospital Heidelberg) were seeded in a 24-well format at approx. 1.0×10⁵ cells per well and incubated overnight. Cells were then pre-treated for 16 hours with the indicated concentrations of IFN-alpha and/or Activin A, then washed and subsequently inoculated with ZIKV (H/PF/2013 strain) with an MOI of 1 for 2 hours, the media was then replaced and the cells were incubated for 24 hours total, with fresh IFN alpha and/or Activin A also added. Supernatant containing ZIKV was harvested and stored at −80°C. VeroE6 cells (ATCC) were seeded in a 24-well format at approx. 2.5×10⁵ cells per well and incubated overnight. 6 Serial dilutions (5x dilutions) of supernatant containing ZIKV were prepared per treatment condition and 200 μl of each dilution for each treatment was added onto the VeroE6 cells (in duplicate) and incubated for 60 min before removal of the inoculum, and a car boxy methylcellulose overlay was added. VeroE6 cells were then incubated for 96 hours. The overlay was removed and cells were fixed with 10% PFA solution, washed, and finally stained with crystal violet solution for plaque visualization. A549 and VeroE6 cells were maintained in DMEM supplemented with 10% fetal bovine serum (FBS) 100 U/mL penicillin, 100 μg/mL streptomycin, 2 mM L-glutamine, and 1% non-essential amino acids (all from Gibco, Life Technologies), and incubated at 37°C, 5.0% CO2, and 90% humidity, unless stated otherwise.
Gene Expression Microarray
The whole gene expression profile of HuH7.5 cells treated with 18nM BMP6 for 24 hours was compared to that of cells treated with vehicle (n= 2 independent experiments, each run in triplicate giving a total of 6 RNA extracts per condition) utilising Illumina’s Human HT12v4.0 Expression BeadChip. Total mRNA was isolated using RNeasy mini kits then converted into labelled cRNA and used for hybri disation. The hybridised and washed chips were then scanned using Illumina HiScan Scanner. Illumina’s Genome studio ®software was used to carry out QC checks of the procedure and to provide final reports. The microarray was performed in collaboration with the High-Throughput Genomics Group at the Wellcome Trust Centre for Human Genetics, University of Oxford (funded by Wellcome Trust grant reference 090532/Z/09/Z and MRC Hub grant G0900747 91070) and the analysis carried out using the R statistical language with Bioconductor and the Linear Models for Microarray (LIMMA) data package in collaboration with the Computational Biology Research Group, University of Oxford.
Using an adjusted P-value cut off of P-value<0.001 (adjusted for multiple testing with Benjamini and Hochberg’s method) to determine significant differentially expressed genes, we obtained a list of 2275 transcripts, including several known direct targets of BMP signaling such as ID3, ID1 and HAMP. This list of transcripts was analysed using Gene GO Meta Core (Thomson Reuters; version 6.10 build 31731) yielding 2149 network objects, which were then analysed using the “Functional Ontology Enrichment Pathway Map”, with FDR set at 0.05. This analysis revealed that Type I IFN signaling pathway (P-value =10e-4) was statistically significantly altered after 24h BMP6 treatment (Supplementary Figures 2, 4). For reference the BMP signaling pathway was also statistically significantly altered (P-value = 10e-4).
BrdU/PI analysis of cell cycle phase distribution
Incorporation of the brominated nucleoside analogue 5’-bromo-2’-deoxyuridine (BrdU) during a pulsed exposure provides an index of DNA replication rates, whereas propidium iodide (PI) intercalates into DNA duplexes, allowing quantification of total cellular DNA. Flow cytometric analysis of immune stained BrdU and PI fluorescence yields a “horseshoe” distribution. Cells in G0/G1 are associated with both minimal BrdU incorporation and 1N quantity of DNA; as S-phase proceeds increasing quantities of BrdU are incorporated and PI signal also increases; cells in G2/M are characterized by 2N DNA content and low BrdU signal. Huh7 cells were seeded at 7×10⁴ cells/well in a 6-well plate. 24 h after seeding, cells were washed with PBS and replenished with DMEM10 (untreated cells), 100 nM UCN-01 Sigma-Aldrich, USA), or 18nM recombinant human BMP6 (R&D Systems, MN, USA) in duplicate wells per condition. UCN-01 was first identified as protein kinase C inhibitor secreted by Streptomyces; it elicits cell cycle arrest in multiple cell lines via both inhibition of Rb phosphorylation and transcriptional induction of the cyclin-CDK inhibitor p21 and related Cip/Kip proteins25–27.
After 48 h incubation, cells were “pulsed” for 30 minutes by addition of the synthetic thymidine analogue BrdU to a final molarity of 10 μM. Cells were detached with 10mM EDTA in PBS, duplicate wells pooled and the cells pelleted by centrifugation at 1400 rpm for 5 min. After fixation with 70% EtOH at 4 °C for 30min and centrifugation at 1500 rpm for 10 min, cells were subjected to acid denaturation by dropwise addition of 2N HCl+0.5% Triton X-100 followed by a 30 min incubation at room temperature. Cells were spun down in a minifuge at 2400 rpm for 10 min. Acidic pH was neutralized by addition of 0.1 M Na2B4O7 and the cells spun down again at 2400 rpm for 10 min, after which the supernatant was aspirated and the cells resus pended in 1mL 0.5% Tween20/1% BSA in PBS. Samples were then divided into two 500 μL aliquots, designated “test” and “control”. Test samples were incubated with rat anti-BrdU monoclonal antibody (cat. number ab6326; Abcam, Cambridge, UK) at 40 μg/mL for 30 min at room temperature whereas control samples were exposed to the antibody diluent (0.5% Tween20/1% BSA) only. After centrifugation at 2400 rpm for 10 min, both test and control cells were incubated with 5μg/mL goat anti-rat AlexaFluor-488 conjugated polyclonal antibody (cat. Number ab150157) for 30 min, in the dark. Immediately before data acquisition, all cells were spun down at 2400 rpm for 10 minutes and resuspended in 100 μM PI in PBS for 15 min at room temperature. Data were acquired with a Dako CyAn ADP flow cytometer and analysed with FlowJo v10 (TreeStar Inc. OR, USA).
Data analysis, statistics and reproducibility
Data was analysed using Microsoft Excel (Microsoft Inc.) Graphpad Prism (Graphpad Software Inc.) and FlowJo (Treestar Inc.). Statistical analysis and graphical presentation of data was performed using Graphpad Prism. The statistical tests used are stated in figure legends; P<0.05 was considered significant. Where data sets were matched, paired and repeated measures tests were used and where data did not fit a Gaussian distribution, equivalent non-parametric tests were used, or data were log-transformed for normalisation. Bonferroni post-tests were used to further analyse ANOVAs unless otherwise stated.
Data availability
The data that support the findings of this study are available from the corresponding author upon request. The microarray of gene expression profile of HuH7.5 cells treated with 18nM BMP6 for 24 hours is available at the Gene Expression Omnibus under accession number GSE121073.
Supplementary Material
Acknowledgements
We thank the MRC UK (Grant ID 92044), the Wellcome Trust (WT091663MA and 109965MA), NIHR Biomedical Research Centre, Oxford, the Oxford Martin School, the NIH (NIAID U19AI082630, NIDDK R01DK087727, RO1DK-069533 and RO1DK-071837), the Beit Memorial Trust for Medical Research, CORE, EU Fund to the University of Zagreb School of Medicine (Grant KK01.1.1.01.0008) and the GI Research Fund of Dublin, Ireland for funding. We thank Alain Townsend and Lonnie Swift for useful discussions and technical guidance.
Footnotes
Competing Interests
None of the authors declare any relevant competing interests.
References
- 1.Ganz T Systemic iron homeostasis. Physiol Rev 93, 1721–1741, doi: 10.1152/physrev.00008.2013 (2013). [DOI] [PubMed] [Google Scholar]
- 2.Drakesmith H & Prentice AM Hepcidin and the iron-infection axis. Science 338, 768–772, doi: 10.1126/science.1224577 (2012). [DOI] [PubMed] [Google Scholar]
- 3.Fujita N et al. Hepcidin expression in the liver: relatively low level in patients with chronic hepatitis C. Mol Med 13, 97–104 (2007). [DOI] [PMC free article] [PubMed] [Google Scholar]
- 4.Girelli D et al. Reduced serum hepcidin levels in patients with chronic hepatitis C. J Hepatol 51, 845–852 (2009). [DOI] [PMC free article] [PubMed] [Google Scholar]
- 5.Muckenthaler MU, Rivella S, Hentze MW & Galy B A Red Carpet for Iron Metabolism. Cell 168, 344–361, doi: 10.1016/j.cell.2016.12.034 (2017). [DOI] [PMC free article] [PubMed] [Google Scholar]
- 6.Babitt JL et al. Bone morphogenetic protein signaling by hemojuvelin regulates hepcidin expression. Nat Genet 38, 531–539 (2006). [DOI] [PubMed] [Google Scholar]
- 7.Ryan JD, Ryan E, Fabre A, Lawless MW & Crowe J Defective bone morphogenic protein signaling underlies hepcidin deficiency in HFE hereditary hemochromatosis. Hepatology 52, 1266–1273, doi: 10.1002/hep.23814 (2010). [DOI] [PubMed] [Google Scholar]
- 8.Caldwell RL, Gadipatti R, Lane KB & Shepherd VL HIV-1 TAT represses transcription of the bone morphogenic protein receptor-2 in U937 monocytic cells. J Leukoc Biol 79, 192–201, doi: 10.1189/jlb.0405194 (2006). [DOI] [PubMed] [Google Scholar]
- 9.Durrington HJ et al. Identification of a lysosomal pathway regulating degradation of the bone morphogenetic protein receptor type II. J Biol Chem 285, 37641–37649, doi: 10.1074/jbc.M110.132415 (2010). [DOI] [PMC free article] [PubMed] [Google Scholar]
- 10.Olsavszky V et al. GATA4 and LMO3 balance angiocrine signaling and autocrine inflammatory activation by BMP2 in liver sinusoidal endothelial cells. Gene 627, 491–499, doi: 10.1016/j.gene.2017.06.051 (2017). [DOI] [PubMed] [Google Scholar]
- 11.Woodhouse SD et al. Transcriptome sequencing, microarray, and proteomic analyses reveal cellular and metabolic impact of hepatitis C virus infection in vitro. Hepatology 52, 443–453, doi: 10.1002/hep.23733 (2010). [DOI] [PMC free article] [PubMed] [Google Scholar]
- 12.Wu Q, Sun CC, Lin HY & Babitt JL Repulsive guidance molecule (RGM) family proteins exhibit differential binding kinetics for bone morphogenetic proteins (BMPs). PloS one 7, e46307, doi: 10.1371/journal.pone.0046307 (2012). [DOI] [PMC free article] [PubMed] [Google Scholar]
- 13.Stacey AR et al. Induction of a striking systemic cytokine cascade prior to peak viremia in acute human immunodeficiency virus type 1 infection, in contrast to more modest and delayed responses in acute hepatitis B and C virus infections. J Virol 83, 3719–3733, doi: 10.1128/JVI.01844-08 (2009). [DOI] [PMC free article] [PubMed] [Google Scholar]
- 14.Ge D et al. Genetic variation in IL28B predicts hepatitis C treatment-induced viral clearance. Nature 461, 399–401 (2009). [DOI] [PubMed] [Google Scholar]
- 15.Alliston T et al. Repression of bone morphogenetic protein and activin-inducible transcription by Evi-1. The Journal of biological chemistry 280, 24227–24237, doi: 10.1074/jbc.M414305200 (2005). [DOI] [PubMed] [Google Scholar]
- 16.Kawamura I et al. SnoN Suppresses Maturation of Chondrocytes by Mediating Signal Cross-talk between Transforming Growth Factor-beta and Bone Morphogenetic Protein Pathways. The Journal of biological chemistry 287, 29101–29113, doi: 10.1074/jbc.M112.349415 (2012). [DOI] [PMC free article] [PubMed] [Google Scholar]
- 17.Steinbicker AU et al. Perturbation of hepcidin expression by BMP type I receptor deletion induces iron overload in mice. Blood 118, 4224–4230, doi: 10.1182/blood-2011-03-339952 (2011). [DOI] [PMC free article] [PubMed] [Google Scholar]
- 18.Gutterman JU Cytokine therapeutics: lessons from interferon alpha. Proc Natl Acad Sci U S A 91, 1198–1205 (1994). [DOI] [PMC free article] [PubMed] [Google Scholar]
- 19.Denard B et al. The membrane-bound transcription factor CREB3L1 is activated in response to virus infection to inhibit proliferation of virus-infected cells. Cell Host Microbe 10, 65–74, doi: 10.1016/j.chom.2011.06.006 (2011). [DOI] [PMC free article] [PubMed] [Google Scholar]
- 20.Ikeda M et al. Efficient replication of a full-length hepatitis C virus genome, strain O, in cell culture, and development of a luciferase reporter system. Biochemical and biophysical research communications 329, 1350–1359, doi: 10.1016/j.bbrc.2005.02.138 (2005). [DOI] [PubMed] [Google Scholar]
- 21.Schoggins JW et al. A diverse range of gene products are effectors of the type I interferon antiviral response. Nature 472, 481–485, doi: 10.1038/nature09907 (2011). [DOI] [PMC free article] [PubMed] [Google Scholar]
- 22.Trompouki E et al. Lineage regulators direct BMP and Wnt pathways to cell-specific programs during differentiation and regeneration. Cell 147, 577–589, doi: 10.1016/j.cell.2011.09.044 (2011). [DOI] [PMC free article] [PubMed] [Google Scholar]
- 23.Rosenbloom KR et al. ENCODE data in the UCSC Genome Browser: year 5 update. Nucleic Acids Res 41, D56–63, doi: 10.1093/nar/gks1172 (2013). [DOI] [PMC free article] [PubMed] [Google Scholar]
- 24.Cuny GD et al. Structure-activity relationship study of bone morphogenetic protein (BMP) signaling inhibitors. Bioorg Med Chem Lett 18, 4388–4392, doi: 10.1016/j.bmcl.2008.06.052 (2008). [DOI] [PMC free article] [PubMed] [Google Scholar]
- 25.Malakhova OA et al. UBP43 is a novel regulator of interferon signaling independent of its ISG15 isopeptidase activity. Embo J 25, 2358–2367, doi: 10.1038/sj.emboj.7601149 (2006). [DOI] [PMC free article] [PubMed] [Google Scholar]
- 26.Zhang X et al. Human intracellular ISG15 prevents interferon-alpha/beta over-amplification and auto-inflammation. Nature 517, 89–93, doi: 10.1038/nature13801 (2015). [DOI] [PMC free article] [PubMed] [Google Scholar]
- 27.Lin Q et al. Enantioselective synthesis of Janus kinase inhibitor INCB018424 via an organocatalytic aza-Michael reaction. Org Lett 11, 1999–2002, doi: 10.1021/ol900350k (2009). [DOI] [PubMed] [Google Scholar]
- 28.Francois-Newton V, Livingstone M, Payelle-Brogard B, Uze G & Pellegrini S USP18 establishes the transcriptional and anti-proliferative interferon alpha/beta differential. The Biochemical journal 446, 509–516, doi: 10.1042/BJ20120541 (2012). [DOI] [PubMed] [Google Scholar]
- 29.Metz P et al. Identification of type I and type II interferon-induced effectors controlling hepatitis C virus replication. Hepatology, doi: 10.1002/hep.25908 (2012). [DOI] [PubMed] [Google Scholar]
- 30.Cao X et al. MDA5 plays a critical role in interferon response during hepatitis C virus infection. J Hepatol 62, 771–778, doi: 10.1016/j.jhep.2014.11.007 (2015). [DOI] [PubMed] [Google Scholar]
- 31.Clark K, Plater L, Peggie M & Cohen P Use of the pharmacological inhibitor BX795 to study the regulation and physiological roles of TBK1 and IkappaB kinase epsilon: a distinct upstream kinase mediates Ser-172 phosphorylation and activation. J Biol Chem 284, 14136–14146, doi: 10.1074/jbc.M109.000414 (2009). [DOI] [PMC free article] [PubMed] [Google Scholar]
- 32.Sakamoto N et al. Bone morphogenetic protein-7 and interferon-alpha synergistically suppress hepatitis C virus replicon. Biochem Biophys Res Commun 357, 467–473 (2007). [DOI] [PubMed] [Google Scholar]
- 33.Besson-Fournier C et al. Induction of activin B by inflammatory stimuli up-regulates expression of the iron-regulatory peptide hepcidin through Smad1/5/8 signaling. Blood 120, 431–439, doi: 10.1182/blood-2012-02-411470 (2012). [DOI] [PubMed] [Google Scholar]
- 34.Spottiswoode N et al. Role of Activins in Hepcidin Regulation during Malaria. Infection and immunity 85, doi: 10.1128/IAI.00191-17 (2017). [DOI] [PMC free article] [PubMed] [Google Scholar]
- 35.Fletcher SP et al. Identification of an intrahepatic transcriptional signature associated with self-limiting infection in the woodchuck model of hepatitis B. Hepatology 57, 13–22, doi: 10.1002/hep.25954 (2013). [DOI] [PMC free article] [PubMed] [Google Scholar]
- 36.Kim JH, Luo JK & Zhang DE The level of hepatitis B virus replication is not affected by protein ISG15 modification but is reduced by inhibition of UBP43 (USP18) expression. J Immunol 181, 6467–6472 (2008). [DOI] [PubMed] [Google Scholar]
- 37.Mao R et al. Inhibition of hepatitis B virus replication by the host zinc finger antiviral protein. PLoS Pathog 9, e1003494, doi: 10.1371/journal.ppat.1003494 (2013). [DOI] [PMC free article] [PubMed] [Google Scholar]
- 38.Fillebeen C et al. Iron inactivates the RNA polymerase NS5B and suppresses subgenomic replication of hepatitis C Virus. J Biol Chem 280, 9049–9057 (2005). [DOI] [PubMed] [Google Scholar]
- 39.Theurl I et al. Iron regulates hepatitis C virus translation via stimulation of expression of translation initiation factor 3. J Infect Dis 190, 819–825 (2004). [DOI] [PubMed] [Google Scholar]
- 40.Liu H et al. Iron regulator hepcidin exhibits antiviral activity against hepatitis C virus. PLoS One 7, e46631, doi: 10.1371/journal.pone.0046631 (2012). [DOI] [PMC free article] [PubMed] [Google Scholar]
- 41.Tai AW et al. A functional genomic screen identifies cellular cofactors of hepatitis C virus replication. Cell Host Microbe 5, 298–307 (2009). [DOI] [PMC free article] [PubMed] [Google Scholar]
- 42.MacParland SA et al. Lipopolysaccharide and Tumor Necrosis Factor Alpha Inhibit Interferon Signaling in Hepatocytes by Increasing Ubiquitin-Like Protease 18 (USP18) Expression. J Virol 90, 5549–5560, doi: 10.1128/JVI.02557-15 (2016). [DOI] [PMC free article] [PubMed] [Google Scholar]
- 43.Liu SY, Sanchez DJ, Aliyari R, Lu S & Cheng G Systematic identification of type I and type II interferon-induced antiviral factors. Proceedings of the National Academy of Sciences of the United States of America 109, 4239–4244, doi: 10.1073/pnas.1114981109 (2012). [DOI] [PMC free article] [PubMed] [Google Scholar]
- 44.Carlin AF et al. An IRF-3-, IRF-5-, and IRF-7-Independent Pathway of Dengue Viral Resistance Utilizes IRF-1 to Stimulate Type I and II Interferon Responses. Cell reports 21, 1600–1612, doi: 10.1016/j.celrep.2017.10.054 (2017). [DOI] [PMC free article] [PubMed] [Google Scholar]
- 45.Chen L et al. Hepatic gene expression discriminates responders and nonresponders in treatment of chronic hepatitis C viral infection. Gastroenterology 128, 1437–1444 (2005). [DOI] [PubMed] [Google Scholar]
- 46.Randall G et al. Silencing of USP18 potentiates the antiviral activity of interferon against hepatitis C virus infection. Gastroenterology 131, 1584–1591, doi: 10.1053/j.gastro.2006.08.043 (2006). [DOI] [PubMed] [Google Scholar]
- 47.Eroshkin A & Mushegian A Conserved transactivation domain shared by interferon regulatory factors and Smad morphogens. J Mol Med (Berl) 77, 403–405 (1999). [DOI] [PubMed] [Google Scholar]
- 48.Xu P et al. Innate antiviral host defense attenuates TGF-beta function through IRF3-mediated suppression of Smad signaling. Mol Cell 56, 723–737, doi: 10.1016/j.molcel.2014.11.027 (2014). [DOI] [PMC free article] [PubMed] [Google Scholar]
Associated Data
This section collects any data citations, data availability statements, or supplementary materials included in this article.
Supplementary Materials
Data Availability Statement
The data that support the findings of this study are available from the corresponding author upon request. The microarray of gene expression profile of HuH7.5 cells treated with 18nM BMP6 for 24 hours is available at the Gene Expression Omnibus under accession number GSE121073.