

SUMMARY
Neuronal diversification is a fundamental step in the construction of functional neural circuits, but how neurons generated from single progenitor domains acquire diverse subtype identities remains poorly understood. Here we developed an embryonic stem cell (ESC)-based system to model subtype diversification of V1 interneurons, a class of spinal neurons comprising four clades collectively containing dozens of molecularly distinct neuronal subtypes. We demonstrate that V1 subtype diversity can be modified by extrinsic signals. Inhibition of Notch and activation of retinoid signaling results in a switch to MafA clade identity and enriches differentiation of Renshaw cells, a specialized MafA subtype that mediates recurrent inhibition of spinal motor neurons. We show that Renshaw cells are intrinsically programmed to migrate to species-specific laminae upon transplantation and to form subtype-specific synapses with motor neurons. Our results demonstrate that stem cell-derived neuronal subtypes can be used to investigate mechanisms underlying neuronal subtype specification and circuit assembly.
In Brief
Hoang et al. performed directed differentiation of mouse embryonic stem cells into spinal V1 interneurons involved in sensory-motor control. They show that stem cell-derived neurons acquire subtype-specific identity and function, including the ability to form cell type-specific synaptic connections in vitro.
INTRODUCTION
Assembly of neural circuits, a fundamental process in the construction of a functioning nervous system, depends on the diversification of developing neurons into highly specialized subtypes with stereotyped connectivity and function. Multiple developmental processes contribute to the program of neuronal subtype specification, beginning with stratification of the neuroepithelium into discrete progenitor domains, followed by progenitor diversification into distinct subtypes characterized by cell type-specific patterns of gene expression, function, and synaptic connectivity. Considerable progress has been made toward understanding the signaling molecules and transcription factors (TFs) that pattern the neuroepithelium into different progenitor domains (Hébert and Fishell, 2008; Hoch et al., 2009; Jessell, 2000), but the mechanisms contributing to diversification of cells into distinct neuronal subtypes are less well understood.
The spinal cord represents an appealing system in which to explore this question. Specification of spinal neuronal identity is controlled by a coordinated interplay of signaling molecules, chief among them retinoic acid (RA) produced by the paraxial mesoderm and gradients of transforming growth factor β (TGF-β) and sonic hedgehog (Shh) emanating from the roof and floor plates, respectively (Briscoe and Ericson, 2001; Jessell, 2000). These signaling systems divide the developing neural tube into 13 progenitor domains, each giving rise to a cardinal class of neurons–motor neurons (MNs), as well as multiple classes of interneurons (INs) that act to fine-tune sensorimotor circuits (Goulding, 2009; Jessell, 2000).
Recent lineage tracing experiments revealed that inhibitory ventral V1 INs arising from the pi progenitor domain exhibit considerable molecular diversity (Bikoff et al., 2016; Gabitto et al., 2016; Sweeney et al., 2018). It is estimated that nearly 50 V1 IN subtypes can be identified in the developing spinal cord based on combinatorial expression of 19 TFs. These V1 IN subtypes can be segregated into four non-overlapping clades with characteristic transcriptional profiles, settling position in the spinal cord, physiological differences, and synaptic connectivity (Bikoff et al., 2016; Gabitto et al., 2016). It remains to be determined whether individual clades emerge from shared or distinct p1 progenitors and whether their diversification is controlled by intrinsic or extrinsic signaling mechanisms.
Arguably, the best characterized V1 IN subtype are Renshaw cells (RCs), which receive excitatory inputs from MN axon collaterals and, in turn, inhibit MNs, forming a recurrent inhibitory circuit that powerfully suppresses MN firing (Bhumbra et al., 2014; Moore et al., 2015). Although other V1 INs are known to provide inhibitory synaptic inputs onto MNs, RCs are the only known inhibitory IN cell type in the spinal cord to receive inputs from MN collaterals (Alvarez et al., 2013; Alvarez and Fyffe, 2007; Eccles et al., 1954; Renshaw, 1946). Despite over half a century elapsing since the original description of the RC-MN circuit, the mechanisms controlling the formation of such a precise and highly selective synapse remain obscure.
We took advantage of directed differentiation of mouse embryonic stem cells (mESCs) to explore the mechanisms controlling V1 IN diversification and acquisition of subtype-specific properties, including formation of specific and functional synaptic contacts (Wichterle et al., 2002). We demonstrate that the Notch and retinoid signaling pathways control V1 clade specification and generation of RCs in particular. Through a series of transplantation, trans-synaptic rabies virus tracing, optogenetics, and whole-cell patch-clamp electrophysiology studies, we find that embryonic stem cell (ESC)-derived MNs and RCs engage in interactions typical for recurrent inhibitory circuits. Therefore, this simplified in vitro model represents an experimentally accessible system to study the acquisition of IN subtype identity and connectivity.
RESULTS
Directed Differentiation of V1 Interneurons from Mouse ESCs
To explore the subtype diversification of spinal V1 INs, we employed directed differentiation of mouse ESCs. Nascent V1 Ins transiently express the TF Engrailed-1 (En1) as they migrate to their final position in the ventral horn of the developing spinal cord (Sapir et al., 2004). We derived V1 IN reporter ESC lines from En1Cre mice crossed to ROSA26Lox-STOP-Lox-tdTomato or En1Cre × ROSA26Lox-STOP-Lox-eGFP mice (Kimmel et al., 2000; Madisen et al., 2010; Sapir et al., 2004), hereafter referred to as En1-tdTomato or En1-GFP ESCs. We anticipated that efficient specification of V1 INs would depend on high levels of RA to activate the V1 progenitor patterning genes Pax6, Irx3, and Dbx2 (Novitch et al., 2003; Pierani et al., 2001) and low levels of smoothened agonist (SAG), a downstream effector of the ventralizing signal Shh, to activate expression of the p1 progenitor determinant Nkx6.2 (Briscoe and Ericson, 2001; Wichterle et al., 2002). Treatment of embryoid bodies (EBs) on day 2 of differentiation with 5 nM SAG in the presence of 1 μM RA yielded large numbers of En1-tdTomato fluorescent cells (39.1% ± 2.3%) by day 8 (Figures 1A, 1B, S1A, and S1B). By comparison, MN differentiation from ESCs requires a 100–1,000 times higher SAG concentration, suggesting that, as in vivo, EBs respond to graded variations in Shh signaling to produce different ventral spinal neuron types (Briscoe and Ericson, 2001; Wichterle et al., 2002).
Figure 1. Directed Differentiation of V1 Interneurons from Mouse ESCs.

(A) En1-lineage cells identified by En1-tdTomato reporter expression. Scale bars, 100, 50, and 20 μm.
(B) Quantification of En1-lineage cells differentiated with 1 μM RA and different concentrations of SAG. Values are shown as mean ± SEM.
(C) Expression of the ventral progenitor markers Pax6 and Nkx6.2 and the early postmitotic V1 IN markers En1 and Foxd3 in day 5 EBs. Scale bars, 50 μm (insets, 20 μm).
(D) En1-lineagecells downregulate En1 and Foxd3 and upregulate late postmitotic V1 IN genes by day 8. En1-lineage cells express NeuN but not other ventral spinal neuron markers. Scale bars, 50 μm.
Because En1 is also expressed in non-spinal populations, including midbrain dopaminergic neurons, we examined the expression of Hox TFs known to confer rostrocaudal regional identity to developing embryos (Dasen and Jessell, 2009). En1-tdTomato cells expressed spinal Hox TFs (e.g., Hoxc6, Hoxc8J while excluding more anterior Hox TFs such as Hoxa2, as well as Lmx1b, a TF induced in dopaminergic neurons, suggesting that these conditions exclusively generate spinal En1-lineage neurons (Figures S1C and S1E).
Importantly, stem cell-derived neurons recapitulate the steps of spinal V1 IN development. Many cells in day 5 EBs expressed markers of p1 progenitors that give rise to V1 INs, including Pax6 and Nkx6.2 (Figure 1C), whereas few cells expressed more dorsal markers Pax7 and Dbx1, or more ventral markers Nkx6.1 or Nkx2.2 (Figure S1D; Briscoe and Ericson, 2001; Pierani et al., 2001; Sternfeld et al., 2017; Wichterle et al., 2002). Similar as in vivo, postmitotic cells expressed En1 protein only transiently; although 75% of lineage-traced cells were En1-positive on day 5,13% were positive on day 6 and less than 10% on day 8. Foxd3, another TF involved in early V1 IN specification, was similarly broadly expressed in early postmitotic V1 INs but downregulated by later stages (Figures 1C and 1D; Saueressig et al., 1999; Stam et al., 2012). By the time V1 IN differentiation peaked on day 8, virtually all En1 lineage-traced cells expressed the neuron-specific markers NeuN and synapsin as well as Pax2 and Lhx1/5, TFs implicated in inhibitory neuronal identity (Figures 1D and S1F; Burrill et al., 1997; Pillai et al., 2007; Sapir et al., 2004). Importantly, we did not detect ectopic expression of markers of non-V1 spinal neurons (e.g., Evx1, Chx10, and Isl½, which label V0 INs, V2a INs, and MNs, respectively) (Figures 1D and S1E). Thus, by day 8, En1 lineage-traced cells, hereafter referred to as ES-V1 INs, acquire molecular properties consistent with a postmitotic V1 IN cell fate.
Molecular Signature of En1-Lineage Cells In Vitro
To systematically trace the molecular development of in vitro-derived V1 INs, we compared the gene expression profiles of undifferentiated ESCs with fluorescence-activated cell sorting (FACS)-purified early (day 5) and late (day 8) ES-V1 INs. Unsupervised hierarchical clustering of RNA sequencing (RNA-seq) data correctly ordered the three cell types (Figure 2A). En1 expression was absent in ESCs, highly induced on day 5, and decreased by day 8 (−0.41, 6.73, 3.98 log2 transcripts per million [log2TPM], respectively). A similar pattern of expression was observed for the p1 progenitor marker Prdm12 (−0.73, 6.28, and 4.99 log2TPM, respectively) (Thélie et al., 2015; Zannino et al., 2014). Conversely, Foxp2, a gene encoding for a TF expressed in a subset of late-born V1 INs (Benito-Gonzalez and Alvarez, 2012; Stam et al., 2012), exhibited increasing expression over time, reflecting proper temporal regulation of molecular markers in stem cell-derived neurons.
Figure 2. Molecular Signature of En1-Line-age Cells In Vitro.

(A) RNA-seq expression analysis of ESCs and FACS-purified day 5 or day 8 En1-lineage cells (log2 transcripts per million [log2TPM]).
(B) Cultured En1-lineage cells express the inhibitory markers Gad67 and GlyT2. Scale bars, 20 μm. (C) Gad67 and GlyT2 expression in cells cultured on laminin and fibronectin versus an astrocyte monolayer (mean ± SEM, ANOVA, *p < 0.05).
(D) Comparison of gene expression of ESC-derived V1 and dI4 INs on day 8 (log2TPM).
(E) Clustering ofprimaryVI INs (E12.5, P0, and P5) with day 5 (top) and day 8 (bottom) ES V1 INs, based on genes differentially expressed in E12.5 spinal V1 INs compared with dI4 INs (log2fold change cutoff 1.5 and adjusted p value [p-adj] < 0.01).
Notably, V1 INs are inhibitory cells utilizing both gamma-ami-nobutyric acid (GABA) and glycine as a neurotransmitter. GABA is the dominant neurotransmitter in the embryo, whereas postnatal and adult V1 INs increasingly rely on glycine (Berki et al., 1995; Gao et al., 2001; Gonzalez-Forero and Alvarez, 2005). Accordingly, ES-V1 INs on day 8 revealed 5-and 10-fold induction, respectively, of the glutamate decarboxylase genes Gad65 (Gad2) and Gad67 (Gad1), required for GABA neurotransmitter synthesis, and a 3-fold induction of the glycine transporter GlyT2 (Slc6a5) (Figure 2A). To examine whether in vitro-matured cells undergo a neurotransmitter switch, we cultured dissociated day 8 neurons for an additional week either on laminin and fibronectin substrate or on a monolayer of primary astrocytes, which has been shown to promote neuronal maturation (Chung et al., 2015; Clarke and Barres, 2013; Pfrieger and Barres, 1997). Immunostaining for Gad65, Gad67, and GlyT2 in these cultures (Figure 2B) revealed a significant increase in GlyT2-expressing ES-V1 INs on astrocyte monolayers compared with control conditions (41.8% ± 4.3% versus 9.2% ± 7.8%) (Figure 2C).
Next, to identify a set of genes that characterize ES-V1 INs, we compared their gene expression profile with dorsal dI4 spinal inhibitory INs. dI4 INs arise from a dorsal progenitor domain that expresses the TF Ptf1a and migrate into the dorsal and intermediate spinal cord (Glasgow et al., 2005). To generate dI4 INs, we derived ESC lines from Ptf1acre mice crossed to fluorescent reporter mice (Kawaguchi et al., 2002) and differentiated these with RA without the ventralizing signal SAG (Figures S2A and S2B). Similar as in vivo, Ptf1a lineage-traced cells (hereafter referred to as ES-dI4 INs) transiently expressed Ptf1a protein during transition to the postmitotic state, followed by expression of the postmitotic markers Lbx1, Pax2, and Lhx1 and/or Lhx5 (Figures S2C and S2D; Glasgow et al., 2005). We reasoned that comparison of V1 and dI4 neuronal classes would allow identification of genes specifically enriched in V1 INs while filtering out genes generic to spinal inhibitory INs.
RNA-seq gene expression profiles of sorted day 8 ES-V1 and ES-dI4 INs revealed that both cell types expressed core inhibitory IN genes (e.g., Pax2, Lhx1/5, Gad65 and Gad67). However, we also identified a significant number of differentially expressed genes, with 466 genes enriched and 239 genes downregulated in ES-V1 INs compared with ES-dI4 INs (Figure 2D). Genes enriched in day 8 ES-V1 INs included En1, Foxd3, and Foxp2. In contrast, ES-dI4 INs expressed genes known to be involved in Ptf1a lineage development (e.g., Tfap2a, Tfap2b, Lbx1, and Npy) (Figures 2D and S2D; Wildner et al., 2013). Importantly, comparison with published gene expression profiles of primary spinal cord V1 and dI4 INs at embryonic (embryonic day 12.5 [E12.5]) and early postnatal (post-natal day 0 [P0] and P5) stages (Bikoff et al., 2016) positioned day 8 ES-V1 INs between E12.5 and P0 spinal V1 INs, indicating that in vitro-derived V1 INs share global gene expression with their embryonic spinal cord counterparts (Figure 2E).
Subtype Diversity of ESC-Derived V1 Interneurons
Directed differentiation of ESCs into V1 INs offered an opportunity to investigate the mechanisms that control V1 IN molecular and functional subtype diversification. We thus examined the expression pattern of the 19 TFs defining molecularly distinct V1 IN subtypes in vivo (Bikoff et al., 2016; Gabitto et al., 2016). Based on RNA-seq gene expression data, day 8 ES-V1 INs, compared with ES-dI4 INs, exhibited >3-fold enrichment for 15 of the 19 TFs, including 3 TFs that demarcate non-overlapping V1 IN clades in the spinal cord (Foxp2, Sp8, and Pou6f2) (Figure 3A). Although not enriched compared with dI4 INs, 3 of the remaining 4 TFs were nonetheless highly induced in ES-V1 INs, including MafA, which marks the last major V1 IN clade (Figure S3A). Immunostaining of day 8 EBs demonstrated that all four clade-specific TFs are expressed in non-overlapping subsets of ES-V1 INs, congruent with their expression pattern in vivo (Figures 3B and S3B). ES-V1 INs expressing Foxp2, MafA, Pou6f2, or Sp8 TFs constituted 56% of all ES-V1 INs on day 8 of differentiation, approximating the prevalence of these subtypes in early postnatal spinal cord (~64%) (Figure 3C). Nevertheless, the distribution of individual V1 IN subtypes was somewhat divergent, with significantly fewer Pou6f2 and Sp8 V1 INs compared with in vivo (Bikoff et al., 2016; Morikawa et al., 2009).
Figure 3. Subtype Diversity of ESC-Derived V1 Interneurons.

(A) Differential expression of 19 TFs defining V1IN subtypes in day 8 ES-V1 INs relative to ES-dI4 INs (log2 fold change [log2FC], mean ± SEM).
(B) Day 8 ES-V1 INs express clade-specific TFs. Scale bars, 50 μm (insets, 20 μm).
(C) Quantification of V1 INs expressing the clade-specific TFs in P0 spinal and in vitro-derived V1 INs (mean ± SEM).
(D) Non-overlapping subsets of ES-V1 Ins express Cb and Foxp2. Scale bars, 50 μm.
(E) Day 8 Cb-positive cells express MafA, MafB, and OC2. Scale bars, 50 μm (insets, 20 μm).
(F) Quantification of Cb-positive ES-V1 INs expressing MafA, MafB, OC2, or one of the three TFs (mean ± SEM).
RCs are a molecularly diverse V1 IN subtype characterized by the expression of the calcium-binding protein Calbindin (Cb) (Alvarez and Fyffe, 2007). Although all RCs belong to the MafA clade, only two-thirds maintain expression of this clade marker, and not all MafA-expressing V1 INs are RCs (Bikoff et al., 2016). Besides MafA, specification and maintenance of RC identity is under the control of the Foxd3, Onecut1 (OC1), Onecut2 (OC2), and MafB TFs (Stam et al., 2012). Immunohistochemical characterization revealed that, by day 8 of differentiation, up to 20% of ES-V1 INs expressed Cb (Figure 3D), with more than 90% of Cb-positive cells in day 8 EBs expressing the En1 lineage tracer (data not shown). Characterization of Cb-expressing ES-V1 INs revealed that they do not express the other clade TFs, particularly Foxp2, which is expressed in a broad V1 IN subset that is developmentally and functionally distinct from RCs (Figures 3D and S3C; Bikoff et al., 2016; Morikawa et al., 2009; Stam et al., 2012). Conversely, more than 60% of Cb-positive ES-V1 INs expressed MafA, MafB, or OC2 (Figures 3E, S3D, andS3E), markers associated with RCs in vivo. Interestingly, we did not detect complete overlap of these TFs in Cb-positive ES-V1 INs on day 8, consistent with their dynamic and variable expression in the spinal cord (Bikoff et al., 2016; Sweeney et al., 2018).
Retinoid Signaling Drives the Generation of Renshaw Cells
Prior studies delineated a transcriptional program that controls RC specialization within the V1 IN class (Benito-Gonzalez and Alvarez, 2012; Stam et al., 2012). However, it remained unknown whether extrinsic signaling factors control RC specification. As the firstborn V1 INs, RCs initially migrate to the lateral margin of the developing neural tube, adjacent to MNs and proximal to the developing somites. Nascent RCs then migrate ventrally, circumnavigating MNs to settle in the most ventral part of lamina VII (Alvarez and Fyffe, 2007; Moore et al., 2015; Thomas and Wilson, 1965). Based on these observations, we speculated that signals emanating from the paraxial mesoderm, floor plate, and/or MNs might influence RC specification.
We first considered the contribution of RA and Shh because these constitute the principal patterning signals secreted from the developing somites and floor plate, respectively (Briscoe and Ericson, 2001; Jessell, 2000; Maden, 2002). Removal of RA from culture medium during the p1 progenitor stage (day 4) resulted in fewerV1 INs generated overall (17.0% ± 2.6% versus 31.7% ± 2.1%), whereas removal of RA a day later had no adverse effect on V1 IN production (33.5% ± 5.2%) (Figure S4A), suggesting that maintained RA signaling up to day 5 is critical for the specification and/or survival of all V1 INs. In contrast, removal of SAG during early (day 4) or late (day 6) stages had no effect on V1 IN differentiation, indicating that SAG is required only during initial stages of p1 progenitor patterning (Figure S4B).
Despite not affecting overall V1 IN numbers, removal of RA on day 5 resulted in a significant decrease in MafA-and Cb-expressing neurons in day 8 EBs, with no effect on the Foxp2-expressing subset (Figures 4A and 4B). Conversely, treatment of cells with higher concentrations of RA (2 μM or 5 μM) on day 5 of differentiation resulted in a dose-dependent increase in Cb-expressing V1 INs, from 20.7% ± 2.9% under standard 1 μM RA conditions to 25.3% ± 4.3% and 30.3% ± 2.4% with 2 μM and 5 μM RA, respectively (Figure S4C), without affecting ES-V1 IN numbers (data not shown). Thus, sustained high RA signaling is critical for MafA expression and efficient generation of Cb-expressing RCs.
Figure 4. Retinoid and Notch Signaling Control V1 Interneuron Clade Identity.

(A) Cb-expressing day 8 ES-V1 INs under control conditions and following RA removal on day 5. Scale bars, 50 μm.
(B) Quantification of Foxp2-, Cb-, and MafA-expressing cells following RA removal on day 5 (mean ± SEM; Student’s t test; **p < 0.01, ***p < 0.001).
(C) Quantification of Cb-positive ES-V1 INs under conditions where RA is removed on day 5 and cells are mixed with cervical MNs, Hoxc8-induced brachial MNs, or brachial MNs cultured in the absence of vitamin A (mean ± SEM; Student’s t test; *p < 0.05, **p < 0.01, ***p < 0.001).
(D) Birthdating of Cb-and Foxp2-expressing ES-V1 INs by BrdU pulse labeling (mean ± SEM).
(E) Differential expression of TFs associated with RC (blue bars) and non-RC identity (gray bars) in day 8 V1 INs following DAPT treatment on day 4. Dashed lines represent 1.5 log2FC cutoff for significance (mean ± SEM).
(F) Immunostaining and quantification of day 8 EBs treated with DAPT on day 4 (mean ± SEM; Student’s t test; *p < 0.05, ***p < 0.001). Scale bars, 50 μm.
(G) Expression of MafA, MafB, or OC2 in Cb-positive ES-V1 INs on day 8 following DAPT treatment on day 4 (mean ± SEM; Student’s t test; ***p < 0.001). Scale bars, 20 μm.
Although the paraxial mesoderm is a major source of RA during early spinal cord development, limb-innervating brachial MNs also express RALDH2, a rate-limiting enzyme for RA synthesis (Niederreither et al., 1997; Sockanathan and Jessell, 1998; Sockanathan et al., 2003; Swindell et al., 1999). To determine whether MN-derived RAcan influence RC specification, we mixed early day 5 ES-V1 progenitors with postmitotic limb-innervating ES-MNs generated through doxycycline-mediated induction of the brachial HoxTF Hoxc8 (iHoxc8) (Mazzoni et al., 2011; Tan et al., 2016). Despite the absence of exogenous RA in the medium, co-culture of V1 INs with brachial MNs expressing RALDH2 (Figure S4D) resulted in a similar yield of Cb-expressing cells as when RA is maintained during differentiation (Figure 4C). In contrast, mixing of early ES-V1 INs with cervical ES-MNs, which do not express RALDH2 (Peljto et al., 2010), did not increase the number of Cb-expressing cells. Importantly, the effect of limb-innervating MNs on RCs requires RA; mixing of ES-V1 INs with iHoxc8 MNs in culture medium lacking vitamin A, an RA precursor (Maden, 2002), yielded significantly fewer Cb-positive ES-V1 INs (Figure 4C).
Notch Inhibition Promotes a Switch to the MafA Clade Identity
RCs are born earlier than other V1 INs, including the Foxp2-expressing subtype (Benito-Gonzalez and Alvarez, 2012; Stam et al., 2012). However, the molecular cues enacting this temporal program of neurogenesis have not been identified. Bromodeox-yuridine (BrdU) birthdating experiments revealed that ESC-derived V1 IN subtypes are also generated in sequential order, with peak generation of ES-RCs on day 4 of differentiation compared with days 5–6 for the Foxp2 clade (Figure 4D). These observations suggest that stem cell-differentiated RCs recapitulate in vivo temporal development, raising the possibility that precocious differentiation of pi progenitors could result in preferential production of this subtype in vitro.
Because timing of neurogenesis is controlled in many vertebrate CNS progenitor domains by Notch signaling, with high Notch activity maintaining neural progenitor status and low Notch activity promoting progenitor cell cycle exit and the onset of neuronal differentiation (Cepko, 2014), we reasoned that Notch inhibition during early Vi IN differentiation might promote the generation of early-born cell types such as RCs. To test this hypothesis, we used the gamma-secretase inhibitor DAPT to pharmacologically inhibit Notch signaling in differentiating EBs (Tan et al., 2016). DAPT treatment on day 4–5 of ES-V1 IN differentiation resulted in an ~31% increase in Cb-expressing Vi INs in day 8 EBs compared with untreated controls, with near-complete elimination of Foxp2-expressing cells (Figures 4F and S4E). Importantly, overall V1 IN differentiation was not significantly altered by DAPT treatment (Figure S4F). Thus, Notch inhibition during a critical period of V1 neurogenesis increases RC generation at the expense of Foxp2-expressing V1 INs without affecting the overall number of V1 INs generated.
However, Notch inhibition is not sufficient to convert all p1 progenitors to the RC fate, given that the reduction in Foxp2-expressing cells far exceeds the increase in Cb-expressing cells. To gain a global understanding of the effects of early Notch inhibition on V1 IN diversity, we performed RNA-seq expression profiling of FACS-purified ES-V1 INs from day 8 EBs treated with DAPT on day 4. DAPT treatment upregulated 119 ES-V1 IN-enriched genes (compared with ES-dI4 INs), whereas 201 genes were downregulated. Remarkably, of the 19 TFs enriched in spinal V1 INs, those associated with the MafA clade were significantly upregulated by DAPT treatment (blue bars: OC1, OC2, MafB, and MafA), whereas all other TFs except Pou6f2 were repressed (gray bars) (Figure 4E).
This was confirmed with immunocytochemistry of day 8 EBs (Figures 4F, 4G, and S4G). DAPT treatment resulted in ~96% of En1 lineage-traced cells adopting MafA, MafB, orOC2 identity (Figure 4F; data not shown). Furthermore, more than 95% of Cb-positive ES-V1 INs expressed MafA, MafB, or OC2 TFs under DAPT treatment conditions (Figure 4G). To confirm that the DAPT effects are due to Notch pathway inhibition, we performed V1 IN differentiation in an ESC line carrying the doxycycline-inducible dominant-negative form of the Notch coactivator Mastermind-1 (DnMaml1) (Tan et al., 2016; Figure S4H). Induction of DnMaml1 on late day 3 of differentiation caused a significant increase in Cb and MafA cells, a reduction in Foxp2 cells overall, and near-elimination of Foxp2 and Pax2 inhibitory INs in particular (Figure S4I). Thus, Notch inhibition at the early progenitor stage promotes formation of the MafA clade while suppressing the generation of other V1 IN subtypes, especially the Foxp2-expressing population.
Functional Characterization of ESC-Derived Renshaw Cells
Efficient differentiation of neurons with molecular properties of RCs provided the opportunity to examine whether in vitro-generated RCs acquired subtype-appropriate functional properties. To examine the migratory properties of ESC-derived V1 INs, we transplanted EBs containing a mixed population of early postmitotic En1-GFP ES-V1 (day 5) and Ptfla-tdTomato ES-dI4 INs (day 6) into the central canal of the embryonic chick neural tube at Hamburger-Hamilton stage 16 (HH16) (Hollyday and Hamburger, 1977), an established proxy for assessing the in vivo functional properties of ESC-derived neurons (Peljto et al., 2010; Wichterle et al., 2002). Four days after transplantation (HH30), we analyzed the distribution of cells along the dorsoventral axis of the spinal cord (Figure 5A). We partitioned the spinal cord into six equal bins along the dorsoventral axis and quantified the fraction of all transplanted cells in each bin. The majority of ES-V1 INs (>85%) migrated into the ventral spinal cord (bins 4–6) compared with only 3.3% of ES-dI4 INs, which, instead, preferentially migrated into dorsal bins 1 and 2 (Figure 5B). Furthermore, ES-V1 INs projected axons locally and ipsilaterally within the ventral funiculus, whereas ES-dI4 INs preferentially arborized in the dorsal spinal cord (Figure S5A).
Figure 5. Functional Characterization of ESC-Derived Renshaw Cells.

(A) Day 5 En1-GFP and day 6 Ptf1a-tdTomato EBs co-grafted into Hamburger-Hamilton stage 16 (HH16) chick embryonic spinal cord and examined at HH30 (n ≥ 4 each). Scale bars, 100 μm.
(B) Quantification of cell migration into distinct regions of the spinal cord divided into 6 equivalent dorsoventral bins (mean ± SEM).
(C) Immunostaining of transplanted V1 INs for Cb and Foxp2. Scale bars, 100 μm.
(D) Distribution of Cb-and Foxp2-expressing transplated cells along the medio-lateral and dorso-ventral axes.
(E) Post hoc immunostaining of Neurobiotin-filled En1-lineage cell for subtype identification. Renshaw cells are En1-tdTomato cells co-expressing Cb and OC2. Scale bar, 20 μm.
(F) Superimposed membrane responses (top traces) following current injection (bottom traces) in RC and non-RC V1 INs in vitro.
(G) Current-to-voltage relationships for RCs versus non-RCs. Based on the slope of the linear current-to-voltage relationship, RCs have increased input resistance compared with other V1 IN subtypes (421.7 megaohms [MΩ] ± 30.1 versus 264.0 MΩ ± 16.1) (mean ± SEM).
(H) Passive membrane properties of recorded ES-RC and non-RC V1 INs (see also Figure S5C) (mean ± SEM; Student’s t test; *p < 0.05, ***p < 0.001).
We next examined whether different subtypes settle at different spatial positions within the ventral horn. Although Foxp2-expressing ESC-derived V1 INs were distributed broadly within the ventral horn, the majority of grafted Cb-expressing ES-V1 INs migrated into a region ventromedial to MN cell bodies and neurites (Figures 5C and 5D), similar to their normal distribution in the developing mouse spinal cord (Alvarez et al., 2013; Thomas and Wilson, 1965). It is of interest that R-INs, the avian equivalent of RCs, occupy a more dorsal position (Wenner and O’Donovan, 1999; Xu et al., 2005), indicating that the global positioning cues are conserved between chick and mouse and that mouse ES-RCs adhere to their species-and subtype-specific settling position following xenotransplantation.
RCs also differ from other V1-derived neurons based on their distinctive morphology and physiology. Cb-expressing RCs are smaller than other ventral INs, with larger input resistance compared with Ia inhibitory INs or MNs (Bui et al., 2003; Fyffe, 1990; Mentis et al., 2006). In the postnatal mouse spinal cord, RCs have also been shown to fire high-frequency bursts of action potentials, but precisely when this firing pattern emerges during development has not been established (Eccles et al., 1961; Walmsley and Tracey, 1981). We thus performed whole-cell patch-clamp electrophysiology recordings to determine whether ES-RCs could be distinguished electrophysiologically from other ESC-derived V1 INs.
The subtype identity of intracellularly filled recorded cells was identified post hoc with Cb and OC2 immunoreactivity (Figure 5E). There was no difference in the resting membrane potential (RMP) or threshold voltage (VThr) (Figure S5B) between RC and other V1 IN subtypes. However, ES-RCs had increased input resistance and time constants and a significantly reduced rheobase, with a correspondingly smaller soma area (Figures 5F–5H and S5C), as reported for mouse RCs in vivo (Mentis et al., 2006). Together, these results suggest that ES-RCs have increased membrane excitability compared with non-RC V1 INs, likely as a consequence of their smaller size (Figure 5H). There was no significant increase in the number of ES-RCs that fired burst-tonic trains of action potentials compared with non-RCs at this stage (Figures S5D and S5E; Bikoff et al., 2016). Furthermore, there was no significant difference in the maximum firing frequency of burst-tonic firing cells in the two groups (Figure S5F), suggesting that, at the time of analysis, ES-RCs had not yet matured physiologically.
Monosynaptic Rabies Virus Tracing Reveals Motor Neuron Connectivity of ES-V1 Interneurons
The unique characteristic of RCs in the spinal cord is their ability to form recurrent synaptic connections with MNs (Figure 6A). We adapted monosynaptic rabies virus (RABV) for retrograde tracing of neurons to examine synaptic connectivity between different V1 IN subtypes and MNs (Figure 6B; Wicker-sham et al., 2007a, 2007b). This modified SADB19ΔG-GFP RABV is pseudotyped with an avian envelope protein (EnvA) so that initial infection is restricted to MNs expressing the cognate TVA receptor, whereas deletion of the viral glycoprotein (ΔG) restricts viral spread to first-order premotor neurons. FACS-purified En1-tdTomato ES-V1 INs and TVA/G-protein-expressing ES-MNs were co-cultured for 1 week prior to addition of the RABV. Efficient (~91%) transduction of MNs was detected after 24–48 hr (Figures S6A and S6B), whereas ES-V1 INs did not express SADΔG-GFP RABV until 3–4 days after initial MN infection, consistent with the delay in trans-synaptic labeling in vivo (Figure S6C; Coulon et al., 2011; Jovanovic et al., 2010).
Figure 6. Monosynaptic Rabies Virus Tracing Reveals Motor Neuron Connectivity of ES-V1 Interneurons.
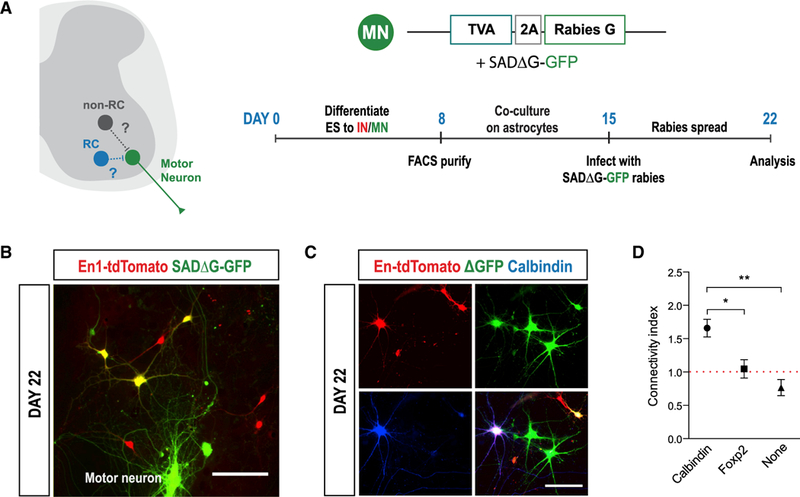
(A) Schematic of monosynaptic rabies virus tracing.
(B) RABV tracing with GFP-expressing ES-MNs (green) and ES-V1 INs (red), including SADDG-GFP-expressing V1 INs connected to MNs (yellow).
(C) Immunostaining for Cb and Foxp2 reveals the subtype identity of premotor V1 INs. Scale bars, 50 μm.
(D) The calculated connectivity index (C.I.) reveals V1 subtype-specific MN connectivity. The red dotted line marks a C.I. of1, or 50% likelihood. Mean ± SEM; ANOVA; *p < 0.05, **p < 0.01.
We examined cells triple-labeled by SADΔG-GFP, En1-tdTomato, and either Cb or Foxp2 to determine connectivity between MNs and different V1 IN subtypes. To take into account V1 IN subtype distribution in the culture, we calculated a connectivity index (C.I.) normalized to the average connectivity between V1 INs and MNs (see STAR Methods for a detailed explanation; Figures 6C, S6D, and S6E). We determined that Cb-expressing RCs had a C.I. of 1.66 compared with 1.05 for Foxp2-expressing V1 INs and 0.77 for Cb and Foxp2 double-negative V1 INs, indicating that RCs are more likely to directly innervate MNs than other subtypes (Figure 6D), consistent with in vivo observations (Zhang et al., 2014).
Optogenetically Activated ES-Motor Neurons Preferentially Innervate Renshaw Cells
In contrast to multiple V1 IN subtypes innervating spinal MNs, RCs are the only known inhibitory IN cell type to receive innervation by MN collaterals (Figure 7A; Alvarez and Fyffe, 2007). To determine whether ES-RCs receive MN inputs, we examined transplanted En1-GFP cells for the presence of cholinergic innervation. To provide additional time for synapse elaboration, we examined chick spinal cord 7 days after transplantation (HH36). Immunostaining with Cb and the vesicular acetylcholine transporter VAChT, a marker of cholinergic synapses, revealed that transplanted Cb-positive cells in the ventral horn were selectively surrounded by VAChT puncta (Figures 7B and 7C). The puncta are likely from MN collaterals, given that synapses from spinal cholinergic INs (C boutons) are not elaborated until early postnatal periods (Phelps et al., 1984; Wetts and Vaughn, 2001; Wilson et al., 2004); the puncta were negative for Kv2.1, a channel enriched at C boutons (Wilson et al., 2004); and RCs have not been shown to receive C boutons in vivo (Zagoraiou et al., 2009).
Figure 7. Optogenetically Activated Motor Neurons Preferentially Innervate Renshaw Cells.

(A) Schematic depicting potential MN cholinergic inputs onto RC and non-RC V1 INs.
(B) Day 5 En1-GFP EBs grafted into HH16chick spinal cord and examined 7 days later (HH36) (n = 4). LMCm, lateral motor column, medial; LMCl, lateral motor column, lateral; MMC, medial motor column. Scale bars, 100 μM (inset, 50 μM).
(C) Transplanted Cb-expressing En1-GFP cells receive abundant VAChT contacts on their somata and proximal processes, whereas En1-GFP-only cells are devoid of VAChT inputs. Scale bar, 20 μm.
(D) FACS-purified ES-V1 INs and ES-MNs co-cultured for 22 days and immunostained for Cb, OC2, and VAChT. Scale bar, 20 μm.
(E) ES-V1 IN subtype-specific recruitment of VAChT-immunoreactive inputs (mean ± SEM; Student’s t test, ***p < 0.001).
(F) Schematic of optogenetics-mediated whole-cell patch-clamp recordings.
(G) Photostimulation of MNs (green line, 25 ms) produces single action potentials (APs) (top), which elicit APs in RCs, as revealed by current-clamp recordings (center). RC responses are abolished using a combination of the cholinergic blockers mecamylamine (50 μM) and atropine (5 μM) (bottom). The asterisk denotes latency of RC response.
(H) The latency from the MN AP to the onset of the RC response was ~4 ms following MN stimulation at 0.1 Hz (mean ± SEM).
(I) Response onset variability, or jitter, of the ES-RC response over multiple trials at 0.1 Hz (see also Figure S7E).
(J) At 0.1-and 1-Hz stimulation frequencies, the variability of the RC response was minimal.
(K) ES-RCs are significantly more likely to depolarize in response to MN photoactivation compared with non-RC V1 INs (mean ± SEM; Student’s t test, ***p < 0.001).
To measure the extent of synaptic connectivity between MNs and RCs and to probe the functionality of the cholinergic synapses, we established co-cultures of Hb9::GFP ES-MNs and En1-tdTomato ES-V1 INs. Immunostaining of 2-week-old cultures revealed that ES-RCs receive significantly more VAChT inputs than non-RCs (66.4% ± 12.2% versus 29.7% 7.2%), respectively) (Figures 7D, 7E, S7A, and S7B).
To determine whether the synapses from MN axon collaterals onto RCs are functional, we used optogenetics-mediated MN stimulation coupled with whole-cell patch-clamp recordings of ES-V1 INs. ES-V1 INs were co-cultured with Hb9::GFP MNs expressing the light-sensitive ion channel channelrhodopsin-2 (ChR2) (Bryson et al., 2014; Figures 7F and S7C). Brief pulses of light (25 ms) elicited single action potentials in MNs, which, in turn, depolarized and elicited action potentials in synaptically connected V1 INs, including molecularly identified RCs. Notably, RC responses were abolished using a combination of the cholinergic receptor blockers mecamylamine and atropine, confirming the cholinergic nature of neurotransmission on RCs (Figure 7G).
Importantly, short latency (Figures 7H and S7D) and low response onset variability, or jitter, (Figures 7I, 7J, and S7E) of the RC response to MN photostimulation (Bikoff et al., 2016; Mentis et al., 2006; Shneider et al., 2009) confirmed that the MN-to-RC response was monosynaptic. Finally, we found that RCs were almost 4 times more likely to generate a depolarization compared with non-RC V1 INs after MN activation (Figure 7K). Taken together, these transplantation and electrophysiological data indicate that ES-RCs exhibit appropriate functional properties and connectivity that distinguish them from other V1 INs.
DISCUSSION
The complex, highly coordinated motor sequences that constitute animal movement and behavior are the product of versatile motor circuits composed of hundreds of distinct spinal motor neuron and IN subtypes. Mechanisms controlling the specification of neuronal subtype identity and integration of individual nerve cells into functional circuits remain poorly understood, not least because of the complexity and limited access to the developing spinal cord in vivo. Here we developed an experimentally accessible system for the differentiation of mouse ESCs into V1 INs and used this system to investigate the mechanisms contributing to the formation of distinct V1 IN clades and subtypes.
Sustained Retinoid Signaling Is Required for Renshaw Cell Differentiation
We found that sustained high retinoic acid signaling is necessary for the expression of both MafA and Cb, markers of RCs. Although it is possible that RA is required for the survival of RCs, our observation that the total number of ES-V1 INs is unchanged in the absence of RA is consistent with a model in which the lack of RA results in re-specification of RCs into other subtypes of V1 INs. Our results suggest that early-born V1 INs migrating laterally toward the paraxial somites encounter high concentrations of RA, biasing their differentiation toward RC identity, whereas later-born V1 INs that settle farther away from the RA source acquire other subtype identities.
Prior studies have demonstrated significant differences in V1 IN subtype diversity along the rostrocaudal axis, including enrichment of RCs at forelimb-innervating segments (Francius et al., 2013; Sweeney et al., 2018), suggesting that nascent neurons in vivo are exposed to different signaling microenvironments that act to confer region-specific cell type identity. In this context, it is interesting to consider whether local secretion of RA from limb-innervating motor neurons at the brachial and lumbar spinal cord contributes to specification of RCs. Our co-culture experiments demonstrate that RA secreted from limb-innervating motor neurons (Sockanathan and Jessell, 1998) is sufficient to increase the generation of RCs when differentiating cells are deprived of exogenous RA. Nonetheless, given that RCs are also present in the upper cervical spinal cord, where there are no RALDH2-producing MNs, and V1 subtype identity is not eroded in vivo under conditions in which MNs are ablated (Sweeney et al., 2018), the precise role of MNs in the specification of V1 IN subtypes remains to be determined.
How retinoid signaling controls V1 IN subtype identity is also unknown. The ligand-bound RA receptors (RARs) directly activate the expression of secondary TFs, including Hox1–Hox5 paralogs (Mahony et al., 2011; Mazzoni et al., 2013). Thus, Hox genes might control V1 IN segmental identity in vivo, including segment-specific IN subtype specification. Intriguingly, Hox paralogs are differentially expressed in V1 IN subpopulations along the rostrocaudal axis, and Hoxc9−/−mutant mice have recently been shown to exhibit thoracic-to-limb transformations of V1 IN subtypes (Sweeney et al., 2018).
Notch Inhibition Biases the Formation of Renshaw Cells
Notch signaling plays a critical role in controlling the timing of neurogenesis and acquisition of different cell fates in nascent neurons (Livesey and Cepko, 2001; Mizeracka et al., 2013; Tan et al., 2016). Our finding that Notch inhibition results in nearly complete conversion of Foxp2-expressing V1 INs into MafA-, MafB-, and OC2-expressing cells suggests that Notch signaling directly controls V1 IN subtype identity. This conclusion is supported by our finding that Notch inhibition, even at late phases of V1 IN differentiation, when many Foxp2-expressing V1 INs are born, results in suppression of Foxp2 subtype generation and overproduction of MafA-expressing cells. Thus, inhibition of Notch does not simply promote cell cycle exit but also directs the fate switch from Foxp2 into MafA clade identity. Interestingly, Pou6f2 and Sp8 expression were also significantly regulated by DAPT. However, both clades represent relatively minor subpopulations generated during in vitro differentiation, indicating that additional mechanisms are likely required for their specification. It is of interest that prior genetic studies using mouse mutants of Notch effector genes did not find significant changes in V1 IN or RC specification (Marklundetal., 2010; Ramos et al., 2010; Stam et al., 2012). We speculate that pharmacological inhibition of Notch signaling using DAPT produces a more penetrant effect by eliminating the potential for compensatory activation of other Notch receptors or ligands.
Although Notch inhibition is able to suppress nearly all non-RC transcriptional programs and activate robust expression of MafA, MafB, and OC2, it is not sufficient to induce comparably extensive expression of the late RC marker Cb. It remains to be determined whether the lack of Cb expression reflects a defect in proper maturation of induced RCs (e.g., failure to upregulate Cb) or whether these cells acquire non-RC MafA clade subtype identity and additional signals are required to promote and maintain RC fate.
Although it will undoubtedly require significant effort to dissect the mechanisms that contribute to the specification of each of the dozens of distinct V1 IN subtypes, our work lays a basic framework for studying how V1 IN diversity arises. The observation that in vitro differentiation yields comparable subtype diversity of V1 INs indicates that diversification of V1 INs is driven by an intrinsic transcriptional program, largely independent of the normal spinal cytoarchitecture and embryonic signaling environment. Progenitors in the p1 domain are likely undergoing changes in their competence to give rise to different subsets of V1 INs, whereas the final assignment of IN subtype identity is fine-tuned by extrinsic signals, such as Notch and RA, that act to influence the final proportions of V1 subtypes generated in the spinal cord. It will be interesting to determine whether similar mechanisms contribute to the diversification of other spinal and brain IN populations (Campbell et al., 2017; Hayashi et al., 2018; Tasic et al., 2016).
Synaptic Specificity of ESC-Derived Renshaw Cells
Given our ability to robustly generate V1 INs from ESCs, including RCs, we used the system to investigate whether RC-MN synaptic connectivity depends on global positional cues within the intact spinal cord, as demonstrated for sensory-motor neuron connectivity (Sürmeli et al., 2011). Using a chick spinal cord transplantation paradigm, we show that transplanted mouse ES-RCs settle ventromedially relative to MNs, a position distinct from the location of endogenous chick R-INs (Wenner and O’Donovan, 1999; Xu et al., 2005), suggesting that, although global positioning cues in the spinal cord are phylogenetically conserved, the cues are differentially interpreted by migrating mouse and chick RCs to reach divergent destinations. Importantly, our studies in “scrambled” co-cultures of ESC-derived spinal MNs and V1 INs revealed that RCs are capable of recruiting 2–3 times more MN contacts than other V1 INs, suggesting that synaptic specificity between RCs and MNs is, to a significant extent, controlled by intrinsic, cell type-specific recognition cues. Nevertheless, spatial cues, as evidenced by the selective migration and settling position of transplanted mouse ES-RCs in the chick spinal cord, are likely to contribute to the refinement and maintenance of RC-MN synaptic specificity. Our simplified co-culture system will facilitate further investigation of the molecular determinants that control the formation of physiologically relevant functional neural circuits. Enhanced understanding of these developmental processes will enable further deconstruction of the wiring of spinal circuits and provide access to simplified neural systems for modeling neurological diseases.
STAR★METHODS
KEY RESOURCES TABLE
| REAGENT or RESOURCE | SOURCE | IDENTIFIER |
|---|---|---|
| Antibody | ||
| Rat anti-BrdU | Accurate Chemical | RRID:AB_2631302 |
| Mouse anti-Cb D28K | Swant | RRID:AB_10000347 |
| Rabbit anti-Cb D28K | Swant | RRID:AB_2721225 |
| Mouse IgG anti-human CD14 (UCHM-1) | AbD Serotec | RRID:AB_566515 |
| Goat anti-ChAT | EMD Millipore | RRID:AB_2079751 |
| Rabbit anti-Chx10 | Jessell Lab/HHMI CU | RRID:AB_11207724 |
| Rabbit anti-Dbx1 | Jessell Lab/HHMI CU | |
| Mouse anti-En1 | DSHB | RRID:AB_528219 |
| Guinea pig anti-En1 | Jessell Lab/HHMI CU | |
| Mouse anti-Evx1/2 | Jessell Lab/HHMI CU | RRID:AB_528231 |
| Rabbit anti-Foxd3 | Tompers et al., 2005 | |
| Goat anti-Foxp2 | Santa Cruz | RRID:AB_2107124 |
| Rabbit anti-Foxp2 | Abcam | RRID:AB_2107107 |
| Mouse anti-Gad67 | Chemicon Int’l | RRID:AB_2278725 |
| Rabbit anti-GFP | Invitrogen | RRID:AB_221569 |
| Sheep anti-GFP | Serotec | RRID:AB_619712 |
| Guinea pig anti-GlyT2 | Chemicon Int’l | RRID:AB_90953 |
| Mouse anti-Hb9 | Jessell Lab/HHMI CU | RRID:AB_2145209 |
| Guinea pig anti-Hb9 | Jessell Lab/HHMI CU | |
| Mouse anti-Isl1/2 | Jessell Lab/HHMI CU | RRID:AB_2314683 |
| Rabbit anti-Hoxa2 | Geisen et al., 2008 | |
| Guinea pig anti-Hoxc6 | Jessell Lab/HHMI CU | RRID:AB_2665443 |
| Mouse anti-Hoxc6 | Jessell Lab/HHMI CU | |
| Guinea pig anti-Hoxc8 | Jessell Lab/HHMI CU | |
| Mouse anti-Hoxc8 | Jessell Lab/HHMI CU | |
| Rabbit anti-Hoxc9 | Jessell Lab/HHMI CU | RRID:AB_2631312 |
| Goat anti-mouse IgG microbeads | Miltenyi-Biotec | RRID:AB_244361 |
| Guinea pig anti-Lbx1 | Muller et al., 2002 | RRID:AB_2532144 |
| Mouse anti-Lhx1 and/or Lhx5 | DSHB | RRID:AB_2136850 |
| Rabbit anti-Lhx3 | Jessell Lab/HHMI CU | |
| Guinea pig anti-Lmx1b | Jessell Lab/HHMI CU | |
| Rabbit anti-MafA | Novus Biologicals | RRID:AB_10002142 |
| Rat anti-MafA | Jessell Lab/HHMI CU | RRID:AB_2665417 |
| Mouse anti-MafB | Bethyl Laboratories | RRID:AB_1279487 |
| Mouse anti-NeuN | Millipore | RRID:AB_2298772 |
| Rabbit anti-NeuN | EMD Millipore | RRID:AB_10807945 |
| Rabbit anti-Nkx2.2 | Jessell Lab/HHMI CU | |
| Mouse anti-Nkx6.1 | Jessell Lab/HHMI CU | |
| Guinea pig anti-Nkx6.2 | Vallstedt et al., 2001 | |
| Sheep anti-Onecut2 | R&D Systems | RRID:AB_10640365 |
| Rabbit anti-Pax2 | Zymed/Life Tech | RRID:AB_2533990 |
| Mouse anti-Pax6 | Jessell Lab/HHMI CU | |
| Rabbit anti-Pax7 | Jessell Lab/HHMI CU | |
| Rat anti-Pou6f2 | Jessell Lab/HHMI GU | RRID:AB_2665427 |
| Rabbit anti-Ptf1a | G. Wright | |
| Rabbit anti-Raldh2 | Sockanathan and Jessell, 1998 | RRID:AB_2631299 |
| Rabbit anti-RFP | Ghemicon Int’l | RRID:AB_91337 |
| Goat anti-Sp8 | Santa Cruz | RRID:AB_2194626 |
| Rat anti-Sp8 | Jessell Lab/HHMI GU | RRID:AB_2665442 |
| Rabbit anti-Synapsin | Millipore | RRID:AB_2200400 |
| Rat anti-VAChT | Jessell Lab/HHMI GU | |
| Goat anti-VAChT | Millipore | RRID:AB_2630394 |
| Bacterial and Virus Strains | ||
| SAD-B19-ΔG-GFP | Wickersham et al., 2007a, 2007b | |
| SAD-B19-ΔG-dsRed | Osakada et al., 2011 | |
| Chemicals, Peptides, and Recombinant Proteins | ||
| Retinoic acid | Sigma-Aldrich | R2625 |
| Smoothened agonist (SAG) | Selleck Chemicals | S7779 |
| B-27 supplement (50×) minus vitamin A | GIBGO | 12587010 |
| 5-Bromo-2’-Deoxyuridine (BrdU) | Life Technologies | B23151 |
| Doxycycline | Fisher Scientific | NG0424034 |
| DAPT | Selleck Chemicals | S2215 |
| Recombinant human GDNF | R&D Systems | 212-GD-050/GF |
| Mouse laminin protein | Life Technologies | 23017–015 |
| Fibronectin from human plasma | Sigma-Aldrich | F2006 |
| Cascade Blue hydrazide | Molecular Probes | G687 |
| Neurobiotin | Vector Labs | SP-1120 |
| Atropine | Tocris | 0692 |
| Mecamylamine | Tocris | 2843 |
| Deposited Data | ||
| RNA-seq from ES-V1 and ES-dI4 INs | This paper | GEO: GSE112377 |
| RNA-seq from ESCs and day 5 ES-MNs | Rhee et al., 2016 | GEO: GSE79561 |
| Microarray data from mouse V1 INs | Bikoff et al., 2016 | GEO: GSE69560 |
| Experiment Models: Organisms/Strains | ||
| Mouse: En1::Cre | Sapir et al., 2004 | RRID:IMSR_JAX:007916 |
| Mouse: Ptf1a::Cre | Kawaguchi et al., 2002 | RRID:BCBC_184 |
| Mouse: ROSA-lsl-tdTomato (Ai9) | Madisen et al., 2010 | RRID:IMSR_JAX:007905; RRID:IMSR_JAX:007908 |
| Mouse: ROSA-lsl-tdTomato (Ai14) | RRID:IMSR_JAX:007908 | |
| Mouse: RCE-lsl-eGFP | Miyoshi et al., 2010 | RRID:MGI:4412377 |
| Mouse: C57BL/6 wildtype (p0 to p5) | Jackson Laboratories | RRID:IMSR_JAX:000664 |
| Specific Pathogen Free Fertile Chicken Eggs | Charles River | |
| Experimental Models: Cell Lines | ||
| mESC En1::cre × ROSA::tdTomato | This paper | |
| mESC En1::cre × ROSA::eGFP | This paper | |
| mESC Ptf1a::cre × ROSA::tdTomato | This paper | |
| mESC Hb9::GFP/PGK-TVA-G | This paper | |
| mESC Hb9::CD14-ires-GFP/CAG-Chr2-YFP | Bryson et al., 2014 | |
| mESC DnMaml1-eGFP | Tan et al., 2016 | |
| mESC NIGD-V5 | Tan et al., 2016 | |
| mESC Hoxc8-V5 | Tan et al., 2016 | |
| Oligonucleotides | ||
| Hes5 5’ forward | Tan et al., 2016 | |
| Hes5 3’ reverse | Tan et al., 2016 | |
| Recombinant DNA | ||
| pPGK-TVA-G | This paper | |
| pBOB-synP-HTB | Miyamichi et al., 2011 | Addgene #30195 |
| pminiTol2 | Balciunas et al., 2006 | Addgene #31829 |
| pCMV-Tol2 transposase | Balciunas et al., 2006 | Addgene #31823 |
| pPL451 | Liu et al., 2003 | |
| pCEP4 | ThermoFisher Scientific | |
| pcDNA3.1 | Invitrogen | |
CONTACT FOR REAGENT AND RESOURCE SHARING
Further information and requests for reagents and resources should be directed to and will be fulfilled by the Lead Contact, Hynek Wichterle (hw350@columbia.edu).
EXPERIMENTAL MODEL AND SUBJECT DETAILS
Mouse embryonic stem cell lines were derived from the following previously published mouse strains: En1::cre or Ptf1a::cre mice were crossed to Rosa-LSL-tdTomato (Ai9 or Ai14) or RCE-LSL-eGFP fluorescent reporter mice (Kawaguchi et al., 2002; Kimmel et al., 2000; Madisen et al., 2010; Miyoshi et al., 2010; Sapir et al., 2004). Male and female adult mice were used and maintained using standard husbandry and housing conditions. All experiments and procedures were performed according to NIH guidelines and approved by the Institutional Animal Care and Use Committee of Columbia University.
METHOD DETAILS
Mouse ESC derivation
For derivation of stem cell lines, we bred three mating age females and harvested blastocysts at timed pregnancy age e3.5 according to established protocols (Abbondanzo et al., 1993; Wong et al., 2010). Genotyping was performed using primers detecting Cre (Chen et al., 2011) and/or GFP (A. Joyner Lab, Memorial Sloan Kettering) or Rosa (Jackson Laboratory).
Mouse ESC culture
ESC culture for differentiation into spinal neurons was optimized based on previously published protocols (Wichterle et al., 2002; Wichterle and Peljto, 2008). ESCs were cultured in ES cell media containing ES D-MEM (EMD Millipore), 15% ES-grade fetal bovine serum (FBS) (ThermoScientific) and supplemented with 1% nucleosides (EMD Millipore), 1% non-essential amino acids (EMD Millipore), 2 mM L-glutamine (Life Technologies), 1% penicillin-streptomycin (pen-strep, Life Technologies) and 1000 U/mL Leukemia Inhibitory Factor (LIF, EMD Millipore). For inducible transgenic lines (Hoxc8-V5, DnMaml1-eGFP, NICD-V5), tetracycline-free FBS was used (Clontech). All ESC expansions were carried out on T-25/T-75 tissue culture flasks (Nunc) coated with 0.1% gelatin (EMD Millipore). For most experiments, ESCs were expanded on a monolayer of irradiated or mitomycin-C treated primary mouse embryonic fibroblasts (MEFs) (Globalstem, EMD Millipore) grown in media containing ES-MEM (EMD Millipore), 10% FBS (ThermoScientific), L-glutamine, and pen-strep. Media was exchanged every 2–3 days.
ESC-to-neuron differentiation and culture
ESC-to-MN differentiation was performed as described in (Wichterle et al., 2002). Hb9::GFP (Wichterle et al., 2002), Hb9::Cd14-IRES-GFP/ChR2-YFP (Bryson et al., 2014), and iHoxc8-V5 (Tan et al., 2016) ESCs were plated at 2.5×10⁵ cells/10 cm adherent tissue culture dishes (Nunc) in Differentiation Media containing Advanced D-MEM/F-12 (Life Technologies) and Neurobasal Medium (Life Technologies) at 1:1 ratio, 10% Knockout Serum Replacement (Life Technologies), 2 mM L-glutamine (Life Technologies), 0.1 mM β-mercaptoethanol (Sigma-Aldrich), and pen-strep. On Day 2 of differentiation, EBs were collected, spun down and split 1:4 into 10 cm non-adherent tissue culture dishes (Corning) and supplemented with 1 μM RA (Sigma-Aldrich) and 500 nM smoothened agonist (SAG, Calbiochem). Media was exchanged on Day 4 of differentiation with RA and SAG replacement. For induction of iHoxc8-V5, 3 μg/mL doxycycline (dox) was added on late Day 3. The endpoint of MN differentiation was Day 6, after which MNs were dissociated and sorted using FACS for co-culture studies.
ESC-to-V1 IN differentiation was performed largely as described for MN differentiation, with the following modifications: En1-tdTomato or En1-GFP ESCs were plated at density of 7.0×10⁵ cells/10 cm dish. On Day 2 of differentiation, EBs were collected, spun down and split 1:6 and supplemented with 1 μM RA and 5 nM SAG. Media was exchanged on Days 4 and 6 of differentiation with RA and SAG replacement, except in RA signaling replacement studies. The endpoint of V1 IN differentiation was generally Day 8, after which EBs were collected for immunostaining or dissociated and sorted using FACS for RNA-seq or co-culture studies.
ESC-to-dI4 IN differentiation was performed as described for V1 IN differentiation, with the following modifications: Ptf1a-tdTomato ESCs were plated at density of 8.0×10⁵ cells/10 cm. On Day 2 of differentiation, EBs were collected, spun down and split 1:4 and supplemented with 1 μM RA. Media was exchanged on Day 4 and 6 of differentiation with RA replacement. The endpoint of dI4 IN differentiation was Day 8.
Quantification of marker expression
EBs typically contain ~20,000–25,000 total cells by Day 8 of differentiation. Under 1 μM RA and 5 nM SAG conditions, we obtain approximately 7,000 ES-V1 INs per EB, or 30%–35% the total number of cells. In each EB, 1,100–1,300 cells are Cb-expressing RCs, i.e., 15%–20% of ES-V1 INs or 4.5%–6.5% of total cells. In general, subtype quantifications are based on marker expression per section, with ~20 sections per EB. For example, atypical section on Day 8 contains 1,000 total cells, of which 320 are V1 INs, with 50–60 Cb-expressing RCs and 100–120 Foxp2-expressing ES-V1 INs per section.
Flow cytometry of reporter cells
To determine differentiation efficiency, EBs were dissociated with 0.05% trypsin (Life Technologies) and manually triturated in Dissociation Buffer containing 1X PBS without Ca2+/Mg2+ (Fisher Scientific), 3% FBS, 2.5% 1 M glucose (Sigma-Aldrich), 0.5% 1 M MgCl2 (Sigma-Aldrich), 2 mM L-glutamine and pen-strep, supplemented with DNase I (1 μg/mL, Sigma-Aldrich). Following filtering through 40 μm cell strainer, En1-tdTomato/GFP or Ptf1a-tdTomato cells were sorted from the cell suspension with BD Biosciences FACSCalibur Cell Analyzer using CellQuest Pro Software.
FACS and culture of ESC-derived neurons
Day 8 V1 and dI4 IN and Day 6 MN EBs were dissociated using 0.05% trypsin, manually triturated in Dissociation Buffer, filtered through 40 μm cell strainer, and sorted using FACS (BD FACSAria Cell Sorter) to collect tdTomato or GFP cells. Sorted cells were plated on 15 mm coverslips (Fisher Scientific) in 4-well dishes (Nunc). Coverslips were first sterilized by incubation for 2 min in plasma cleaner (Harrick Plasma), coated overnight in 0.0001% poly-L-ornithine (Sigma-Aldrich) diluted in sterile water at 37°C, then 3 hours at 37°C with laminin (5 ng/mL, Life Technologies) and fibronectin (10 ng/mL, Sigma-Aldrich). For synapse assays, a monolayer of primary cortical astrocytes was plated on top of laminin only-coated coverslips. Dissociated neurons were plated in Neuronal Media containing: Neurobasal media, 2% B-27 Supplement (Life Technologies), 2% FBS, 0.1 mM β-mercaptoethanol, L-glutamine, and pen-strep, supplemented with 10 ng/mL glial-derived neurotrophic factor (Gdnf, R&D Systems) and 1 μM 5-fluoro-2’-deoxyuridine (5-FDU, Sigma-Aldrich) to inhibit non-neuronal and dividing cells, with half or full media exchange every 2 days. Post-culture, cells were fixed in 4% PFA for 10 min at room temperature (RT) and processed for immunocytochemistry (ICC).
Preparation of EBs for immunohistochemistry
EBs were generally collected on Day 8 of V1 and dI4 IN differentiation and fixed in 4% paraformaldehyde (PFA, ThermoScientific) for 15 minutes at 4°C, followed by 3×10 min 1X PBS wash steps. EBs were incubated in 30% sucrose (in 1X PBS with 0.05% NaN3, Sigma-Aldrich) at 4°C, until equilibrated. EBs were then deposited into square molds (Polysciences), filled with Optimal Cutting Temperature (OCT, Tissue-Tek) embedding media, frozen in dry ice, and stored at −80°C for cryosectioning. EBs were cryosectioned at 14 μm and collected on SuperFrost Plus glass slides (ThermoScientific) for immunostaining.
Immunohistochemistry/immunocytochemistry
Tissues were blocked with 10% donkey serum (DS) (EMD Millipore), 0.2% Triton X-100 (Sigma-Aldrich) in 1X PBS, and 0.05% NaN3 for 20–30 min at RT, followed by primary antibody staining overnight or 4 hours at RT. The same solution was used to dilute primary and secondary antibodies: 2% DS, 0.2% Triton X-100 in 1X PBS and 0.05% NaN3. After washing in 0.2% Triton X-100, secondary antibody (1:800, Cy3/Cy5/Alexa488/Alexa405 dyes, Jackson Immunoresearch Laboratories) was applied for 2 hours at RT. After washes, coverslips were mounted with Aqua-Poly/Mount (Polysciences, Inc.).
V1 IN and MN mixing
Day 5 En1-tdTomato EBs and Day 6 Hb9::GFP or iHoxc8-V5 EBs were spun down, washed 3× in 1X PBS and mixed in 1:1 ratio in 10 cm non-adherent dishes in Differentiation Media supplemented with Gdnf and dox as needed. 1 μM RA and/or 5 nM SAG was replaced as needed. EBs were collected on Day 8 and processed for immunostaining. For vitamin A depletion studies, EB co-cultures were grown in Differentiation Media containing 2% B-27 Supplement without vitamin A (Life Technologies), 1% N-2 Supplement (Life Technologies), 0.1 mM β-mercaptoethanol, and pen-strep, supplemented with Gdnf and dox.
Notch inhibition
To pharmacologically inhibit Notch signaling, DAPT was added on early Day 4 for p1 progenitors at concentration 5 μg/mL in DMSO (Selleck Chemicals). To genetically inhibit Notch signaling, mESCs expressing DnMaml1-eGFP under the control of a doxycycline-inducible promoter were differentiated to ES-V1 INs as described, with dox (2 μg/mL) added on late Day 3 of differentiation. A similar approach was used to genetically activate Notch signaling, using an ESC line carrying inducible NICD-V5.
BrdU labeling
To perform BrdU birthdating ofV1 INs, 1 μM BrdU (LifeTechnologies) wasadded on each day of differentiation from Days3–7 for 10 hours, then washed off to prevent toxicity. To detect BrdU-labeled cells, EBs were stained as described above, then post-fixed for 10 minutes in 4% PFAat RT, followed by 1X PBS wash steps. Subsequently, 1 N hydrochloric acid (HCl) (Sigma-Aldrich) was applied onto slides for 20–30 min at 37°C, followed by wash steps in 1X PBS. Rat anti-BrdU antibody was then applied at 1:2000 (Accurate Chemical).
Chick spinal cord transplants
Chick transplantations were performed as described in (Peljto and Wichterle, 2011; Wichterle et al., 2002). Fertilized eggs from Charles River were incubated at 38.5°C in > 70% humidified chamber. Early EBs from En1-GFP V1 (Day 5) and Ptf1a-tdTomato dI4 (Day 6) IN differentiations were transplanted into Hamburger-Hamilton (HH) Stage 16 spinal cord, which was suction lesioned to accommodate transplanted tissue. Half-to-one EB equivalent was transplanted into a segment spanning 2–5 somites at rostral levels (cervical/brachial) of the spinal cord. For migration analyses, embryos were harvested after 4 days (HH Stage 30) and examined for successful graft placement under fluorescent microscope. For VAChT synapses, embryos were harvested 7 days post-transplant (HH Stage 36). Spinal cords were dissected, with ventral laminectomy performed in Stage 36 embryos, fixed with 4% PFA for 1–1.5 hour, cryoprotected overnight using 30% sucrose, and embedded into OCT-filled plastic molds before freezing with dry ice. Tissue blocks were stored at −80°C for cryosectioning (30 μm).
RNA purification for qRT-PCR and RNA-sequencing
For qRT-PCR, EBs were collected on Day 8 and spun down, followed by RNA extraction. For RNA-seq, EBs were collected and spun down, dissociated for FACS, followed by RNA extraction. TRIzol or TRIzol LS Reagent (Life Technologies) was used for RNA extraction, followed by flash freezing in liquid nitrogen and storage at −80°C until further processing. RNA as separated from DNA and protein fractions using chloroform (Sigma-Aldrich) with Phase Lock Gel columns (5 Prime). RNA supernatant was further purified using RNeasy (QIAGEN) spin column mini kits. For qRT-PCR, DNA was prepared using Superscript III Reverse Transcriptase (Life Technologies). cDNA was then mixed with 0.5 μM primers and 2X SYBR Green qRT-PCR mix (Stratagene) with ROX reference and analyzed using MX300P qPCR system (Strategene). For RNA-seq, RNA concentration and quality was screened using Bioanalyzer (Agilent) and then submitted to JP Sulzberger Genome Center (Columbia University Irving Medical Center) for Illumina TruSeq RNA prep with poly-A pull-down to enrich mRNA. Libraries were then sequenced using Illumina HiSeq2000 (30 million, single-end 100 bp reads).
RNA-seq analysis
RTA (Illumina) was used for base calling and bcl2fastq (version 1.8.4) for converting BCL to fastq format, coupled with adaptor trimming. Reads were then mapped to reference genome (UCSC/mm9) using Tophat (version 2.1.0) with 4 mismatches and 10 maximum multiple hits. The relative abundance (aka expression level) of genes and splice isoforms was estimated using Cufflinks (version 2.0.2) with default settings. Differentially expressed genes under various conditions using DEseq2, an R package based on a negative binomial distribution that models the number reads from RNA-seq experiments and test for differential expression. Differentially expressed genes were identified by > 2 log2fold change (for single developmental stage only) or log2TPM (transcripts per million, for comparisons across developmental stages) and p-adjusted < 0.01. Heatmaps and scatterplots were generated with R packages. Clustering was also performed using R, with ward.D2 as the distance metric for all samples.
Motor neuron and IN co-culture
Day 6 MN EBs were dissociated for FACS (Hb9::GFP) or MACS (Hb9::Cd14-IRES-GFP) (Miltenyi-Biotec). MACS purification was performed as described in (Bryson et al., 2014), using mouse IgG anti-human CD14 (clone UCHM-1, AbD Serotec) primary antibody (5 μg/mL) and 1:10 goat anti-mouse IgG microbeads (Miltenyi-Biotec). For VAChT-immunoreactivity and optogenetics-electrophysiology studies, V1 INs were differentiated with DAPT added on Day 4 and to enrich for RCs. For all other studies ES-V1 and ES-dI4 INs were differentiated using standard protocols, collected on Day 8 for dissociation and FACS purification, and plated with ES-MNs. For co-culture studies, 50–100,000 sorted cells were plated on astrocyte monolayer, with survival of ~1/10 cells after 2 weeks in culture. For electrophysiology, a 1:3 ratio MN:V1 INs was used for most experiments. Changing the densities and ratios of cells within a certain range (1:1 up to 1:20 ratio and 25,000 to 150,000 cells) produced small, but not statistically significant, changes.
Primary cortical astrocyte culture
Astrocytes were prepared from postnatal day 0 to 5 wild-type C57BL/6 mice as described (Albuquerque et al., 2009). ~20–25,000 cells were seeded on laminin-coated glass coverslips in astrocyte media containing Advanced D-MEM/F-12,10% FBS, L-glutamine, and pen-strep. Astrocytes were expanded to confluence before neuronal cultures were added.
Generation of transgenic TVA-G ESC line
To generate the TVA-G monosynaptic tracing allele, cDNA encoding TVA and Rabies-G was excised from pBOB-synP-HTB (Addgene plasmid #30195; (Miyamichi et al., 2011) and subcloned into a custom pminiTol2 expression construct (Addgene plasmid #31829; (Balciunas et al., 2006) harboring a PGK promoter (pPL451; (Liu et al., 2003), hygromycin resistance cassette (pCEP4, ThermoFisher Scientific) and BGH poly-A sequence (pcdDNA3.1, Invitrogen) using high-fideity Phusion polymerase (New England Biolabs) and In-Fusion HD Cloning System (Clontech). The TVA-G Tol2 transfer vector was nucleofected into Hb9::GFP ESCs with pCMV-Tol2 transposase (Addgene plasmid #31823, (Balciunas et al., 2006) using Amaxa Nucleofector Kit for Neural Stem Cells (Lonza), followed by hygromycin selection (Sigma-Aldrich). Selected clones were differentiated using standard RA/SAG protocol to generate MNs. A red fluorescent protein variant (dsRed) of SADB19ΔG RABV was added at low titer to Day 6 EBs to assess efficiency of viral transfer.
Monosynaptic RABV tracing in vitro
Day 6 Hb9::GFP MN EBs carrying TVA-G transgene for RABV initial infection and Day 8 En1-tdTomato EBs were FACS purified and co-cultured for one week on astrocyte monolayer, with half-media exchange every other day. A small volume (1 μL) of low titer SADB19ΔG-GFP RABV (Wickersham et al., 2007a; Wickersham et al., 2007b) was added directly to media, then removed after 2 days. After RABV treatment, cells were cultured for an additional 4 or 7 days, then fixed in 4% PFA and prepared for ICC.
Connectivity Index
The connectivity index (C.I.) was calculated to take into account cell prevalence in the culture. The percentage of synaptically connected (i.e., RABV-infected) ES-V1 INs expressing Cb, Foxp2, or neither marker (“none”) was divided by the overall percentage of ES-V1 INs expressing Cb, Foxp2, or none in the culture. C.I. = 1.0 indicates that the subtype is equally likely to be monosynaptically connected to motor neurons as not; C.I. > 1.0 indicates higher likelihood relative to their prevalence in culture; C.I. <1.0 indicates lower likelihood.
V1 IN electrophysiology
Glass coverslips containing En1-tdTomato and Hb9::GFP or Hb9::CD14-IRES-GFP/ChR2-YFP MNs on astrocyte monolayer were transferred to a customized recording chamber under an SP5 Leica confocal microscope equipped with 4 single laser lines (405, 488, 543, 650nm). The recording chamber was filled with HEPES buffer consisting of: 145mM NaCl, 3mM KCl, 1mM MgCl2, 1.5mM CaCl2, 10mM glucose, and 10mM HEPES adjusted to pH 7.4 with NaOH. Electrodes were pulled with a P1000 puller (Sutter) to resistance of 10–15MΩ. Recording electrodes were filled with intracellular solution containing: 10 mM NaCl, 130 mM K-Gluconate, 10 mM HEPES, 1 mM EGTA, 1 mM MgCl2, 0.1 mM CaCl2, 1 mM Na2ATP, and fluorescent dye (Cascade Blue or Neurobiotin), pH adjusted to 7.2–7.3 with KOH (the final osmolarity of the intracellular solution was 295–299 mOsm).
ES-V1 INs were visually targeted by their endogenous tdTomato fluorescence. Whole-cell patch-clamp recordings were performed in current-clamp setting to characterize the intrinsic membrane properties of En1-tdTomato fluorescent cells, as well as their firing patterns in response to injected increments of current steps, using standard patch-clamp protocols. Recordings were accepted for analysis if they had a resting membrane potential of −35 mV or lower and overshooting action potentials. The passive membrane properties of V1 INs were assessed by injection of negative and positive steps of current (100–300 ms duration) at −60 mV holding membrane potential. The input resistance was calculated from the slope of the linear current-to-voltage relationship. Cascade Blue/Neurobiotin-filled recorded cells were subsequently fixed in 4% PFA for 10 min for post hoc ICC to detect for V1 IN subtype-specific markers.
For firing pattern analysis, we characterized the neurons as: (i) single action potential firing, independent of the current injected; (ii) “burst” firing, characterized by a phasic discharge of two or more action potentials, occurring within the first 200 ms of the beginning of the depolarizing pulse; in contrast to “adaptive” firing, evidenced by a reduction in firing frequency throughout the entire duration (1 s) of the current injection; (iii) burst/tonic discharge, which was characterized by an initial burst for the first 100–200 ms followed by irregular sustained firing for the rest of the current pulse duration; and (iv) tonic firing, a continuous sustained firing with regular interspike intervals throughout the current injection.
Optogenetic stimulation
Hb9::CD14-IRES-GFP/ChR2-YFP MNs were photostimulated with 470nm light pulses (25 ms duration) from a LED source (CoolLED) while whole-cell patch-clamp recordings of En1-tdTomato fluorescent cells were performed to assess for depolarization in response to MN synaptic inputs. In some experiments, the cholinergic receptor antagonists atropine (5 μM) and mecamylamine (50 μM) were applied to the bath solution. We calculated the latency of V1 IN response relative to the onset of the MN action potential. To confirm that the response was monosynaptic, we subjected V1 INs to multiple trials at different stimulation frequencies (0.1 and 1 Hz) to determine the jitter, or variability, of V1 IN response onset, calculated as the coefficient of variation (Bikoff et al., 2016; Shneider et al., 2009). Cascade Blue/Neurobiotin-filled En1-tdTomato cells were fixed with 4% PFA and prepared for post hoc ICC.
QUANTIFICATION AND STATISTICAL ANALYSIS
Imaging
All EB and mouse/chick spinal cord images were acquired with 20X, 40X oil or 63X oil objectives using confocal laser scanning microscope (LSM Zeiss Meta 510 or 780). For dissociated neuron cultures, images were acquired with Zeiss AxioObserver with Coolsnap HQ2 camera (Photometrics) or LSM Zeiss Meta 510 or 780 with 10X, 20X, and 40Xobjectives. Images were analyzed offline using Image-J.
V1 and dI4 IN molecular marker analysis
Confocal images of EBs were taken at 20X objective and processed in Image-J for counting using the Cell Counter plugin for manual counting. The number of cells that co-expressed the marker and reporter was counted and divided by the total number of fluorescent reporter cells in the EB. At least five EBs were counted for each experiment with at least 3 independent experiments for calculation of mean ± SEM.
Transplants
To quantify migration of transplanted En1-GFPand Ptf1a-tdTomato fluorescent cells, spinal cord images were taken at 20X objective on confocal microscope and processed in Image-J. At least four transplants were used for either V1 or dI4 IN quantifications. Each image was aligned dorsoventrally and then divided into 6 equal bins and the number of reporter cells in each bin was counted to plot the fraction of total reporter cells in each of the bins. To quantify subtype migration of Cb or Foxp2-expressing V1 INs, 4–6 transplants were stained for both Cb and Foxp2 were examined. Multiple spinal cord images were overlayed and then an average spinal cord area was calculated. Subsequently, positional coordinates of Cb and Foxp2-expressing cells were determined using Image-J and normalized to the average spinal cord area, with the most dorsal/lateral positions represented as 1 and the most ventral/medial as 0. A scatterplot of subtype distribution was generated in MATLAB, while quantification of subtype position was performed by generating 20 different mediolateral or dorsoventral bins.
Dissociated cells
Cultured neurons on coverslips were immunostained and imaged using Zeiss AxioObserver inverted microscope with 20X or 40X objective. Typically, the entire glass coverslip was counted for total number of reporter cells and cells co-expressing protein of interest. At least 2 coverslips from each experiment was used, with at least 3 independent experiments, for calculation of mean ± SEM.
Statistics
Statistics were performed using two-tailed, unpaired Student’s t test or one-way ANOVA. Relevant p values: *p < 0.05, **p < 0.01, ***p < 0.001.
DATA AND SOFTWARE AVAILABILITY
The accession number for the RNA sequencing data from ES-V1 and ES-dI4 INs reported in this paper is GSE1123277.
Supplementary Material
Highlights.
In vitro-differentiated cells recapitulate spinal V1 interneuron diversity
V1 interneuron subtype diversification is modulated by Notch and retinoid signaling
Migration of xenografted Renshaw cells is controlled by intrinsic species-specific programs
Renshaw cell-motor neuron synaptic specificity can be modeled in cell culture
ACKNOWLEDGMENTS
We thank Julia Kaltschmidt for providing Ptf1a lineage-traced mice, Ivo Lie-beram for the Hb9::Cd14-IRES-GFP/ChR2-YFP ESC line, Thomas Reardon for the SADB19ΔG-GFP RABV, and Susan Morton for providing many anti-bodies essential for this study. We thank members of the Wichterle lab, especially Chris Tan for discussion of Notch signaling and Michael Closser for assistance with gene expression analysis. P.T.H. was funded by NIH NRSA fellowship F30NS092262 and NIH training grants T32NS064928 and T32GM007367. J.I.C. was funded by NIH NRSA fellowship F30NS098551. H.W. is a recipient of the Jerry and Emily Spiegel endowed chair. This work was supported by Project ALS, Target ALS, and NIH grants NS078097 and NS092043 (to H.W.), NS033245 (to T.M.J.), and NS078375 (to G.Z.M.).
Footnotes
SUPPLEMENTAL INFORMATION
Supplemental Information includes seven figures and can be found with this article online at https://doi.org/10.10167j.neuron.2018.09.016.
DECLARATION OF INTERESTS
The authors declare no competing interests.
REFERENCES
- Abbondanzo SJ, Gadi I, and Stewart CL (1993). Derivation of embryonic stem cell lines. Methods Enzymol. 225, 803–823. [DOI] [PubMed] [Google Scholar]
- Albuquerque C, Joseph DJ, Choudhury P, and MacDermott AB (2009). Dissection, plating, and maintenance of cortical astrocyte cultures. Cold Spring Harb. Protoc. 2009, pdb.prot5273. [DOI] [PubMed] [Google Scholar]
- Alvarez FJ, and Fyffe RE (2007). The continuing case for the Renshaw cell. J. Physiol. 584, 31–45. [DOI] [PMC free article] [PubMed] [Google Scholar]
- Alvarez FJ, Benito-Gonzalez A, and Siembab VC (2013). Principles of interneuron development learned from Renshaw cells and the motoneuron recurrent inhibitory circuit. Ann. N Y Acad. Sci. 1279, 22–31. [DOI] [PMC free article] [PubMed] [Google Scholar]
- Balciunas D, Wangensteen KJ, Wilber A, Bell J, Geurts A, Sivasubbu S, Wang X, Hackett PB, Largaespada DA, McIvor RS, and Ekker SC (2006). Harnessing a high cargo-capacity transposon for genetic applications in vertebrates. PLoS Genet. 2, e169. [DOI] [PMC free article] [PubMed] [Google Scholar]
- Benito-Gonzalez A, and Alvarez FJ (2012). Renshaw cells and Ia inhibitory interneurons are generated at different times from p1 progenitors and differentiate shortly after exiting the cell cycle. J. Neurosci. 32, 1156–1170. [DOI] [PMC free article] [PubMed] [Google Scholar]
- Berki AC, O’Donovan MJ, and Antal M (1995). Developmental expression of glycine immunoreactivity and its colocalization with GABA in the embryonic chick lumbosacral spinal cord. J. Comp. Neurol. 362, 583–596. [DOI] [PubMed] [Google Scholar]
- Bhumbra GS, Bannatyne BA, Watanabe M, Todd AJ, Maxwell DJ, and Beato M (2014). The recurrent case for the Renshaw cell. J. Neurosci. 34, 12919–12932. [DOI] [PMC free article] [PubMed] [Google Scholar]
- Bikoff JB, Gabitto MI, Rivard AF, Drobac E, Machado TA, Miri A, Brenner-Morton S, Famojure E, Diaz C, Alvarez FJ, et al. (2016). Spinal inhibitory interneuron diversity delineates variant motor microcircuits. Cell 165, 207–219. [DOI] [PMC free article] [PubMed] [Google Scholar]
- Briscoe J, and Ericson J (2001). Specification of neuronal fates in theventral neural tube. Curr. Opin. Neurobiol. 11, 43–49. [DOI] [PubMed] [Google Scholar]
- Bryson JB, Machado CB, Crossley M, Stevenson D, Bros-Facer V, Burrone J, Greensmith L, and Lieberam I (2014). Optical control of muscle function by transplantation of stem cell-derived motor neurons in mice. Science 344, 94–97. [DOI] [PMC free article] [PubMed] [Google Scholar]
- Bui TV, Cushing S, Dewey D, Fyffe RE, and Rose PK (2003). Comparison of the morphological and electrotonic properties of Renshaw cells, Ia inhibitory interneurons, and motoneurons in the cat. J. Neurophysiol. 90, 2900–2918. [DOI] [PubMed] [Google Scholar]
- Burrill JD, Moran L, Goulding MD, and Saueressig H (1997). PAX2 is expressed in multiple spinal cord interneurons, including a population of EN1+interneurons that require PAX6 for their development. Development 124, 4493–4503. [DOI] [PubMed] [Google Scholar]
- Campbell JN, Macosko EZ, Fenselau H, Pers TH, Lyubetskaya A, Tenen D, Goldman M, Verstegen AM, Resch JM, McCarroll SA, et al. (2017). A molecular census of arcuate hypothalamus and median eminence cell types. Nat. Neurosci. 20, 484–496. [DOI] [PMC free article] [PubMed] [Google Scholar]
- Cepko C (2014). Intrinsically different retinal progenitor cells produce specific types of progeny. Nat. Rev. Neurosci. 15, 615–627. [DOI] [PubMed] [Google Scholar]
- Chen JA, Huang YP, Mazzoni EO, Tan GC, Zavadil J, and Wichterle H (2011). Mir-17–3p controls spinal neural progenitor patterning by regulating Olig2/Irx3 cross-repressive loop. Neuron 69, 721–735. [DOI] [PMC free article] [PubMed] [Google Scholar]
- Chung WS, Allen NJ, and Eroglu C (2015). Astrocytes control synapse formation, function, and elimination. Cold Spring Harb. Perspect. Biol. 7, a020370. [DOI] [PMC free article] [PubMed] [Google Scholar]
- Clarke LE, and Barres BA (2013). Emerging roles of astrocytes in neural circuit development. Nat. Rev. Neurosci. 14, 311–321. [DOI] [PMC free article] [PubMed] [Google Scholar]
- Coulon P, Bras H, and Vinay L (2011). Characterization of last-order premotor interneurons by transneuronal tracing with rabies virus in the neonatal mouse spinal cord. J. Comp. Neurol. 519, 3470–3487. [DOI] [PubMed] [Google Scholar]
- Dasen JS, and Jessell TM (2009). Hox networks and the origins of motor neuron diversity. Curr. Top. Dev. Biol. 88, 169–200. [DOI] [PubMed] [Google Scholar]
- Eccles JC, Fatt P, and Koketsu K (1954). Cholinergic and inhibitory synapses in a pathway from motor-axon collaterals to motoneurones. J. Physiol. 126, 524–562. [DOI] [PMC free article] [PubMed] [Google Scholar]
- Eccles JC, Eccles RM, Iggo A, and Lundberg A (1961). Electrophysiological investigations on Renshaw cells. J. Physiol. 159, 461–478. [DOI] [PMC free article] [PubMed] [Google Scholar]
- Francius C, Harris A, Rucchin V, Hendricks TJ, Stam FJ, Barber M, Kurek D, Grosveld FG, Pierani A, Goulding M, and Clotman F (2013). Identification of multiple subsets of ventral interneurons and differential distribution along the rostrocaudal axis of the developing spinal cord. PLoS ONE 8, e70325. [DOI] [PMC free article] [PubMed] [Google Scholar]
- Fyffe RE (1990). Evidence for separate morphological classes of Renshaw cells in the cat’s spinal cord. Brain Res. 536, 301–304. [DOI] [PubMed] [Google Scholar]
- Gabitto MI, Pakman A, Bikoff JB, Abbott LF, Jessell TM, and Paninski L (2016). Bayesian sparse regression analysis documents the diversity of spinal inhibitory interneurons. Cell 165, 220–233. [DOI] [PMC free article] [PubMed] [Google Scholar]
- Gao BX, Stricker C, and Ziskind-Conhaim L (2001). Transition from GABAergic to glycinergic synaptic transmission in newly formed spinal networks. J. Neurophysiol. 86, 492–502. [DOI] [PubMed] [Google Scholar]
- Geisen MJ, Di Meglio T, Pasqualetti M, Ducret S, Brunet JF, Chedotal A, and Rijli FM (2008). Hox paralog group 2 genes control the migration of mouse pontine neurons through slit-robo signaling. PLoS Biol. 6, e142. [DOI] [PMC free article] [PubMed] [Google Scholar]
- Glasgow SM, Henke RM, Macdonald RJ, Wright CV, and Johnson JE (2005). Ptf1a determines GABAergic over glutamatergic neuronal cell fate in the spinal cord dorsal horn. Development 132, 5461–5469. [DOI] [PubMed] [Google Scholar]
- González-Forero D, and Alvarez FJ (2005). Differential postnatal maturation of GABAA, glycine receptor, and mixed synaptic currents in Renshaw cells and ventral spinal interneurons. J. Neurosci. 25, 2010–2023. [DOI] [PMC free article] [PubMed] [Google Scholar]
- Goulding M (2009). Circuits controlling vertebrate locomotion: moving in a new direction. Nat. Rev. Neurosci. 10, 507–518. [DOI] [PMC free article] [PubMed] [Google Scholar]
- Hayashi M, Hinckley CA, Driscoll SP, Moore NJ, Levine AJ, Hilde KL, Sharma K, and Pfaff SL (2018). Graded arrays of spinal and supraspinal V2a interneuron subtypes underlie forelimb and hindlimb motor control. Neuron 97, 869–884.e5. [DOI] [PMC free article] [PubMed] [Google Scholar]
- Hebert JM, and Fishell G (2008). The genetics of early telencephalon patterning: some assembly required. Nat. Rev. Neurosci. 9, 678–685. [DOI] [PMC free article] [PubMed] [Google Scholar]
- Hoch RV, Rubenstein JL, and Pleasure S (2009). Genes and signaling events that establish regional patterning of the mammalian forebrain. Semin. Cell Dev. Biol. 20, 378–386. [DOI] [PubMed] [Google Scholar]
- Hollyday M, and Hamburger V (1977). An autoradiographic study of the formation of the lateral motor column in the chick embryo. Brain Res. 132, 197–208. [DOI] [PubMed] [Google Scholar]
- Jessell TM (2000). Neuronal specification in the spinal cord: inductive signals and transcriptional codes. Nat. Rev. Genet. 1, 20–29. [DOI] [PubMed] [Google Scholar]
- Jovanovic K, Pastor AM, and O’Donovan MJ (2010). The use of PRV-Bartha to define premotor inputs to lumbar motoneurons in the neonatal spinal cord of the mouse. PLoS ONE 5, e11743. [DOI] [PMC free article] [PubMed] [Google Scholar]
- Kawaguchi Y, Cooper B, Gannon M, Ray M, MacDonald RJ, and Wright CV (2002). The role of the transcriptional regulator Ptf1a in converting intestinal to pancreatic progenitors. Nat. Genet. 32, 128–134. [DOI] [PubMed] [Google Scholar]
- Kimmel RA, Turnbull DH, Blanquet V, Wurst W, Loomis CA, and Joyner AL (2000). Two lineage boundaries coordinate vertebrate apical ectodermal ridge formation. Genes Dev. 14, 1377–1389. [PMC free article] [PubMed] [Google Scholar]
- Liu P, Jenkins NA, and Copeland NG (2003). A highly efficient recombineering-based method for generating conditional knockout mutations. Genome Res. 13, 476–484. [DOI] [PMC free article] [PubMed] [Google Scholar]
- Livesey FJ, and Cepko CL (2001). Vertebrate neural cell-fate determination: lessons from the retina. Nat. Rev. Neurosci. 2, 109–118. [DOI] [PubMed] [Google Scholar]
- Maden M (2002). Retinoid signalling in the development of the central nervous system. Nat. Rev. Neurosci. 3, 843–853. [DOI] [PubMed] [Google Scholar]
- Madisen L, Zwingman TA, Sunkin SM, Oh SW, Zariwala HA, Gu H, Ng LL, Palmiter RD, Hawrylycz MJ, Jones AR, et al. (2010). A robust and high-throughput Cre reporting and characterization system for the whole mouse brain. Nat. Neurosci. 13, 133–140. [DOI] [PMC free article] [PubMed] [Google Scholar]
- Mahony S, Mazzoni EO, McCuine S, Young RA, Wichterle H, and Gifford DK (2011). Ligand-dependent dynamics of retinoic acid receptor binding during early neurogenesis. Genome Biol. 12, R2. [DOI] [PMC free article] [PubMed] [Google Scholar]
- Marklund U, Hansson EM, Sundström E, de Angelis MH, Przemeck GK, Lendahl U, Muhr J, and Ericson J (2010). Domain-specific control of neurogenesis achieved through patterned regulation of Notch ligand expression. Development 137, 437–445. [DOI] [PubMed] [Google Scholar]
- Mazzoni EO, Mahony S, Iacovino M, Morrison CA, Mountoufaris G, Closser M, Whyte WA, Young RA, Kyba M, Gifford DK, and Wichterle H (2011). Embryonic stem cell-based mapping of developmental transcriptional programs. Nat. Methods 8, 1056–1058. [DOI] [PMC free article] [PubMed] [Google Scholar]
- Mazzoni EO, Mahony S, Peljto M, Patel T, Thornton SR, McCuine S, Reeder C, Boyer LA, Young RA, Gifford DK, and Wichterle H (2013). Saltatory remodeling of Hox chromatin in response to rostrocaudal patterning signals. Nat. Neurosci. 76, 1191–1198. [DOI] [PMC free article] [PubMed] [Google Scholar]
- Mentis GZ, Siembab VC, Zerda R, O’Donovan MJ, and Alvarez FJ (2006). Primary afferent synapses on developing and adult Renshaw cells. J. Neurosci. 26, 13297–13310. [DOI] [PMC free article] [PubMed] [Google Scholar]
- Miyamichi K, Amat F, Moussavi F, Wang C, Wickersham I, Wall NR, Taniguchi H, Tasic B, Huang ZJ, He Z, et al. (2011). Cortical representations of olfactory input by trans-synaptic tracing. Nature 472, 191–196. [DOI] [PMC free article] [PubMed] [Google Scholar]
- Miyoshi G, Hjerling-Leffler J, Karayannis T, Sousa VH, Butt SJ, Battiste J, Johnson JE, Machold RP, and Fishell G (2010). Genetic fate mapping reveals that the caudal ganglionic eminence produces a large and diverse population of superficial cortical interneurons. J. Neurosci. 30, 1582–1594. [DOI] [PMC free article] [PubMed] [Google Scholar]
- Mizeracka K, DeMaso CR, and Cepko CL (2013). Notch1 is required in newly postmitotic cells to inhibit the rod photoreceptor fate. Development 740, 3188–3197. [DOI] [PMC free article] [PubMed] [Google Scholar]
- Moore NJ, Bhumbra GS, Foster JD, and Beato M (2015). Synaptic Connectivity between Renshaw Cells and Motoneurons in the Recurrent Inhibitory Circuit of the Spinal Cord. J. Neurosci. 35, 13673–13686. [DOI] [PMC free article] [PubMed] [Google Scholar]
- Morikawa Y, Hisaoka T, and Senba E (2009). Characterization of Foxp2-expressing cells in the developing spinal cord. Neuroscience 162, 1150–1162. [DOI] [PubMed] [Google Scholar]
- Muller T, Brohmann H, Pierani A, Heppenstall PA, Lewin GR, Jessell TM, and Birchmeier C (2002). The homeodomain factor lbx1 distinguishes two major programs of neuronal differentiation in the dorsal spinal cord. Neuron 34, 551–562. [DOI] [PubMed] [Google Scholar]
- Niederreither K, McCaffery P, Dräger UC, Chambon P, and Dollé P (1997). Restricted expression and retinoic acid-induced downregulation of the retinaldehyde dehydrogenase type2(RALDH-2) gene during mouse development. Mech. Dev. 62, 67–78. [DOI] [PubMed] [Google Scholar]
- Novitch BG, Wichterle H, Jessell TM, and Sockanathan S (2003). A requirement for retinoic acid-mediated transcriptional activation in ventral neural patterning and motor neuron specification. Neuron 40, 81–95. [DOI] [PubMed] [Google Scholar]
- Osakada F, Mori T, Cetin AH, Marshel JH, Virgen B, and Callaway EM (2011). New rabies virus variants for monitoring and manipulating activity and gene expression in defined neural circuits. Neuron 71, 617–631. [DOI] [PMC free article] [PubMed] [Google Scholar]
- Peljto M, and Wichterle H (2011). Programming embryonic stem cells to neuronal subtypes. Curr. Opin. Neurobiol. 27, 43–51. [DOI] [PMC free article] [PubMed] [Google Scholar]
- Peljto M, Dasen JS, Mazzoni EO, Jessell TM, and Wichterle H (2010). Functional diversity of ESC-derived motor neuron subtypes revealed through intraspinal transplantation. Cell Stem Cell 7, 355–366. [DOI] [PMC free article] [PubMed] [Google Scholar]
- Pfrieger FW, and Barres BA (1997). Synaptic efficacy enhanced by glial cells in vitro. Science 277, 1684–1687. [DOI] [PubMed] [Google Scholar]
- Phelps PE, Barber RP, Houser CR, Crawford GD, Salvaterra PM, and Vaughn JE (1984). Postnatal development of neurons containing choline acetyltransferase in rat spinal cord: an immunocytochemical study. J. Comp. Neurol. 229, 347–361. [DOI] [PubMed] [Google Scholar]
- Pierani A, Moran-Rivard L, Sunshine MJ, Littman DR, Goulding M, and Jessell TM (2001). Control of interneuron fate in the developing spinal cord by the progenitor homeodomain protein Dbx1. Neuron 29, 367–384. [DOI] [PubMed] [Google Scholar]
- Pillai A, Mansouri A, Behringer R, Westphal H, and Goulding M (2007). Lhx1 and Lhx5 maintain the inhibitory-neurotransmitter status of interneurons in the dorsal spinal cord. Development 134, 357–366. [DOI] [PubMed] [Google Scholar]
- Ramos C, Rocha S, Gaspar C, and Henrique D (2010). Two Notch ligands, Dll1 and Jag1, are differently restricted in their range of action to control neurogenesis in the mammalian spinal cord. PLoS ONE 5, e15515. [DOI] [PMC free article] [PubMed] [Google Scholar]
- Renshaw B (1946). Central effects of centripetal impulses in axons of spinal ventral roots. J. Neurophysiol. 9, 191–204. [DOI] [PubMed] [Google Scholar]
- Rhee HS, Closser M, Guo Y, Bashkirova EV, Tan GC, Gifford DK, and Wichterle H (2016). Expression of terminal effector genes in mammalian neurons is maintained by a dynamic relay of transient enhances. Neuron 92, 1252–1265. [DOI] [PMC free article] [PubMed] [Google Scholar]
- Sapir T, Geiman EJ, Wang Z, Velasquez T, Mitsui S, Yoshihara Y, Frank E, Alvarez FJ, and Goulding M (2004). Pax6 and engrailed 1 regulate two distinct aspects of renshawcell development. J. Neurosci. 24, 1255–1264. [DOI] [PMC free article] [PubMed] [Google Scholar]
- Saueressig H, Burrill J, and Goulding M (1999). Engrailed-1 and netrin-1 regulate axon pathfinding by association interneurons that project to motor neurons. Development 126, 4201–212. [DOI] [PubMed] [Google Scholar]
- Shneider NA, Mentis GZ, Schustak J, and O’Donovan MJ (2009). Functionally reduced sensorimotor connections form with normal specificity despite abnormal muscle spindle development: the role of spindle-derived neurotrophin 3. J. Neurosci. 29, 4719–4735. [DOI] [PMC free article] [PubMed] [Google Scholar]
- Sockanathan S, and Jessell TM (1998). Motor neuron-derived retinoid signaling specifies the subtype identity of spinal motor neurons. Cell 94, 503–514. [DOI] [PubMed] [Google Scholar]
- Sockanathan S, Perlmann T, and Jessell TM (2003). Retinoid receptor signaling in postmitotic motor neurons regulates rostrocaudal positional identity and axonal projection pattern. Neuron 40, 97–111. [DOI] [PubMed] [Google Scholar]
- Stam FJ, Hendricks TJ, Zhang J, Geiman EJ, Francius C, Labosky PA, Clotman F, and Goulding M (2012). Renshawcell interneuron specialization is controlled by a temporally restricted transcription factor program. Development 139, 179–190. [DOI] [PMC free article] [PubMed] [Google Scholar]
- Sternfeld MJ, Hinckley CA, Moore NJ, Pankratz MT, Hilde KL, Driscoll SP, Hayashi M, Amin ND, Bonanomi D, Gifford WD, et al. (2017). Speed and segmentation control mechanisms characterized in rhythmically-active circuits created from spinal neurons produced from genetically-tagged embryonic stem cells. eLife 6, e21540. [DOI] [PMC free article] [PubMed] [Google Scholar]
- Sürmeli G, Akay T, Ippolito GC, Tucker PW, and Jessell TM (2011). Patterns of spinal sensory-motor connectivity prescribed by a dorsoventral positional template. Cell 147, 653–665. [DOI] [PMC free article] [PubMed] [Google Scholar]
- Sweeney LB, Bikoff JB, Gabitto MI, Brenner-Morton S, Baek M, Yang JH, Tabak EG, Dasen JS, Kintner CR, and Jessell TM (2018). Origin and segmental diversity of spinal inhibitory interneurons. Neuron 97, 341–355.e3. [DOI] [PMC free article] [PubMed] [Google Scholar]
- Swindell EC, Thaller C, Sockanathan S, Petkovich M, Jessell TM, and Eichele G (1999). Complementary domains of retinoic acid production and degradation in the early chick embryo. Dev. Biol. 216, 282–296. [DOI] [PubMed] [Google Scholar]
- Tan GC, Mazzoni EO, and Wichterle H (2016). Iterative role of Notch signaling in spinal motor neuron diversification. Cell Rep. 16, 907–916. [DOI] [PMC free article] [PubMed] [Google Scholar]
- Tasic B, Menon V, Nguyen TN, Kim TK, Jarsky T, Yao Z, Levi B, Gray LT, Sorensen SA, Dolbeare T, et al. (2016). Adult mouse cortical cell taxonomy revealed by single cell transcriptomics. Nat. Neurosci. 19, 335–346. [DOI] [PMC free article] [PubMed] [Google Scholar]
- Thelie A, Desiderio S, Hanotel J, Quigley I, Van Driessche B, Rodari A, Borromeo MD, Kricha S, Lahaye F, Croce J, et al. (2015). Prdm12 specifies V1 interneurons through cross-repressive interactions with Dbx1 and Nkx6 genes in Xenopus. Development 142, 3416–3428. [DOI] [PMC free article] [PubMed] [Google Scholar]
- Thomas RC, and Wilson VJ (1965). Precise localization of Renshaw cells with a new marking technique. Nature 206, 211–213. [DOI] [PubMed] [Google Scholar]
- Tompers DM, Foreman RK, Wang Q, Kumanova M, and Labosky PA (2005). Foxd3 is required in the trophoblast progenitor cell lineage of the mouse embryo. Dev. Biol. 285, 126–137. [DOI] [PubMed] [Google Scholar]
- Vallstedt A, Muhr J, Pattyn A, Pierani A, Mendelsohn M, Sander M, Jessell TM, and Ericson J (2001). Different levels of repressor activity assign redundant and specific roles to Nkx6 genes in motor neuron and interneuron specification. Neuron 31, 743–755. [DOI] [PubMed] [Google Scholar]
- Walmsley B, and Tracey DJ(1981). An intracellular study of Renshawcells. Brain Res. 223, 170–175. [DOI] [PubMed] [Google Scholar]
- Wenner P, and O’Donovan MJ (1999). Identification of an interneuronal population that mediates recurrent inhibition of motoneurons in the developing chick spinal cord. J. Neurosci. 19, 7557–7567. [DOI] [PMC free article] [PubMed] [Google Scholar]
- Wetts R, and Vaughn JE (2001). Development of cholinergic terminals around rat spinal motor neurons and their potential relationship to developmental cell death. J. Comp. Neurol. 435, 171–183. [DOI] [PubMed] [Google Scholar]
- Wichterle H, and Peljto M (2008). Differentiation of mouse embryonic stem cells to spinal motor neurons. In Current Protocols in Stem Cell Biology, pp. H.1.1–H.1.9, Chapter 1, Unit 1. [DOI] [PubMed] [Google Scholar]
- Wichterle H, Lieberam I, Porter JA, and Jessell TM (2002). Directed differentiation of embryonic stem cells into motor neurons. Cell 110, 385–397. [DOI] [PubMed] [Google Scholar]
- Wickersham IR, Finke S, Conzelmann KK, and Callaway EM (2007a). Retrograde neuronal tracing with a deletion-mutant rabies virus. Nat. Methods 4, 47–49. [DOI] [PMC free article] [PubMed] [Google Scholar]
- Wickersham IR, Lyon DC, Barnard RJ, Mori T, Finke S, Conzelmann KK, Young JA, and Callaway EM (2007b). Monosynaptic restriction of transsynaptic tracing from single, genetically targeted neurons. Neuron 53, 639–647. [DOI] [PMC free article] [PubMed] [Google Scholar]
- Wildner H, Das Gupta R, Bröhl D, Heppenstall PA, Zeilhofer HU, and Birchmeier C (2013). Genome-wide expression analysis of Ptf1a-and Ascl1-deficient mice reveals new markers for distinct dorsal horn interneuron populations contributing to nociceptive reflex plasticity. J. Neurosci. 33, 7299–7307. [DOI] [PMC free article] [PubMed] [Google Scholar]
- Wilson JM, Rempel J, and Brownstone RM (2004). Postnatal development of cholinergic synapses on mouse spinal motoneurons. J. Comp. Neurol. 474, 13–23. [DOI] [PubMed] [Google Scholar]
- Wong ES, Ban KH, Mutalif R, Jenkins NA, Copeland NG, and Stewart CL (2010). A simple procedure for the efficient derivation of mouse ES cells. Methods Enzymol. 476, 265–283. [DOI] [PubMed] [Google Scholar]
- Xu H, Whelan PJ, and Wenner P (2005). Development of an inhibitory interneuronal circuit in the embryonic spinal cord. J. Neurophysiol. 93, 2922–2933. [DOI] [PubMed] [Google Scholar]
- Zagoraiou L, Akay T, Martin JF, Brownstone RM, Jessell TM, and Miles GB (2009). A cluster of cholinergic premotor interneurons modulates mouse locomotor activity. Neuron 64, 645–662. [DOI] [PMC free article] [PubMed] [Google Scholar]
- Zannino DA, Downes GB, and Sagerstrom CG (2014). prdm12bspecifies the p1 progenitor domain and reveals a role for V1 interneurons in swim movements. Dev. Biol. 390, 247–260. [DOI] [PMC free article] [PubMed] [Google Scholar]
- Zhang J, Lanuza GM, Britz O, Wang Z, Siembab VC, Zhang Y, Velasquez T, Alvarez FJ, Frank E, and Goulding M (2014). V1 and V2b interneurons secure the alternating flexor-extensor motor activity mice require for limbed locomotion. Neuron 82, 138–150. [DOI] [PMC free article] [PubMed] [Google Scholar]
Associated Data
This section collects any data citations, data availability statements, or supplementary materials included in this article.
Supplementary Materials
Data Availability Statement
The accession number for the RNA sequencing data from ES-V1 and ES-dI4 INs reported in this paper is GSE1123277.