Abstract
Purpose
Retinal angiography evaluates retinal and choroidal perfusion and vascular integrity and is used to manage many ophthalmic diseases, such as age-related macular degeneration. The most common method, fluorescein angiography (FA), is invasive and can lead to untoward effects. As an emerging replacement, noninvasive OCT angiography (OCTA) is used regularly as a dye-free substitute with superior resolution and additional depth-sectioning abilities; however, general trends in FA as signified by varying intensity in images are not always reproducible in the fine structural detail in an OCTA image stack because of the source of their respective signals, OCT speckle decorrelation versus fluorescein emission.
Methods
We present a noninvasive/dye-free analog to angiography imaging using retinal hyperspectral imaging with a nonscanning spectral imager, the image mapping spectrometer (IMS), to reproduce perfusion-related data based on the abundance of oxyhemoglobin (HbO2) in the retina. With a new unmixing procedure of the IMS-acquired spectral data cubes (350 × 350 × 43), we produced noninvasive HbO2 maps unmixed from reflectance spectra.
Results
Here, we present 15 HbO2 maps from seven healthy and eight diseased retinas and compare these maps with corresponding FA and OCTA results with a discussion of each technique.
Conclusions
Our maps showed visual agreement with hypo- and hyperfluorescence trends in venous phase FA images, suggesting that our method provides a new use for hyperspectral imaging as a noninvasive angiography-analog technique and as a complementary technique to OCTA.
Translational Relevance
The application of hyperspectral imaging and spectral analysis can potentially improve/broaden retinal disease screening and enable a noninvasive technique, which complements OCTA.
Keywords: hyperspectral imaging, spectral unmixing, retinal imaging, oxygen abundance in tissue, dye-free analog to angiography
Introduction
Retinal vascular disease accounts for a significant proportion of vision-threatening ophthalmic pathology. For example, a leading cause of blindness in the adult population is age-related macular degeneration (AMD), which is predicted to affect 3 million Americans in 2020.1 Currently, the most common method of imaging the retinal circulation is fluorescein angiography (FA) in which a dye (sodium fluorescein) is injected intravenously and images are sequentially acquired. Various patterns (e.g., pooling, staining, leakage, and dropout) observed over the angiography time course provide important clinical information regarding the patient's retinal health.2 The integration of FA in the clinic setting provided a great technological step forward that revolutionized ophthalmic diagnosis and treatment. However, FA can be associated with potential adverse effects, such as nausea (3%–15% of patients), vomiting (up to 7% of patients), and pruritus; more rarely, it can cause cardiac arrest, clonic seizures, and even death.2–4 These side effects in concurrence with its invasiveness and procedure length are concerns when considering its use in patients. Nevertheless, FA remains the gold standard for evaluating retinal vasculature. Recent increases in A-scan acquisition speed have led to the development of optical coherence tomography angiography (OCTA), a new imaging modality based on signal decorrelation between consecutive transverse cross-sectional OCT (optical coherence tomography) scans from which differences are caused by the backscattering of OCT signal from moving erythrocytes.5–10 OCT promises to provide a fast, safe, and noninvasive method for the detection of neovascularization11 and other vascular abnormalities12 without the side-effects of FA. Clinical investigations to demonstrate its diagnostic sensitivity for specific diseases are currently in progress with developments occurring at a fairly rapid pace.13 However, OCTA instruments are presently limited to one dimension of retinal function, flow visualization over a small time window, whereas other functional measurements, such as biomarker abundance and oxygen content, are not captured. The dynamic properties of dye during an FA exam and an indocyanine green angiography (ICG) exam, a similar but distinct technique, are closely related to the abundance of pigments in the eye and their absorbance of emission wavelengths in the visible spectrum. The diameter size of retinal and choroidal vessels plays a role in modulating emission intensity as greater amounts of unbound fluorescing dye molecules are able to accumulate in larger volume vessel cavities and in regions with high blood content. This is visually apparent in FA exams: high vessel density regions, thick veins, and choroidal vessels exhibit the greatest fluorescein intensity, whereas small capillaries and arteries produce the least.
In the past, other functional retinal imaging techniques have spectrally measured the absorbance of oxyhemoglobin (HbO2) through retinal reflectance data; however, these measurements have been primarily used to infer retinal metabolism and do not address questions of spatial perfusion in the eye like angiography methods can. Retinal oximetry, an example, assesses retinal vasculature and metabolism through the prediction of intravessel oxygen saturation (OSat, ratio of HbO2 to Hb, hemoglobin) based on absorbance data. This technique has received a renewed interest in recent years14,15 despite its existence since the 1960s16 and has been improved by advanced calibration and modeling methods,17–22 automatic oximetry,23 and modular implementations over the years. Studies done with the commercially available retinal oximeters, the Oxymap T1 (Oxymap ehf., Reykjavik, Iceland) and the Vesselmap (IMEDOS GmbH, Jena, Germany) have contributed to the understanding of the overall oxygen metabolism of the eye for a variety of diseases,24–26 but integration into common clinical practice has remained elusive. A possible reason for oximetry's limited use is that these devices have been relegated to the oximetry of only large, superficial vessels. However, oxygen saturation measurements on the capillary level have been accomplished.27
In this work, we developed a novel technique to investigate oxyhemoglobin absorbance in a way that differs from retinal oximetry. Rather than predict OSat values, we measure oxyhemoglobin abundance using spectral absorbance information to provide a perfusion-related metric. Our technique provides a complete measurement of the HbO2 amount in the posterior pole of the eye using 43 spectral channels with a spatial sampling of 350 × 350. The spectral imager we use to collect this data matrix requires no scanning; thus, it is not susceptible to motion artifacts induced by involuntary eye movements as acquisition occurs in under 50 ms. We also use a novel unmixing procedure to separate oxyhemoglobin abundance from other spectral contributors in our absorbance data based on unmixing weights. We posit that the magnitude of oxyhemoglobin abundance at a particular location in the retina linearly scales with the amount of FA emission. This relationship exists through the Beer-Lambert law, which states that the measured absorbance magnitude relates to the path length of the absorber in question. Thus, greater absorbance is observed at each retinal location with a larger transverse blood column depth. Because larger vessels possess a greater blood column depth, the magnitude of fluorescein emission correlates with absorbance data. Based on this relationship, these abundance maps offer an alternative noninvasive method that provides perfusion-related data to overlap with FA while also providing a novel and unique functional measurement of oxygen abundance throughout the retina. Additionally, our methodology provides maps in patients under normal oxygen-breathing conditions, normoxia, which should be beneficial to meeting potential user needs in the context of medical device clearance. Comparisons of our maps with the current clinical angiographic gold standard, FA, and OCTA are drawn. We find that visual markers of oxyhemoglobin spikes and dropouts visually correlates with increases and decreases of perfusion in FA and OCTA maps. We demonstrate the capability of our technique as a potential complementary method that acquires a new functional dataset based upon oxyhemoglobin abundance rather than oxygen saturation, fluorescein emission, or OCT signal decorrelation. As clinical interpretations and understandings of OCTA results are currently evolving, this method may prove useful in filling any diagnostic gap between OCTA and FA on which clinicians have been classically trained.
Methods
Image Mapping Spectrometry
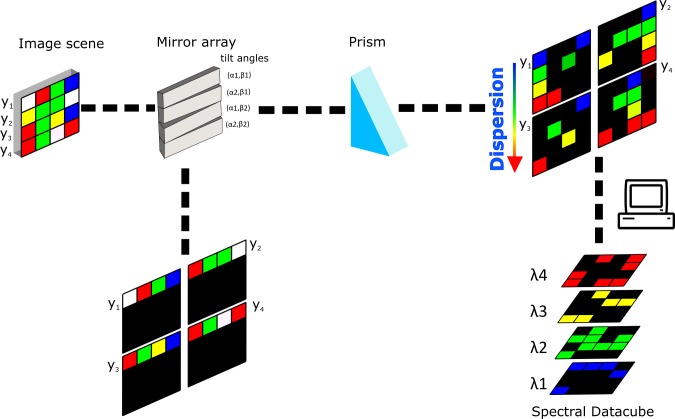
The focus of this paper was on algorithm development, oxygen signal extraction methodology, and the interpretation of abundance maps, but instrumentation is described briefly. We employed an existing snapshot hyperspectral imager for image acquisition, called the image mapping spectrometer (IMS) (working principle detailed in Fig. 1). The IMS is a well-characterized and -documented instrument with prior work in microscopy,28,29 endoscopy,30 and retinal imaging.31,32
Figure 1.
A demonstration of the IMS principle. An image scene with four rows (y1…y2) is relayed onto an aluminum mirror array. Each mirror facet has a tilt angle (α, β) that redirects the image scene, separating the rows into line images. If dispersed through a prism, the void space produced by the redirection will be filled with spectral detail. After image acquisition, the two-dimensional detector array image with the spatially and spectrally separated line images are reformatted into a hyperspectral data cube.
In Vivo Hyperspectral Image Acquisition of the Retina
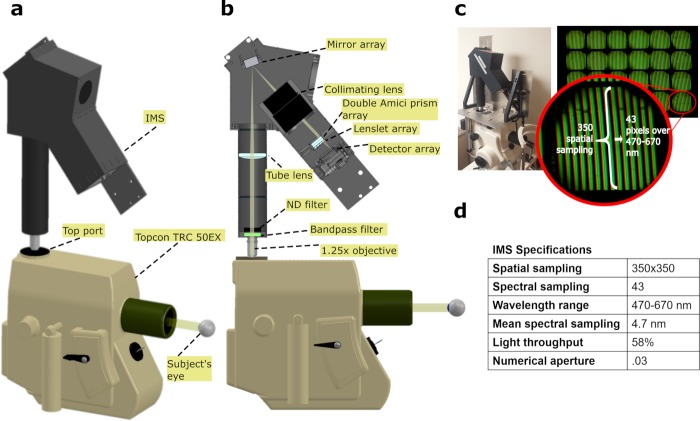
We integrated the IMS with the top port of a Topcon TRC-50EX fundus camera (Topcon, Tokyo, Japan) to collect hyperspectral data of patient retinas (Fig. 2). The IMS's full 43 spectral channels were used for the unmixing procedure (IMS specifications presented in Fig. 2d).
Figure 2.
IMS installation on fundus camera. (a) A three-dimensional rendering is shown of the IMS's installation on a Topcon fundus camera, showing relative size of the IMS to the camera. (b) A cross-section of the IMS, revealing its inner schematics. (c) Shown is a photograph of the IMS with customized installation mechanics on top of the fundus camera. Also included is an red-green-blue (RGB) image of dispersed line images as seen by the IMS's detector array. Twenty-four subgroups exist, each containing spatial/spectral information. (d) A table of IMS specifications.
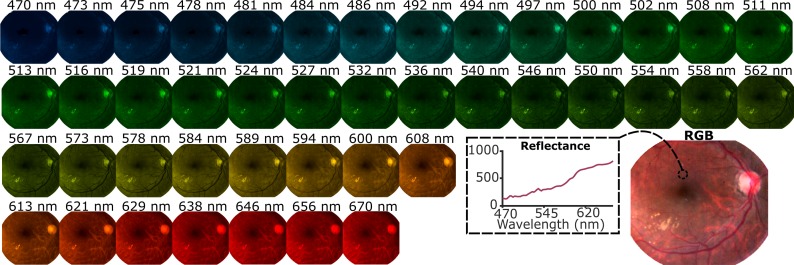
The front-optic of the IMS (Zeiss EC Epiplan-Neofluar 1.25x, .03 NA; Carl Zeiss AG, Oberkochen, Germany) relays an image from the top port onto the IMS's aluminum mirror array, which segments and redirects line images onto its charged-coupled device (CCD) array, administering dispersion through the prism array (Figs. 2b, 2c). Spatial and spectral separation on the camera (Bobcat ICL-B4820; Imperx Inc., Boca Raton, FL) is reformatted in postprocessing to generate hyperspectral data cubes (350 × 350 × 43) (Fig. 3). The pixel size was 7.4 μm2, meaning that the dispersion distance on the detector for each mirror facet image was approximately 318 μm (43 pixels). For greater information on the design, performance, and operation of this IMS system (please refer to Ref. 33 where this system has been characterized). We reduced patient discomfort to the fundus camera's illumination and motion artifacts with our fast-spectral acquisition speed (exposure time of 50 ms) by synchronizing the IMS's electronic shutter with the fundus flash. A neutral-density filter is used in the beam path to prevent detector array saturation because of the flash.
Figure 3.
Forty-three spectral channels are displayed with a wavelength-to-RGB coloring of a healthy patient's eye.
Custom-fitted aluminum mechanics were used to stabilize and align the IMS with the top port (Fig. 2c), but they did not significantly affect operation. Alignment and focus were achieved with a model eye. All eyes were imaged with the fundus camera's 50° setting of which the IMS collects approximately 30°. We estimate the spatial sampling to be 43 μm per pixel using the estimated magnification of the fundus camera at 50° and the known magnification of the IMS. Vessels at least approximately 86 μm in diameter should be resolved per the Shannon-Nyquist sampling theorem. The transistor-transistor logic signal from the fundus camera's joystick was used to synchronize the IMS's electronic shutter with an external trigger. Flash intensity was controlled through 21 different flash settings on the fundus camera's dashboard, ranging from 12 to 300 Ws.
Oxygen Signal Extraction From the Retina
The principle behind our technique relies on oxygen signal extraction from absorbance measurements.34 Absorbance for our technique is measured as
 |
Where Rfovea,λ is the reflectance at the fovea, Rretina,λ is the reflectance at regions outside of the fovea, and λ is the wavelength. By division of vascularized zones by the avascular foveal zone, we reduced the contributions of other major absorbers, which include macular pigments (lutein and zeaxanthin) and melanin, with minimal reduction of oxyhemoglobin signal. While deoxyhemoglobin is another major chromophore, the absorbance of vasculature in a healthy eye is predominantly influenced by oxyhemoglobin as this particular absorber is contained in higher concentrations in both arteries and veins, residing at average OSat values of 98 ± 10.1% and 65 ± 11.7%, respectively, by one account22 and 92.2 ± 4.1% and 57.9 ± 9.9% by another account.17 To simplify our unmixing model, we identify the endmember result of our blind unmixing process as oxyhemoglobin because of the higher concentration of this chromophore in the eye. Theoretically speaking, this endmember should be a higher-weighted oxyhemoglobin absorbance signature superimposed onto a lower-weighted deoxyhemoglobin absorbance signature. Further decomposition of our endmember result into two separate weights for each chromophore may be necessary in the future, but the current results proved sufficient to provide an abundance indicator for comparison with angiography data as oxyhemoglobin and deoxyhemoglobin should be fairly collocated in retinal vessels.
We can see how foveal division can reduce the magnitude of chromophores other than HbO2 by using a simple model of reflectance based on the Beer-Lambert law. In this model, foveal division reduces the weight of melanin and macular pigment in the calculated absorbance because of the difference in path lengths, which we will subsequently demonstrate by reducing Equation 1 to a linear equation. To start, we can define reflectance as
 |
where  is reflectance,
  is the reflectance at the point of backscattered light,
  is the absorption coefficient of a chromophore pigment,
  , at wavelength, λ, and
  is the path length. We can build a model by dividing vascular regions in the eye, reg, by the avascular fovea, fov,
 |
where mp is macular pigment, me is melanin, and HbO2 is oxyhemoglobin, representing the three chromophores we have chosen to model within the eye. Reducing this equation gives us
 |
where A is absorbance and N is added noise because of shot and camera noise. This noise is essentially random and a function of camera specifications. Our current camera model should have an approximate max signal-to-noise ratio (SNR) of 173 as estimated from its full well capacity. Higher performance cameras will give higher SNR; thus, less noisy signals, which can improve oxyhemoglobin signal recovery. The oxyhemoglobin signal is influenced by the addition of other chromophores from the different regions in the eye. However, the path length difference reduces the magnitude of these chromophores to the signal. This resulting equation is a combination of weighted spectral absorbances; therefore, we can justify the use of unmixing algorithms to further separate oxyhemoglobin signal.
We confirmed the appearance of an oxyhemoglobin signal after foveal division by comparing spectra obtained from a diseased and a healthy eye. Spectral peaks at 540 and 580 nm become visible through foveal division (Fig. 4). The mean absorbance spectrum was retrieved for a healthy eye (patient 1) and an eye with nonproliferative diabetic retinopathy (NPDR; patient 10) for increasing radial regions (R1 to R5) from the fovea. The mean reflectance spectra for each region was converted into absorbance using Equation 1 with the mean reflectance from R0 (foveal region) used as the denominator value. Characteristic absorption peaks of HbO2 occur at 540 and 580 nm. The magnitude of the peaks increases the further the radial distance because of increasing vessel size radially outward. NPDR exhibits the same trend; however, because of reduced vascular health of the retina in this state, thus potentially reduced oxygen content, the overall magnitude of these peaks is diminished.
Figure 4.
Absorbance spectra for five different regions for a normal (left) and NPDR (right) eye. Mean reflectance spectra from five radial regions are converted to absorbance using the reflectance from the foveal region (R0). Eye floaters were removed in image postprocessing for the NPDR eye.
Oxygen Signal Linearity Test Through Finger Oximetry
An additional experiment was performed to confirm that the absorbance magnitude of oxyhemoglobin scales linearly with oxygen amount. A subject held their breath while a finger region close to a pulse oximeter attachment was imaged by the IMS (Figs. 5a, 5b). We observed that the OSat value recorded by the oximeter drops linearly with absorbance signal. The same region is imaged throughout the entire process; therefore, we are measuring HbO2 abundance change as the volume of the region we imaged remained consistent. A more detailed experimental description is explained in the following paragraph below.
Figure 5.
Finger oximetry setup. (a) Optical setup used to acquire reflectance images of a subject's finger under hypoxia. (b) Left, a 3-channel contrast-enhanced composite image taken with the IMS of a subject's finger. Reflectance spectrum used in the finger oximetry is the averaged signal taken from the black box. The pulse oximeter, placed on the index finger, recorded OSat values as the patient held their breath. Top right, example absorbance spectra taken at different times. At 77s, the subject's OSat value reached its lowest at 73%. Bottom right, OD difference between an isobestic (500 nm) and nonisobestic (580 nm) channel plotted against time along with OSat.
A subject was approved for testing under a Rice University institutional review board protocol. The IMS was configured with a camera lens (M.Zuiko Digital ED 40-150mm f/4-5.6 R Lens; Olympus Corp., Tokyo, Japan) and tripod attachment to image the subject. A halogen gooseneck lamp (A20500 ACE; SCHOTT AG, Mainz, Germany) was used to illuminate the IMS field of view (FOV). A rad-57 (Masimo, Irvine, CA) pulse oximeter was used to provide OSat measurements. The reported accuracy of this device in the 70% to 100% OSat range is stated be 2%. To prolong the state of hypoxia in the patient, they hyperventilated prior. The total length of the breath holding was 2 minutes and 37 seconds. The arterial OSat started to drop around 1 minute and 20 seconds (start of plot in Fig. 5b), and the lowest point was achieved at 2 minutes and 37 seconds and measured to be 73%. Breathing resumed at this point. The pulse oximeter clock was synchronized to the same clock in the IMS FOV. Hyperspectral data were recorded at 2 data cubes/sec using a LabVIEW application (National Instruments Corporation, Austin, TX). Pulse oximeter values were averaged and acquired every 2 seconds.
A baseline spectral reflectance signature at the lowest point of arterial OSat (73%) was used as the denominator value in Equation 1 to retrieve absorbance (OD). The magnitude of the spectral peaks increased at higher OSat values with 97% producing the largest peaks. A plot in Figure 5b displays the difference between an oxygen-sensitive (nonisobestic) wavelength (580 nm) and an oxygen-insensitive (isobestic) wavelength (500 nm). This trend linearly decreases with time (R2 = .77) along with OSat measurements as retrieved by the pulse oximeter (R2 = .97).
Patient Selection for Study
Patients were selected during routine clinical visits at the Alkek Eye Clinic at the Baylor College of Medicine, Houston, TX. Patients were formally consented for this HIPAA-compliant study, which was approved by the Baylor College of Medicine institutional review board. Twenty-one eyes were imaged from 11 patients; these patients were labeled from 1 through 11. Two patient datasets were excluded from the study because of image quality caused by glare, defocus, and/or blur (patients 10 and 11), leaving patients 1 through 9 for HbO2 map development and analysis. Further, the left eye for patient 3 and the right eye for patient 7 were also excluded from this study for image quality reasons as well. The 15 remaining eyes were processed to produce HbO2 maps. Of this number, seven were healthy eyes, and eight were diseased eyes. The diseased eye group included these conditions were as follows: retinal vein occlusion (RVO), hemispheric retinal vein occlusion (HRVO), proliferative diabetic retinopathy (PDR), anterior uveitis, and AMD. Patient 1 (healthy) only underwent imaging with the IMS for the left eye; thus, the right eye was not available. Left and right eyes are identified by OS (oculus sinister) and OD (oculus dexter), respectively, in the following sections.
HbO2 maps were compared with OCTA and FA results. FA images of patients were acquired via a Spectralis HRA imaging platform (Heidelberg Engineering GmbH, Heidelberg, Germany) by a trained operator. OCTA datasets were taken with an Angioplex (Carl Zeiss AG, Oberkochen, Germany) by a trained clinician as 8 × 8 maps. These datasets were collected for the following six eyes: patient 5 (OS and OD), patient 6 (OS and OD), and patient 9 (OS and OD).
Image Registration
We chose images from our dataset of each patient without significant blur, glare, and vignetting to be registered and superimposed before spectral unmixing. Superimposition reduces the influence of striping, which is a line-stitching artifact intrinsic to the IMS. Image registration was accomplished by using a projective geometric transformation in MATLAB (MathWorks, Natick, MA) using the fitgeotrans() function. A fixed set of points was assigned for a reference image, and a set of points for unregistered images were assigned. After superimposition of registered images, the regions with no overlap were cropped and removed.
Spectral Decomposition and Retrieval of HbO2 Maps
After image registration, the foveal region in each patient's eye was identified through FA exam when available. The foveal spectrum was the average spectral result from a circular region (r = 5 pixels) centered at the fovea and was used to derive absorbance for each pixel location in the patients' eyes using Equation 1. Spectral decomposition was performed on the calculated absorbance data for each eye through nonnegative matrix factorization (NNMF), discussed further below.
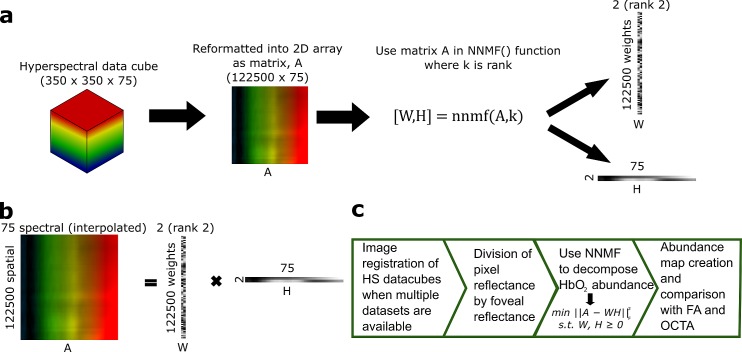
NNMF is a blind signal separation technique chosen for its positivity constraint and prior work in eye spectral unmixing35–37 (Figs. 6a, 6b). The 350 × 350 × 43 hyperspectral array reconstructed from the raw CCD frame was reformatted into an absorbance matrix (A), a 122,500 × 75 array, after applying Equation 1 for decomposition. Seventy-five spectral values were interpolated from the 43 channels to smoothen the spectral shape. These matrices were decomposed into a weight matrix (W), a 122,500 by n array where n is the user-selected rank, and an endmember matrix (H), an n by 75 array, via the nnmf() function in MATLAB using an alternating least squares update rule. The rank of the decomposition determined the number of endmembers produced, and it started at two and increased to four until HbO2 was visibly apparent as an endmember to the user. Three spectral features in this HbO2 endmember had to be observed to be considered a successful unmixing as follows: a spectral peak at 540 nm, a spectral peak at 580 nm, and a spectral minimum at 500 nm. None of the eyes required a rank higher than four. Each pixel was assigned a value based on the W matrix retrieved and applied via the reverse look-up table of the process used to reformat the 350 × 350 × 43 array into a 122,500 × 75 array. To summarize, the value of the abundance was calculated as the difference between the 500- and 580-nm channel of the HbO2 endmember retrieved, weighted by the W values assigned to each pixel. Finally, abundance images were converted into color maps (Fig. 6c).
Figure 6.
NNMF process. (a) Illustration of the unmixing process using an example rank of 2. A represents an absorbance matrix, W represents spectral weights, and H represents constituent spectral endmembers. During decomposition, 75 spectral values are interpolated from the 43 IMS channels. (b) Linear relationship between matrices, A, W, and H. (c) Overall map creation process.
Results
HbO2 Abundance Maps
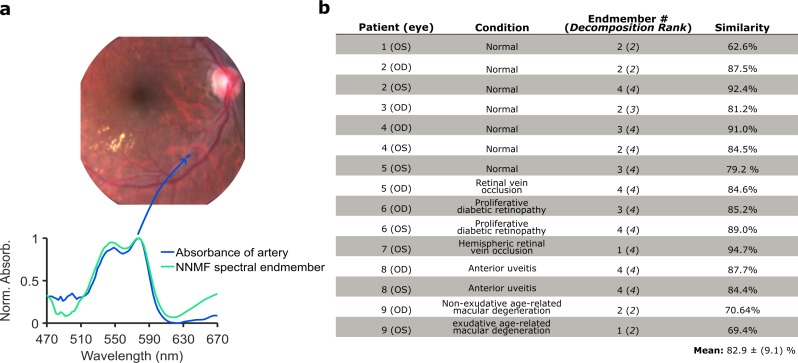
After performing the NNMF decomposition and retrieving the spectral endmember of HbO2, the standard error of the estimate was calculated between measured arterial absorbance and retrieved HbO2 endmembers for each eye (Fig. 7). Arterial absorbance was obtained by dividing a pixel region sampling the artery by adjacent tissue, a technique outlined in prior publications.32,34 The arterial absorbance of an artery is known to be 96% to 100% OSat, closely approximating the absorbance spectral shape of HbO2 and justifying its use as an in vivo measurement of true HbO2 absorbance. The standard error of the estimate was converted to a percentage and termed spectral similarity. The average spectral similarity between measured arterial absorbance in each eye and the spectral endmember product was 82.9 (±9.1)%, indicating good agreement and that NNMF reliably converges to an HbO2 product.
Figure 7.
Comparison of arterial absorbance and the HbO2 spectral endmember retrieved via NNMF. (a) Absorbance spectra retrieved from a region of the artery of patient 2. Absorbance spectra was retrieved through means described in prior work.32,34 (b) A table summarizing the patient condition, rank of NNMF, endmember at which HbO2 was retrieved, and the spectral similarity to arterial absorbance.
Patient condition and decomposition rank are also outlined (Fig. 7b). Eyes with minimal glare or vignetting, could typically be unmixed with a rank two decomposition. Because of the foveal division and −log transformation used to acquire absorbance, uneven illumination of the retina can be numerically stretched, manifesting as a spectral endmember. In those situations, the NNMF algorithm required a higher rank to deconvolve HbO2 from spectra.
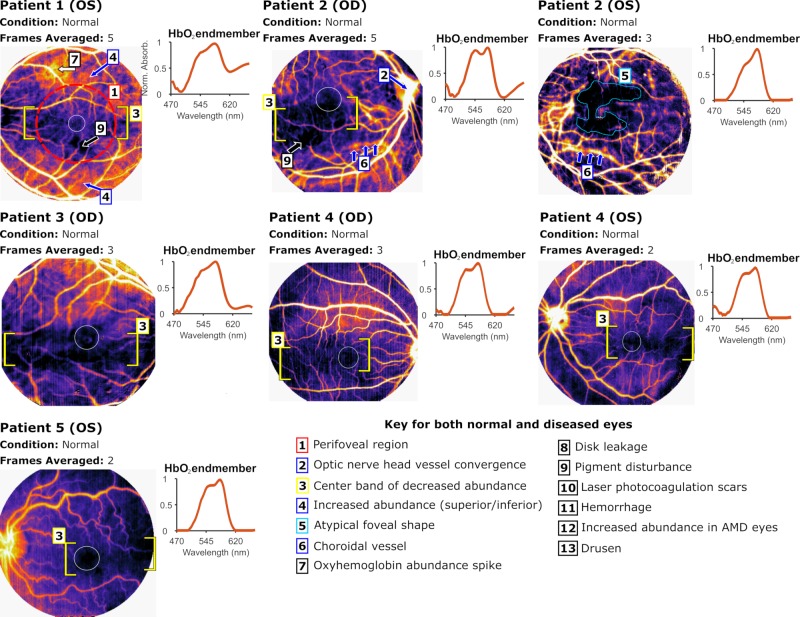
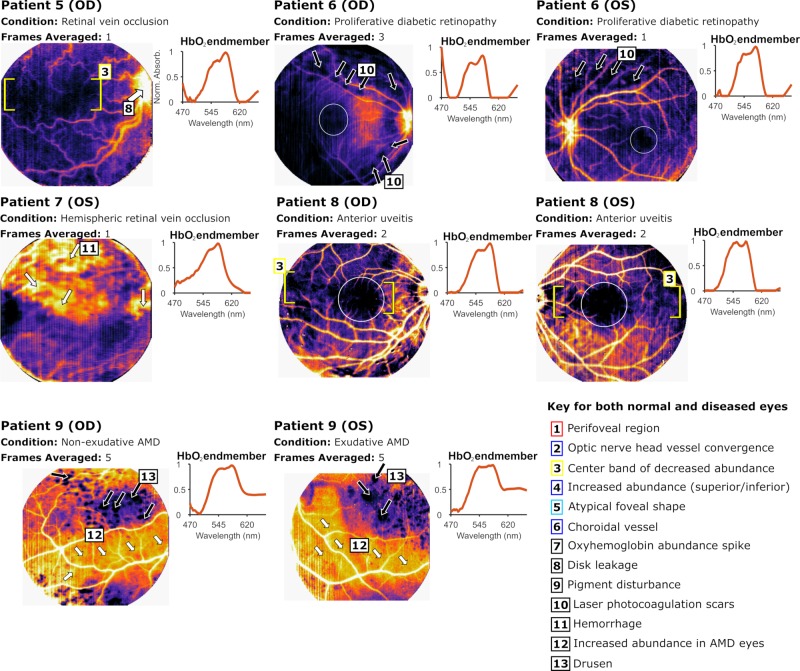
The abundance map procedure enables HbO2 to be mapped as a value to each spatial pixel and are presented as colormaps. Patients 1 through 4 are presented in Figure 8 as healthy patients while patients 6 through 9 are presented in Figure 9 as diseased patients. Patient 5 is included in both figures as one eye was healthy (OS) and the other was diseased (OD). A median filter was used in images acquired from patient 5 (OD), patient 6 (OU), and patient 9 (OU) to reduce striping, an IMS-specific image artifact. The retrieved HbO2 endmember is depicted in the top plot per eye. The perifoveal values (labeled as feature #1, shown as red, dashed circle in patient 1) for each patient were retrieved from a circular region with a radius of 80 pixels centered at the fovea and used for analysis in Figure 10. The estimated foveal zones are outlined in white based on abundance maps.
Figure 8.
HbO2 abundance maps for healthy eyes. Presented with each eye is a colormap with patient condition, number of frames (data cubes) averaged to achieve the final map, and the spectral endmember result from NNMF. The right eye map for patient 1 is not available, and the left eye map for patient 3 was excluded. Blue arrows point to unique regions of interest, white arrows correspond to localizations of increased HbO2 abundance, and black arrows point to regions devoid of unmixed HbO2 (dropout). The white circle outlines foveal boundaries as interpreted by the maps. Yellow brackets demonstrate the bounds of center bands of lower HbO2. The nasal side of the FOV exhibits large regions of HbO2 dropout in patients 4 (OD and OS), 5 (OS), and 8 (OS), pictured in Figure 9 below. Hard exudates, floaters, and pigment abnormalities appear as sharp HbO2 dropout as would be expected as these entities carry no vascular elements and hence, no HbO2.
Figure 9.
HbO2 abundance maps for diseased eyes. The right eye map for patient 7 was excluded. Refer to the caption in Figure 8 for a description of label types and organization.
Figure 10.
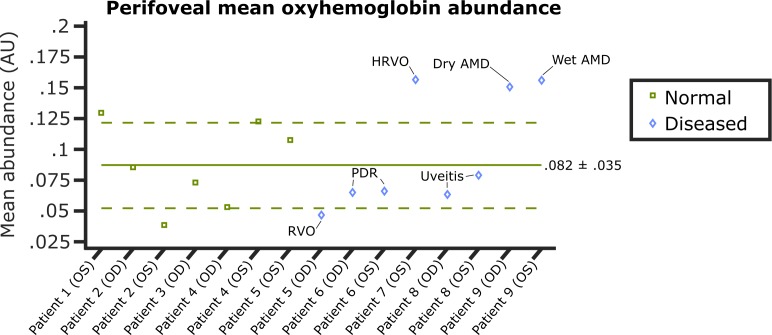
A plot of perifoveal mean HbO2 abundance for patients 1 through 9. Green line, normal mean with sigma bounds. Green squares, healthy eye values. Blue diamonds, diseased eye values. Two healthy eyes, patients 1 (OS) and 2 (OS), fall outside the sigma bounds, whereas four diseased eyes fall outside.
Vessel contrast against retinal tissue is augmented in these maps. Veins appear brighter, more infused with abundance than arteries because of their larger vessel diameter, hence larger blood column. The optic nerve head (ONH) in each eye is typically a region of concentrated signal because of the convergence of all major vessels (example shown in patient 2, OD, feature #2, blue arrow). A band of lower HbO2 abundance is observed in patients 1 (OS), 2 (OD), 3 (OD), 4 (OD and OS), 5 (OS) of the healthy eyes and patients 5 (OD) and 8 (OD and OS) of the diseased eyes (feature #3, yellow brackets). Above and below this band, greater abundance is observed, which correlates with the greater vessel size in the superior and inferior regions of the retina corresponding to the major arcades. An example of the high abundance is pointed out in patient 1 (OS, blue arrows, feature #4). One possible explanation for this behavior is that vessels decrease in diameter to become capillaries as they traverse from the superior and inferior regions to the center of the retina; thus, the magnitude of absorbance by blood in these regions also might decrease, translating into decreased HbO2 abundance. Feature #3 is nonexistent or obscured in patient 2 (OS, teal outline, feature #5) and the remainder of the diseased eyes, which supports the notion that this feature is not anomalous and is typical in otherwise healthy retinas. However, while its absence can be construed as a result of disrupted vascular health in diseased eyes, the reasoning of its absence in patient 2 is unclear and could be a function of the individual's lightly pigmented retinal pigment epithelium (RPE). Indeed, a unique characteristic of patient 2 is the visualization of large choroidal vasculature in both eyes (blue arrows, feature #6, OS and OD), owing to a possible reduced pigmentation of their RPE, which typically blocks the choroidal vasculature.
Also observed in these patients are localizations of HbO2 abundance increases/spikes (white arrows). In patient 1, we see this increase in the superior region under a branching vein (white arrow, feature #7). This anomaly still remains in the confines of clinical normalcy and may be attributed to a retinal injury received by the patient. Other increases are observed in the ONH of patient 5 (OD) who was diagnosed with a retinal vein occlusion (RVO; white arrow, feature #8). The observed blurriness at the ONH correlates with disk leakage observed in their FA exam.
Pigment disturbances in the retina are zeroed and completely unmixed from HbO2 as demonstrated in patient 1 (OS) and patient 2 (OD) with black arrows (feature #9). Additional regions of zeroed HbO2 abundance or dropout are seen in patient 6 (OD and OS) who was diagnosed with proliferative diabetic retinopathy (PDR). These regions correlate with laser photocoagulation scars (black arrows, feature #10). Patient 7 (OS), possessing a hemispheric retinal vein occlusion (HRVO), reveals pockets of hemorrhage (white arrows, feature #11). Patient 9 was diagnosed with exudative (wet) AMD in the left eye and nonexudative (dry) AMD in the right. The abundance maps for both eyes reveal increased HbO2 abundance at the fovea and underlying the major vessels in the inferior region (white arrows, feature #12); additionally, drusen boundaries are delineated through HbO2 dropout (black arrows, feature #13).
Average perifoveal abundance per eye was plotted (Fig. 10). The average value for the seven healthy eyes was .082 (±.035). Two healthy eyes fall outside the sigma bounds. For the diseased eyes, one eye from patient 7 (OS, HRVO) and both eyes from patient 9 (dry AMD and wet AMD) fall outside the upper bound, indicating higher than normal oxyhemoglobin abundance. This is expected in patient 7 because of the hemorrhaging despite this condition being inherently ischemic. In patient 9, RPE thinning may be the primary cause of increased abundance; additionally, wet AMD is characterized by neovascularization, which may contribute. Patient 5 falls below the lower sigma bound, possibly indicating lower oxygen content because of occlusion. Patient 8 (anterior uveitis) and patient 6 (PDR) both fall below the mean but remain within the sigma bounds.
HbO2 Maps and FA Comparison
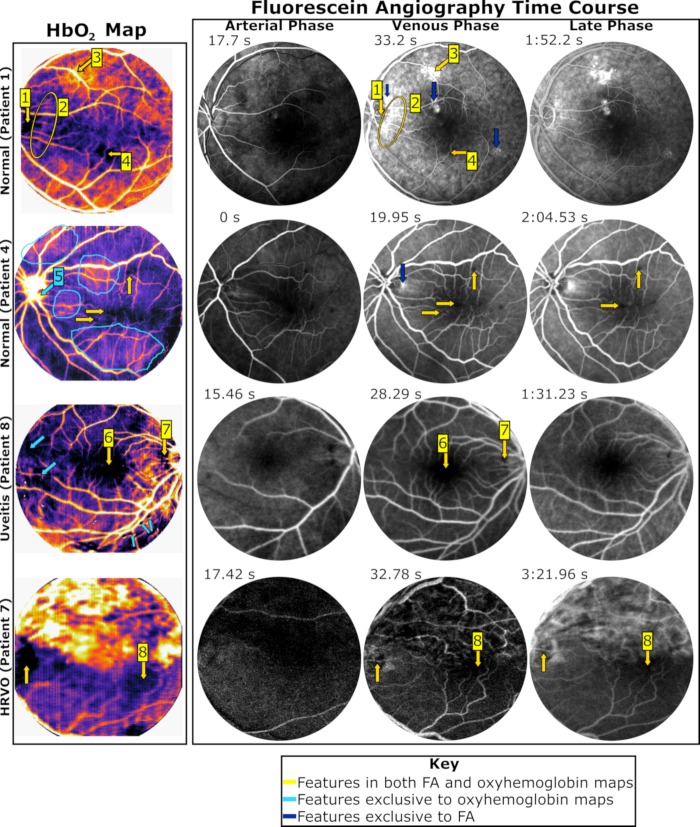
Complete FA time courses (arterial, venous, and late) are displayed for 4 of the 15 eyes used in this study. Representative frames of each phase were selected and compared against HbO2 maps (Fig. 11).
Figure 11.
Comparison between FA and HbO2 maps, highlighting representative frames from the following three exam phases: arterial, venous, and late phase. Select features are numbered. FA images were also contrast-enhanced and sharpened from their original JPEG file format to improve feature visibility. HbO2 features show generally good agreement with venous phase FA images. Because the blood column depth is largest at veins, one would expect it to produce greater absorbance, which is demonstrated here.
In these maps, locations of abundance highs and lows that correlate with hyperfluorescence and hypofluorescence are identified with yellow arrows while regions are circled in yellow. Differences between maps are identified in light blue for features exclusive to HbO2 maps and dark blue for features exclusive to FA. Selected features are numbered for clarity. In patient 1, hypofluorescence of the ONH in all stages coincides with zero HbO2 abundance (feature #1). To the right of the ONH, a streak of abundance correlates with increased hyperfluorescence in the venous and late stage (yellow outline, feature #2). Additionally, the HbO2 spike in the superior region underlying a branching vein collocates with hyperfluorescence in venous and late phase stages (feature #3). Regions of HbO2 dropout also correlate with regions of fluorescence dropout in the inferior region of the eye (feature #4). However, several regions of hyperfluorescence exist with absent HbO2 (blue arrows). Either these regions are below the detection of the present instrumentation or these regions are the result of sodium fluorescein leakage unbound from hemoglobin.
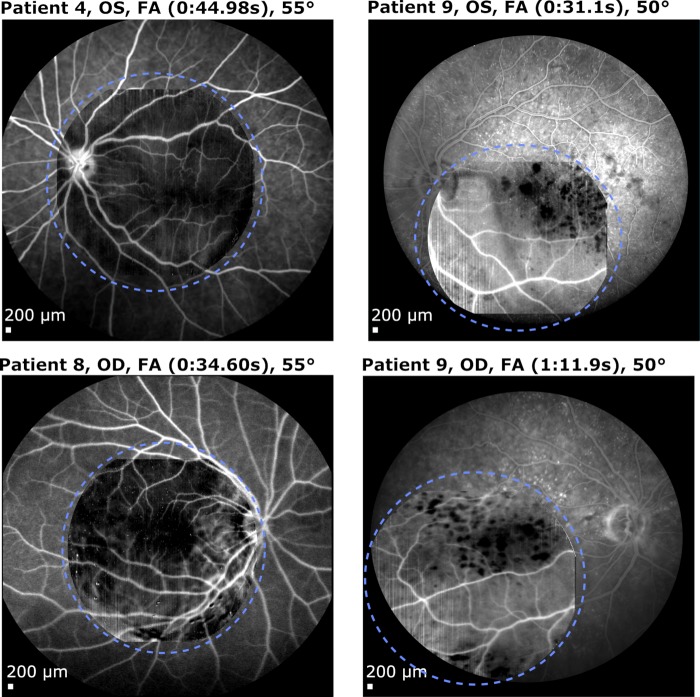
For patient 4, the shape of the fovea matches between the venous phase image and the HbO2 map. Regions of dropout on FA collocate with locations of HbO2 dropout (yellow arrows). Differences include regions of HbO2 spikes (circled in light blue) and HbO2 signal present at the ONH (feature #5). Patient 8 presents a similar foveal shape in HbO2 and in FA (feature #6). Additionally, HbO2 decrease adjacent to the ONH is exhibited in all FA stages (feature #7). Regions of exclusive HbO2 dropout (light blue arrows) were artifacts present in the hyperspectral image. Dropout at the fovea and ONH correlates as well in patient 7 (feature #8). The hemorrhaging in the upper hemisphere of the retina was observed in both FA and HbO2 maps in this patient; however, it was only present in the late phase. The signal observed in FA was interpreted as the result of leakage whereas HbO2 signal was interpreted as stagnant blood pooling. HbO2 maps were also overlaid onto larger FOV FA maps to demonstrate their good visual agreement for patients 4 (OS), 8 (OD), and 9 (OD and OS) (Fig. 12). Vessel contrast against the fundus tissue background is visually quite similar to FA images. Indeed, the signal at the ONH tends to match the signal in the FA maps; this is exemplified in patient 9.
Figure 12.
An overlaying of HbO2 maps onto large FOV FA images for patients 4, 8, and 9 (circled in light blue). HbO2 maps were converted to grayscale to highlight vessel similarities between maps.
HbO2 Maps Comparison to FA and OCTA
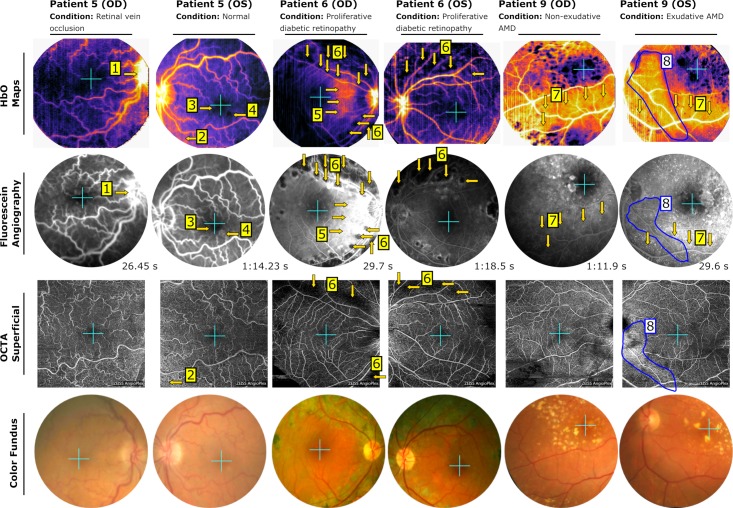
A comparison between HbO2, venous/late phase FA, and OCTA reveals striking similarities and differences between the different modalities. OCTA was collected for patient 5, 6, and 9 (OD and OS). The superficial layer from the OCTA dataset are presented for each eye (Fig. 13). Color fundus images are presented in the bottom row to provide a reference for feature interpretation. Select features are numbered for easier identification. Yellow arrows and blue outlines indicate collocated features in the maps. Teal crosses indicate the estimated foveal position between each image set.
Figure 13.
Comparison between HbO2 maps, FA, and OCTA. Patients 5, 6, and 9 are displayed (OD and OS). Top row, HbO2 maps. Second row, cropped FA images of venous/late phase results. FOV was cropped to match the IMS FOV. FA images were contrast-enhanced and sharpened from their original JPEG file format to improve feature visibility. Third row, the superficial layer of the OCTA dataset (taken with Zeiss Angioplex). Bottom row, color fundus photos as a reference. A teal cross indicates the foveal position in each map. Yellow markers and blue outlines indicate correlating features. Select features are numbered. The ONH is nonvisible/partially visible in the OCTA images and cannot be fully compared between modalities. OCTA images provide high-resolution vessel maps; however, the FOV is typically smaller.
As stated in the HbO2 Abundance Maps section, The disc leakage at the ONH for patient 5 (OD, RVO) coincides in both HbO2 map and FA result (feature #1). The left eye of patient 5 displays an increase in signal (HbO2) and vessel density (OCTA) toward the bottom left corner (feature #2). This trend is nonexistent in the FA result. Fluorescence from the choroid could obfuscate signal from the less dense superficial retinal vessels as a possible reason. However, the fluorescent dropout around the fovea coincides with the HbO2 dropout (feature #3). To the right, a hyperfluorescent region collocates with an HbO2 dropout (feature #4). Patient 6 (OD) reveals abundant similarities between all maps. On the temporal side of both HbO2 map and FA, we see a similar increase in signal (3 arrows, center right, feature #5), which is not present in OCTA. Closer to the nasal side, we see a reduction in signal for both maps. Laser photocoagulation scars are present in detail for all maps (feature #6, arrows in superior and inferior regions). In the OCTA maps, their boundaries and shape are less defined. Hyperfluorescence underlying the major artery and vein in the inferior region of patient 9 (OD and OS) correlates with increased HbO2 abundance (arrows in inferior region, feature #7). In both eyes, vessel contrast against background tissue in FA and HbO2 is reduced because of this effect. Vessel density increase is unclear for OCTA in this region. Curiously, there is a region that exhibits a unique behavior in each map (circled blue, feature #8). This region is segmented in the HbO2 map while in FA, hyperfluorescent spotting is reduced in this region. In OCTA, this region contains increased vessel density.
Discussion
In order to provide a complementary approach to noninvasive angiography, we quantified overall HbO2 abundance at contiguous spatial locations in a retinal image, encompassing not only large, superficial vessels, but fundus tissue with unresolvable vasculature. To the best of our interpretation, these oxygen content trends aligned with the hyper- and hypofluorescence of FA exams to some explicit degree, but visual differences did exist. According to our current understanding, these trends would otherwise be absent in other functional imaging methods, such as retinal oximetry and OCTA. Our results are analogous to a FA in that fluorescein emission can be captured in regions with fluorescing capillaries and smaller vessels despite being unresolved as seen in our FA exams, meaning that these locations contribute to the overall signal. Likewise, capillaries and smaller unresolved vessels should contribute HbO2 abundance signal as they contribute absorbance at pixel locations.
Several other functional imaging approaches similar to ours have been researched recently and published. These techniques have also attempted to quantify oxygen amounts in the eye; however, these techniques differed by using Beer-Lambert law,38,39 spectral shape,40,41 or initialized linear unmixing42 in their oxygen signal retrieval. Unfortunately, these studies have not attempted to interpret and validate their results in the context of using FA and/or OCTA as reference data. Furthermore, these approaches have not explicitly described or developed an angiographic analog with the exception of one multispectral imaging approach.43 However, this approach required bright illumination conditions and induced hypoxia to operate, possibly compromising patient comfort. Within the confines of this present study, we demonstrated our technology and elucidated our unmixing approach to generate high-resolution maps acquired with unmodified fundus camera operation. To attempt validation, we interpreted 15 different eyes with FA and OCTA as a ground truth for locations of high and low perfusion in the eye. We would like to emphasize that hyperspectral imagers reduce the need for calibration coefficients when measuring biomarker abundance in comparison to other two-wavelength or multispectral (<16 channels) instruments as demonstrated by our prior publication.32 Additionally, this technology and methodology does not have to be limited to HbO2 abundance retrievals exclusively as its large number of spectral channels could allow extraction of other biomarkers in the future.
As discussed before, general trends of circulation in OCTA images might vary in comparison to FA images because of the source of their respective signals. While OCTA's signal is based upon either phase variance or amplitude decorrelation between successive frames, FA maps are based upon signal retrieved from fluorescein emission. While this work presently emphasizes HbO2 abundance trends (spikes, dropouts) that coincide with FA trends, we would like to draw some discussion as to the originations of discrepancies between our maps and FA. We posit that our algorithm is in the relatively early stages of development, needing additional refinement through more feasibility and validation studies. Additionally, improved hardware (e.g., improved camera specifications) could provide higher dynamic range and SNR to produce less noisy signals during foveal division, which can be implemented with a next generation IMS. Despite these limitations, a major factor in discrepancies could be because of the source of our signal as well. While FA acquires transmitted light from dye emission originating from behind the retina and within blood vessels, our HbO2 maps are strictly measuring oxyhemoglobin absorbance acquired through the backscattering of light from the fundus camera flash. Thus, discrepancies could arise because of two large factors, large fluorescence emissions from the choroid that were transmitted through the RPE and emissions from leaked unbound sodium fluorescein. Additionally, it is possible that errors can arise during foveal division because of HbO2 being present in the avascular zone from choroidal vessels, but as seen in the fluorescein exam images in Figures 12 and 13, signal from choroidal vessels underlying this avascular foveal zone is typically not present and blocked by pigmentation. Regardless, HbO2 abundance maps present a functional imaging approach that could help provide an analog to angiography and could aid the study of diseases. FA as a direct photography method still possesses clear distinct advantages over noninvasive methods: a larger FOV, no major postimage processing, reduced image artifacts, and a time course that can reflect functional occurrences, such as leakage. However, our approach might provide another method for measuring the oxygenation of retinal tissue directly and be able to identify regions of stagnant blood pooling in eyes with hemorrhaging as seen in Patient 7 (Fig. 11) that would otherwise not align with fluorescein emission or not be observable in OCTA because of the lack of motion for OCT signal decorrelation. Additionally, future studies with our approach could include an oxygen time course using O2 breathing (hyperoxia) to identify regions of blocked arterial flow. Further, a more advanced clinical study is needed with more statistical analyses. We are presently planning instrumentation and clinical study improvements, but our technique offers a promising functional imaging development.
Acknowledgments
The authors thank Dr. Robert E. Coffee for his help in obtaining initial funding for this project.
Supported by grant R01CA186132 from the National Institutes of Health (NIH) and the Institute of Biosciences and Bioengineering (IBB) Medical Innovation Grant.
Disclosure: J.G. Dwight, None; C.Y. Weng, Allergan, Inc., Alimera Sciences, Inc., Alcon, Inc. (C); M.E. Pawlowski, None; T.S. Tkaczyk, has financial interests in Attoris LLC (I) focusing on hyperspectral technologies and is also a co-inventor of IMS imaging technology (P) used to acquire hyperspectral data.
References
- 1.Friedman DS, O'Colmain BJ, Muñoz B, et al. Prevalence of age-related macular degeneration in the United States. Arch Ophthalmol. 2004;122:564–572. doi: 10.1001/archopht.122.4.564. [DOI] [PubMed] [Google Scholar]
- 2.Velez-Montoya R, Olson JL, Mandava N. Fluorescein angiography and indocyanine green angiography. In: Yanoff M, Duker JS, editors. Ophthalmology: Expert Consult. Philadelphia, PA: Elsevier-Saunders; 2014. pp. 440–447. [Google Scholar]
- 3.Lira RPC, de A Oliveira CL, Marques MVRB, et al. Adverse reactions of fluorescein angiography: a prospective study. Arq Bras Oftalmol. 2007;70:615–618. doi: 10.1590/s0004-27492007000400011. [DOI] [PubMed] [Google Scholar]
- 4.Yannuzzi LA, Rohrer KT, Tindel LJ, et al. Fluorescein angiography complication survey. Ophthalmology. 1986;93:611–617. doi: 10.1016/s0161-6420(86)33697-2. [DOI] [PubMed] [Google Scholar]
- 5.Makita S, Hong Y, Yamanari M, Yatagai T, Yasuno Y. Optical coherence angiography. Opt Express. 2006;14:7821–7840. doi: 10.1364/oe.14.007821. [DOI] [PubMed] [Google Scholar]
- 6.Fingler J, Zawadzki RJ, Werner JS, Schwartz D, Fraser SE. Volumetric microvascular imaging of human retina using optical coherence tomography with a novel motion contrast technique. Opt Express. 2009;17:22190–22200. doi: 10.1364/OE.17.022190. [DOI] [PMC free article] [PubMed] [Google Scholar]
- 7.Kim DY, Fingler J, Werner JS, Schwartz DM, Fraser SE, Zawadzki RJ. In vivo volumetric imaging of human retinal circulation with phase-variance optical coherence tomography. Biomed Opt Express. 2011;2:1504–1513. doi: 10.1364/BOE.2.001504. [DOI] [PMC free article] [PubMed] [Google Scholar]
- 8.Mariampillai A, Standish BA, Moriyama EH, et al. Speckle variance detection of microvasculature using swept-source optical coherence tomography. Opt Lett. 2008;33:1530–1532. doi: 10.1364/ol.33.001530. [DOI] [PubMed] [Google Scholar]
- 9.Jia Y, Tan O, Tokayer J, et al. Split-spectrum amplitude-decorrelation angiography with optical coherence tomography. Opt Express. 2012;20:4710–4725. doi: 10.1364/OE.20.004710. [DOI] [PMC free article] [PubMed] [Google Scholar]
- 10.Huang Y, Zhang Q, Thorell MR, et al. Swept-source OCT angiography of the retinal vasculature using intensity differentiation-based optical microangiography algorithms. Ophthalmic Surg Lasers Imaging Retina. 2014;45:382–389. doi: 10.3928/23258160-20140909-08. [DOI] [PMC free article] [PubMed] [Google Scholar]
- 11.Inoue M, Jung JJ, Balaratnasingam C, et al. A Comparison between optical coherence tomography angiography and fluorescein angiography for the imaging of type 1 neovascularization. Invest Ophthalmol Vis Sci. 2016;57:OCT314–OCT323. doi: 10.1167/iovs.15-18900. [DOI] [PubMed] [Google Scholar]
- 12.Gao SS, Jia Y, Zhang M, et al. Optical coherence tomography angiography. Invest Ophthalmol Vis Sci. 2016;57:OCT27–OCT36. doi: 10.1167/iovs.15-19043. [DOI] [PMC free article] [PubMed] [Google Scholar]
- 13.de Carlo TE, Romano A, Waheed NK, Duker JS. A review of optical coherence tomography angiography (OCTA) Int J Retina Vitreous. 2015;1:5. doi: 10.1186/s40942-015-0005-8. [DOI] [PMC free article] [PubMed] [Google Scholar]
- 14.Hardarson SH. Retinal oximetry. Acta Ophthalmol. 2013;91(thesis):1–47. doi: 10.1111/aos.12086. [DOI] [PubMed] [Google Scholar]
- 15.Beach J. Pathway to retinal oximetry. Transl Vis Sci Technol. 2014;3(5) doi: 10.1167/tvst.3.5.2. [DOI] [PMC free article] [PubMed] [Google Scholar]
- 16.Hickam JB, Sieker HO, Frayser R. Studies of retinal circulation and A-V oxygen difference in man. Trans Am Clin Climatol Assoc. 1959;71:34–44. [PMC free article] [PubMed] [Google Scholar]
- 17.Schweitzer D, Hammer M, Kraft J, Thamm E, Konigsdorffer E, Strobel J. In vivo measurement of the oxygen saturation of retinal vessels in healthy volunteers. IEEE Trans Biomed Eng. 1999;46:1454–1465. doi: 10.1109/10.804573. [DOI] [PubMed] [Google Scholar]
- 18.Beach JM, Schwenzer KJ, Srinivas S, Kim D, Tiedeman JS. Oximetry of retinal vessels by dual-wavelength imaging: calibration and influence of pigmentation. J Appl Physiol. 1999;86:748–758. doi: 10.1152/jappl.1999.86.2.748. [DOI] [PubMed] [Google Scholar]
- 19.Smith MH. Optimum wavelength combinations for retinal vessel oximetry. Appl Opt. 1999;38:258–267. doi: 10.1364/ao.38.000258. [DOI] [PubMed] [Google Scholar]
- 20.Smith MH, Denninghoff KR, Lompado A, Hillman LW. Effect of multiple light paths on retinal vessel oximetry. Appl Opt. 2000;39:1183–1193. doi: 10.1364/ao.39.001183. [DOI] [PubMed] [Google Scholar]
- 21.Denninghoff KR, Sieluzycka KB, Hendryx JK, Ririe TJ, DeLuca L, Chipman RA. Retinal oximeter for the blue-green oximetry technique. J Biomed Opt. 2011;16 doi: 10.1117/1.3638134. [DOI] [PMC free article] [PubMed] [Google Scholar]
- 22.Hammer M, Vilser W, Riemer T, Schweitzer D. Retinal vessel oximetry-calibration, compensation for vessel diameter and fundus pigmentation, and reproducibility. J Biomed Opt. 2008;13:054015. doi: 10.1117/1.2976032. [DOI] [PubMed] [Google Scholar]
- 23.Hardarson SH, Harris A, Karlsson RA, et al. Automatic Retinal Oximetry. Invest Ophthalmol Vis Sci. 2006;47:5011–5016. doi: 10.1167/iovs.06-0039. [DOI] [PubMed] [Google Scholar]
- 24.Hammer M, Vilser W, Riemer T, et al. Diabetic patients with retinopathy show increased retinal venous oxygen saturation. Graefes Arch Clin Exp Ophthalmol. 2009;247:1025–1030. doi: 10.1007/s00417-009-1078-6. [DOI] [PubMed] [Google Scholar]
- 25.Olafsdottir OB, Vandewalle E, Abegão Pinto L, et al. Retinal oxygen metabolism in healthy subjects and glaucoma patients. Br J Ophthalmol. 2014;98:329–333. doi: 10.1136/bjophthalmol-2013-303162. [DOI] [PubMed] [Google Scholar]
- 26.Geirsdottir A, Hardarson SH, Olafsdottir OB, Stefánsson E. Retinal oxygen metabolism in exudative age-related macular degeneration. Acta Ophthalmol. 2014;92:27–33. doi: 10.1111/aos.12294. [DOI] [PubMed] [Google Scholar]
- 27.Nelson DA, Bartov E, Rock T, et al. High-resolution wide-field imaging of perfused capillaries without the use of contrast agent. Clin Ophthalmol. 2011;5:1095–1106. doi: 10.2147/OPTH.S20103. [DOI] [PMC free article] [PubMed] [Google Scholar]
- 28.Gao L, Kester RT, Hagen N, Tkaczyk TS. Snapshot Image Mapping Spectrometer (IMS) with high sampling density for hyperspectral microscopy. Opt Express. 2010;18:14330–14344. doi: 10.1364/OE.18.014330. [DOI] [PMC free article] [PubMed] [Google Scholar]
- 29.Elliott AD, Gao L, Ustione A, et al. Real-time hyperspectral fluorescence imaging of pancreatic β-cell dynamics with the image mapping spectrometer (IMS) J Cell Sci. 2012;125(Pt 20):4833–40. doi: 10.1242/jcs.108258. [DOI] [PMC free article] [PubMed] [Google Scholar]
- 30.Kester RT, Bedard N, Gao L, Tkaczyk TS. Real-time snapshot hyperspectral imaging endoscope. J Biomed Opt. 2011;16(5) doi: 10.1117/1.3574756. [DOI] [PMC free article] [PubMed] [Google Scholar]
- 31.Gao L, Smith RT, Tkaczyk TS. Snapshot hyperspectral retinal camera with the Image Mapping Spectrometer (IMS) Biomed Opt Express. 2012. pp. 48–54. [DOI] [PMC free article] [PubMed]
- 32.Dwight JG, Weng CY, Coffee RE, Pawlowski ME, Tkaczyk TS. Hyperspectral image mapping spectrometry for retinal oximetry measurements in four diseased eyes. Int Ophthalmol Clin. 2016;56:25–38. doi: 10.1097/IIO.0000000000000139. [DOI] [PMC free article] [PubMed] [Google Scholar]
- 33.Bedard N, Hagen N, Gao L, Tkaczyk TS. Image mapping spectrometry: calibration and characterization. Opt Eng. 2012;51 doi: 10.1117/1.OE.51.11.111711. [DOI] [PMC free article] [PubMed] [Google Scholar]
- 34.Delori FC. Noninvasive technique for oximetry of blood in retinal vessels. Appl Opt. 1988;27:1113–1125. doi: 10.1364/AO.27.001113. [DOI] [PubMed] [Google Scholar]
- 35.Fawzi AA, Lee N, Acton JH, Laine AF, Smith RT. Recovery of macular pigment spectrum in vivo using hyperspectral image analysis. J Biomed Opt. 2011;16:106008. doi: 10.1117/1.3640813. [DOI] [PMC free article] [PubMed] [Google Scholar]
- 36.Lee N, Wielaard J, Fawzi AA, et al. In vivo snapshot hyperspectral image analysis of age-related macular degeneration. Conf Proc IEEE Eng Med Biol Soc. 2010;2010:5363–5366. doi: 10.1109/IEMBS.2010.5626463. [DOI] [PMC free article] [PubMed] [Google Scholar]
- 37.Smith RT, Post R, Johri A, et al. Simultaneous decomposition of multiple hyperspectral data sets: signal recovery of unknown fluorophores in the retinal pigment epithelium. Biomed Opt Express. 2014;5:4171–4185. doi: 10.1364/BOE.5.004171. [DOI] [PMC free article] [PubMed] [Google Scholar]
- 38.Desjardins M, Sylvestre J-P, Jafari R, et al. Preliminary investigation of multispectral retinal tissue oximetry mapping using a hyperspectral retinal camera. Exp Eye Res. 2016;146:330–340. doi: 10.1016/j.exer.2016.04.001. [DOI] [PubMed] [Google Scholar]
- 39.Nourrit V, Denniss J, Muqit MMK, et al. High-resolution hyperspectral imaging of the retina with a modified fundus camera. J Fr Ophthalmol. 2010;33(10):686–692. doi: 10.1016/j.jfo.2010.10.010. [DOI] [PubMed] [Google Scholar]
- 40.Khoobehi B, Beach JM, Kawano H. Hyperspectral imaging for measurement of oxygen saturation in the optic nerve head. Invest Ophthalmol Vis Sci. 2004;45:1464–1472. doi: 10.1167/iovs.03-1069. [DOI] [PubMed] [Google Scholar]
- 41.Firn KA, Khoobehi B. Novel noninvasive multispectral snapshot imaging system to measure and map the distribution of human vessel and tissue hemoglobin oxygen saturation. Int J Ophthalmic Res. 2015;1:48–58. [Google Scholar]
- 42.Alabboud I, Muyo G, Gorman A, et al. Novel Optical Instrumentation for Biomedical Applications III (2007), Paper 6631_22. Optical Society of America; 2007. New spectral imaging techniques for blood oximetry in the retina. 6631_22. [Google Scholar]
- 43.MacKenzie LE. In vivo microvascular oximetry using multispectral imaging. Glasgow, UK: University of Glasgow, College of Science and Engineering;; 2016. Thesis. [Google Scholar]


